MEMBERS ONLY

GNG TV: A Low, But is it THE Low?

by Alex Cole,
Co-founder, GoNoGo Charts®

by Tyler Wood,
Co-founder, GoNoGo Charts®
Investors and analysts see signs of life amid risk assets – bullish divergences, holding support, relief in rates and weakening USD – however, bear market relief rallies can be tempting and destructive. On this week's edition of the GoNoGo Charts show, Alex and Tyler look through signs across asset classes...
READ MORE
MEMBERS ONLY

How to Handle V-Bottoms

by Joe Rabil,
President, Rabil Stock Research
On this week's edition of Stock Talk with Joe Rabil, Joe shows specific ways to handle V-bottom patterns, as well as Fake-Out patterns. By looking at multiple time frames and using key price levels, we can look to be more aggressive when the situation is suitable. He then...
READ MORE
MEMBERS ONLY
There's A Lot To Like About This Rally

by Tom Bowley,
Chief Market Strategist, EarningsBeats.com
Hands down, this is the best day of 2022. There have been better days in terms of percentage performance, but considering the negative economic news this morning, it's quite noteworthy that money is rotating into aggressive sectors at the expense of defensive sectors.
At our MarketVision 2022 event...
READ MORE
MEMBERS ONLY
Mish's Daily: What Does a Trading Range Look Like?
Buying ahead of taking out last week's high was premature. Getting overly negative unless we fail last week's low is equally premature.
I realize how sexy it is to be either very bullish or very bearish. And I realize that given many different reasons, the sentiment...
READ MORE
MEMBERS ONLY
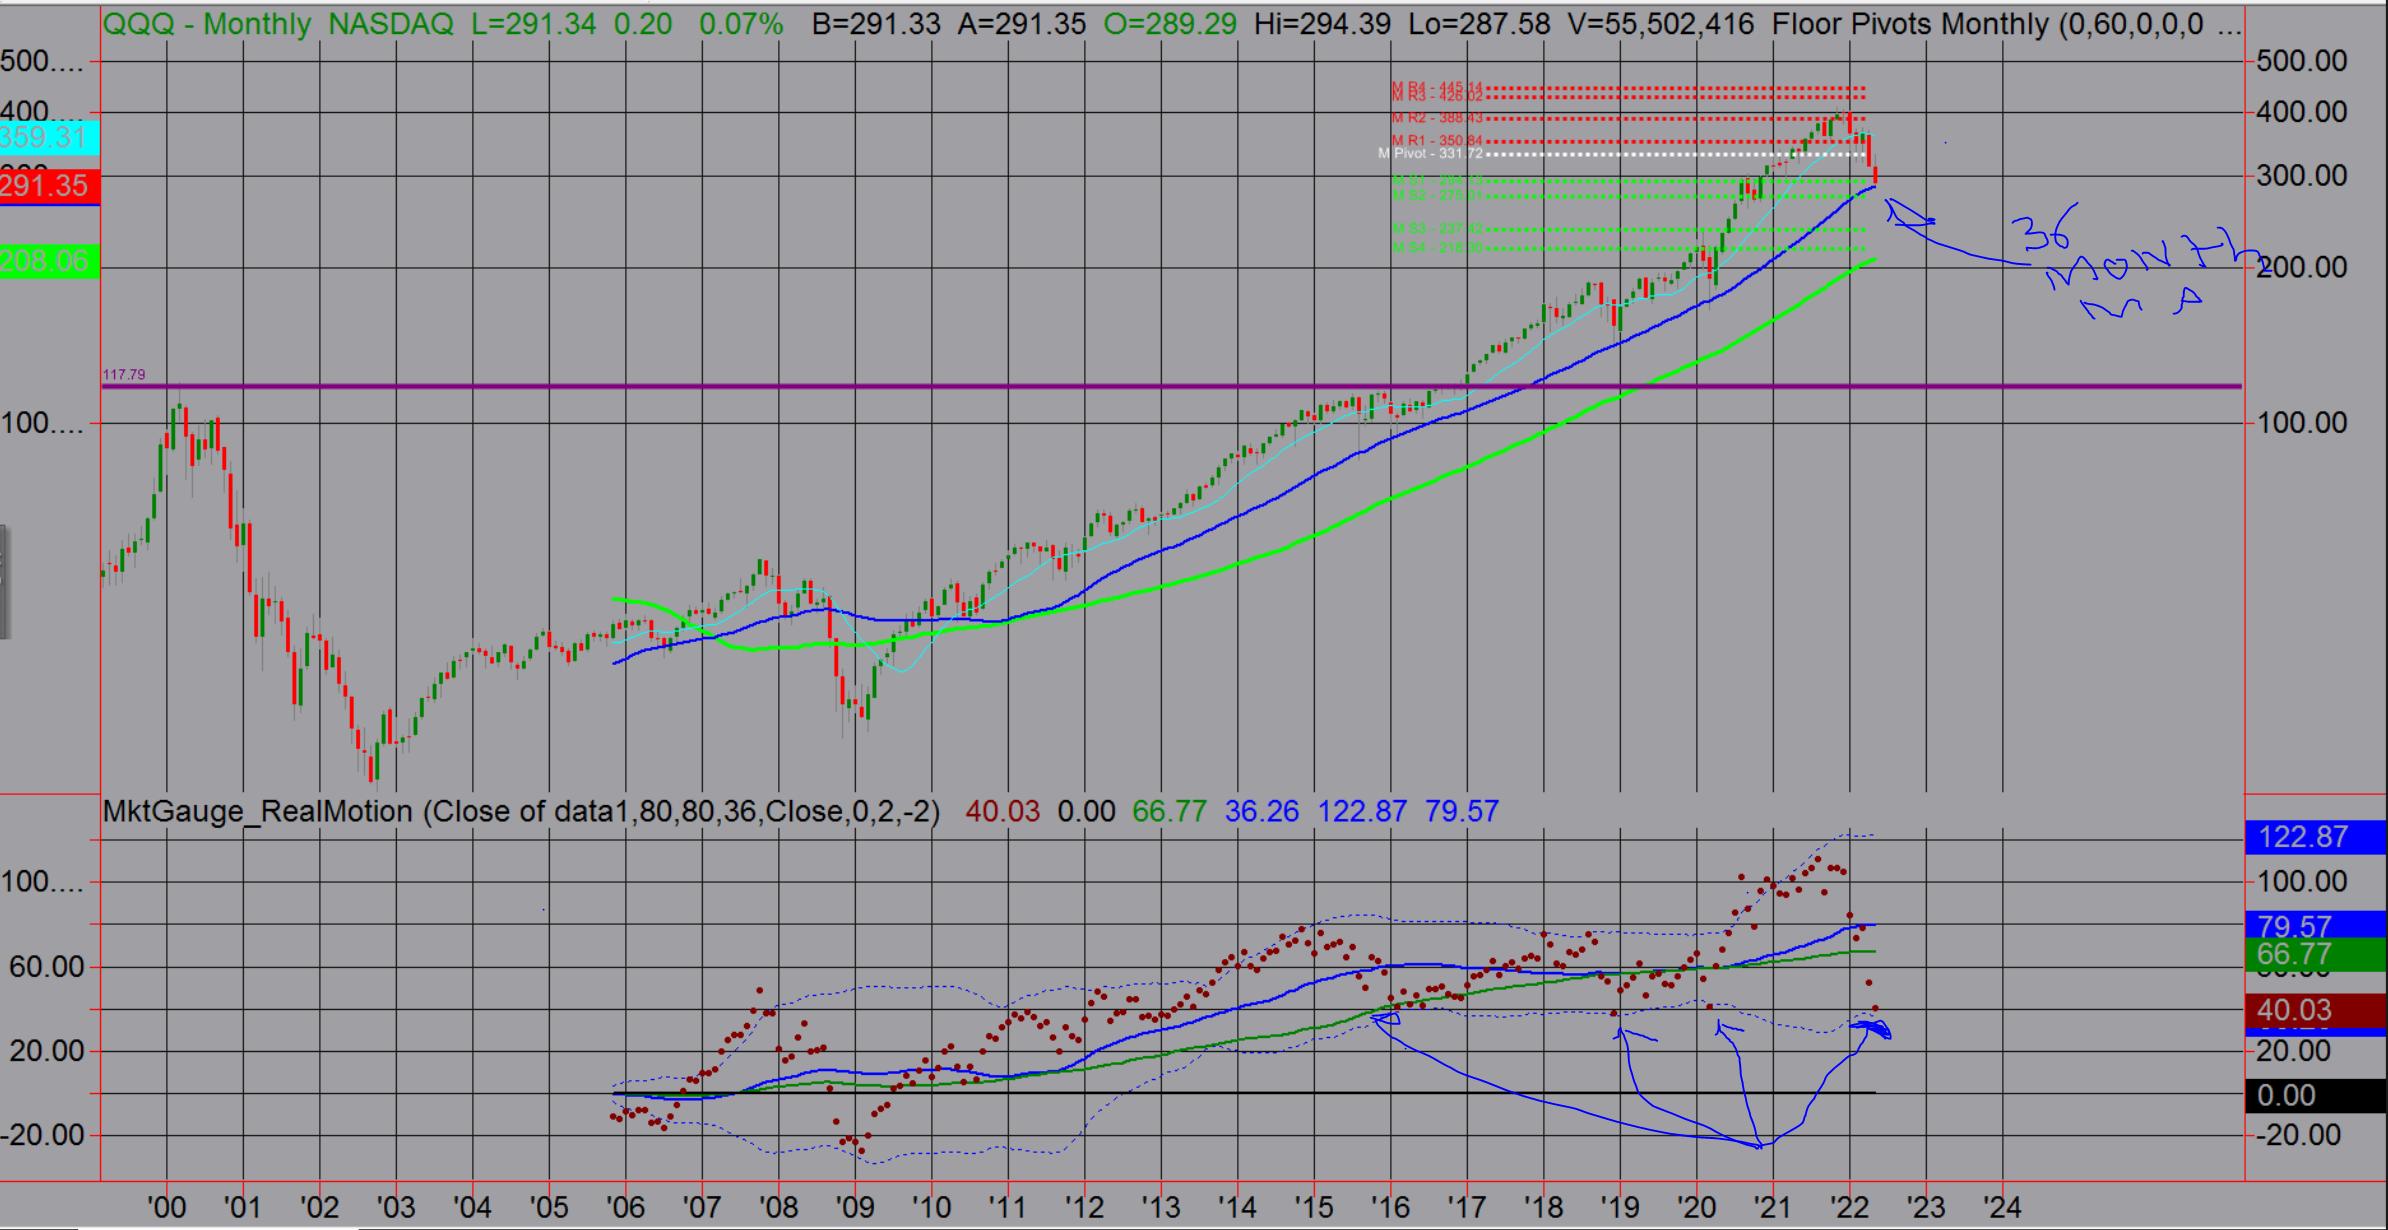
Mish's Daily: Can Big Tech Save the Day Again?
Since 2010, QE saved the markets and the economy, which in turn led to big tech as the 10-year bull market savior. The monthly chart of QQQs, which goes back from the dot com bubble, highlights the run that began in 2010. Yet it also shows that it took another...
READ MORE
MEMBERS ONLY

Sector Spotlight: 62% of the Market is Now in a Downtrend

by Julius de Kempenaer,
Senior Technical Analyst, StockCharts.com
In this edition of StockCharts TV's Sector Spotlight, I begin with an update on current rotations in asset classes and sectors, highlighting continued strength for defensive sectors. As this Tuesday (5/31) is both the last Tuesday of the month (of May) and the end of the month,...
READ MORE
MEMBERS ONLY

Massive Top Formation Completed
by Julius de Kempenaer,
Senior Technical Analyst, StockCharts.com
If there is one chart we should be watching at the moment, it should be, IMHO, the ratio between Growth and Value stocks.
The image above shows this relation on a weekly chart going back 15 years. After a multi-year rising trend and an almost exponential acceleration in 2019-2020, a...
READ MORE
MEMBERS ONLY
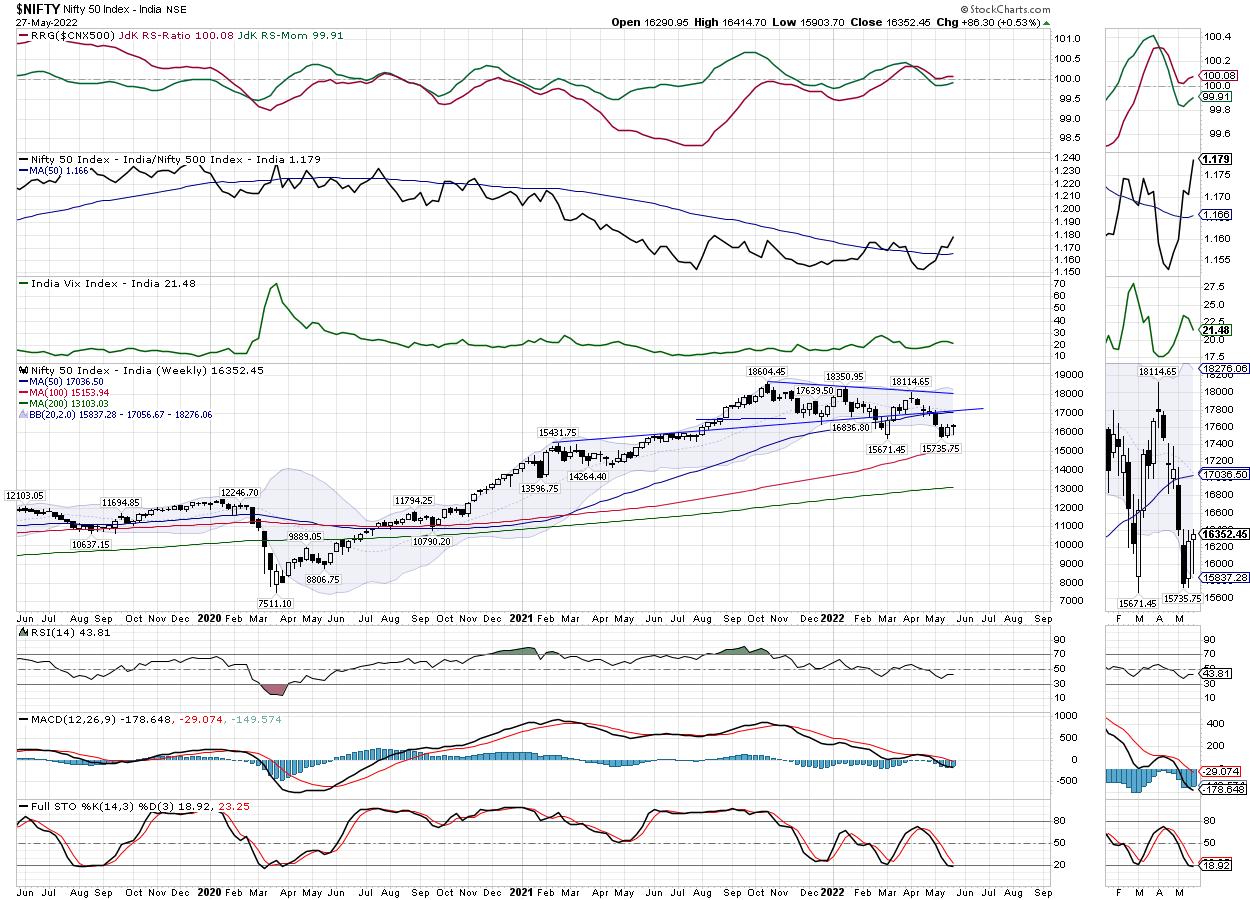
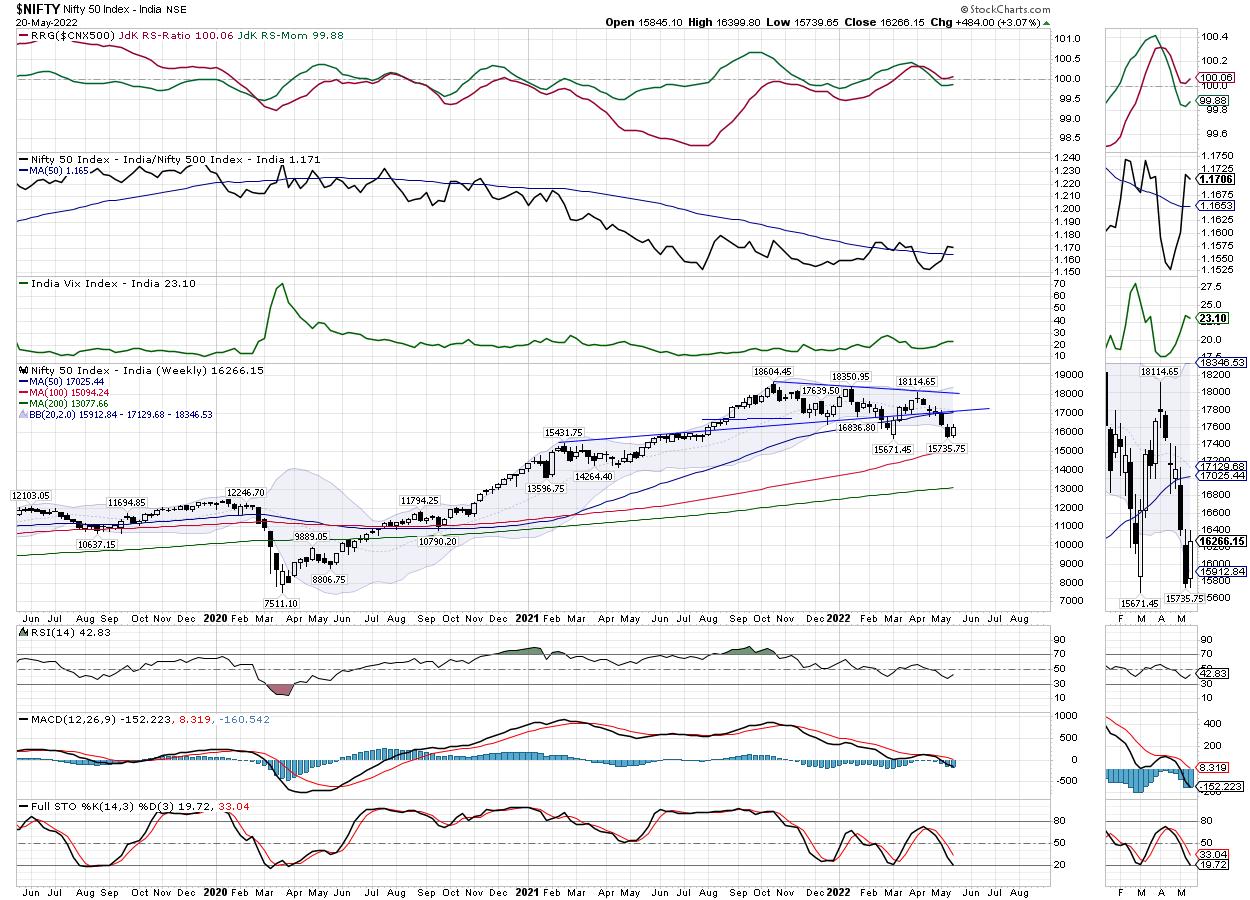
Week Ahead: NIFTY Likely to Trade With Positive Bias if Global Cues Permit; Major Pockets Show Improvement in Relative Strength

by Milan Vaishnav,
Founder and Technical Analyst, EquityResearch.asia and ChartWizard.ae
It was a week of consolidation; a positive consolidation, in fact, where the markets oscillated in a broad range before closing the week with mild gains. The NIFTY saw itself trading in a 511-point range, as compared to the 690-point range in the week before this one. In the last...
READ MORE
MEMBERS ONLY
Why Bear Market Rallies Are So Seductive

by David Keller,
President and Chief Strategist, Sierra Alpha Research
2022 has been a clear bear market phase for risk assets, particularly the equity markets. The signs were building in January, seemed validated by a new low in February, then were absolutely confirmed with the failed breakout above 4600 in late March.
Somewhere in the first three months of the...
READ MORE
MEMBERS ONLY

Market Bottom is In! Will It Last?

by Mary Ellen McGonagle,
President, MEM Investment Research
On this episode of StockCharts TV'sThe MEM Edge, Mary Ellen reviews the price action that signaled that the markets are in a new uptrend. She also shares stocks poised to participate and what to be on the lookout for to indicate that the rally will continue.
This video...
READ MORE
MEMBERS ONLY

Can We Hammer Out a Bottom?

by TG Watkins,
Director of Stocks, Simpler Trading
In this week's edition of Moxie Indicator Minutes, TG discusses the bear market sentiment in the market and the factors that got us here. He then explains why he thinks we should prepare for choppy price action ahead.
This video was originally broadcast on May 27, 2022. Click...
READ MORE
MEMBERS ONLY

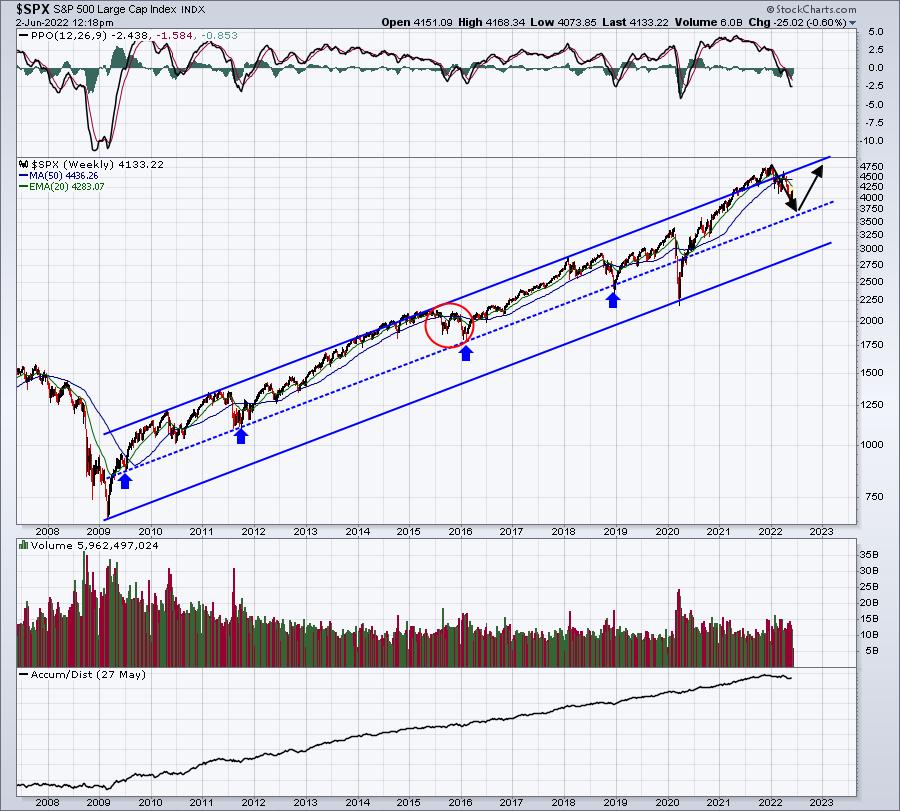
THIS WEEK'S REBOUND SUGGESTS SHORT-TERM STOCK BOTTOM IN PLACE -- BUT HOW FAR CAN IT RALLY?

by John Murphy,
Chief Technical Analyst, StockCharts.com
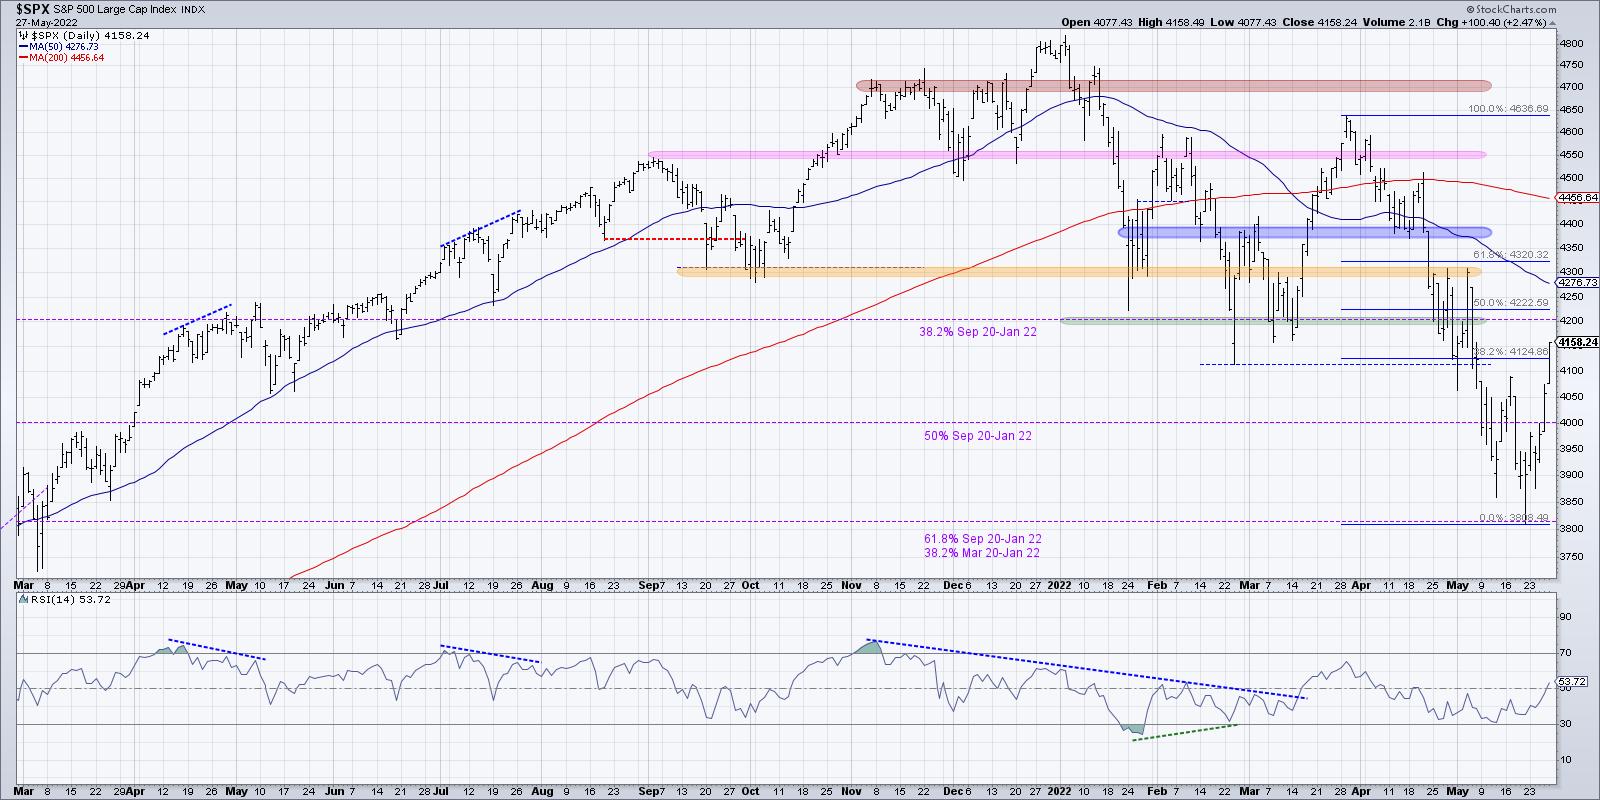
WEEKLY S&P CHART SHOWS OVERSOLD CONDITION... Stocks are having their best week in two months which suggests that a short-term bottom may be in place. Before looking at daily charts, however, it's worth checking a weekly chart to keep things in perspective. The weekly bars in...
READ MORE
MEMBERS ONLY

Palladium: A Trend Changing Event or Correction Overshoot?

by Arthur Hill,
Chief Technical Strategist, TrendInvestorPro.com
There are two commodity ETFs with falling wedge patterns working. One falling wedge resulted in a deep pullback and the other in a shallow pullback. Either way, I view these falling wedges as corrections within uptrends and am watching for breakouts. This article will look at the deep pullback in...
READ MORE
MEMBERS ONLY
GNG TV: Is There Enough Momentum to Change the Trend?
by Alex Cole,
Co-founder, GoNoGo Charts®
by Tyler Wood,
Co-founder, GoNoGo Charts®
On this week's edition of the GoNoGo Charts show, Alex and Tyler take a look through the markets and discuss how the "Go" trend in the dollar is being tested for the first time in months. Likewise, the relentless rising rates of the last few months...
READ MORE
MEMBERS ONLY
How to Use MACD to Improve Your Entry
by Joe Rabil,
President, Rabil Stock Research
On this week's edition of Stock Talk with Joe Rabil, Joe Rabil discusses how he uses a specific MACD pattern in 2 consecutive time frames to help to improve and confirm entry. He starts with a weekly chart, showing the shift in trend and where the best high-probability...
READ MORE
MEMBERS ONLY

Two Simple Secrets to Longer-Term Trading Success

by Dave Landry,
Founder, Sentive Trading, LLC
On this week's edition of Trading Simplified, given the iffy nature of the market, Dave takes a 30,000 view using longer-term Landry Light to see where we are. He continues his discussion about "performance-based investing" and how simple tools such as the "net-net"...
READ MORE
MEMBERS ONLY
Keep Oil and Energy Companies on Your Watchlist
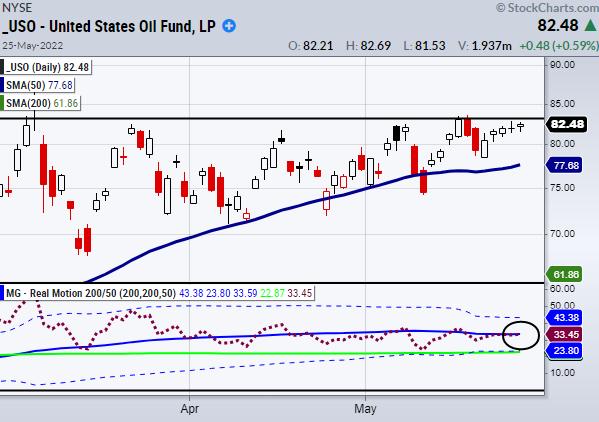
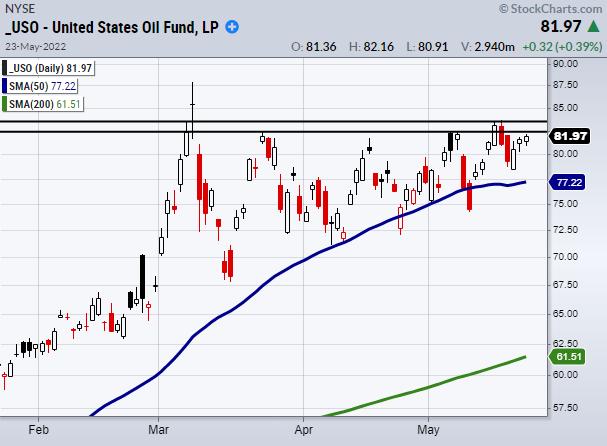
Energy plays have some of the best chart setups right now, from a momentum breakout standpoint. A perfect example of this can be seen in the above chart of the United States Oil Fund (USO).
Currently, USO has been consolidating within an upward trend near its key resistance area, from...
READ MORE
MEMBERS ONLY

Value Knocks Out Growth
by Julius de Kempenaer,
Senior Technical Analyst, StockCharts.com
The RRG below shows the tails for the DJ Growth and -Value indexes against the DJ US index. In January of this year, the Value tail crossed over into the leading quadrant while, at the same time, Growth crossed into the lagging quadrant.
After a strong stint, the tails started...
READ MORE
MEMBERS ONLY

Knowing Historical Tendencies Will Make You A Much More Successful Trader
by Tom Bowley,
Chief Market Strategist, EarningsBeats.com
I began studying stock market behavior back in the 1980s. It started as a result of my practicing CPA days. While auditing clients, I realized that most of my clients had consistent payroll dates that were generally the beginning and middle of the month. That's a lot of...
READ MORE
MEMBERS ONLY
Has Stock Market Selling Become Exhausted?
For the moment, the downward trend remains intact as the market and media embrace more negative news. News of a housing market top, increasing inflation, geopolitical stress and more add a dampener to investor sentiment. However, when everyone becomes bearish and is calling for more decay, this could be a...
READ MORE
MEMBERS ONLY

WHY Standard Deviation is a Poor Measure of Risk

by Greg Morris,
Veteran Technical Analyst, Investor, and Author
I will attempt to show that high sigma is a much more frequent event than modern finance thinks it is. A few examples using the Dow Industrials back to 1885 on a daily basis are shown. Each begins with determining a look-back period to determine the average daily return and...
READ MORE
MEMBERS ONLY
Sector Spotlight: It's Just a Bounce for Now
by Julius de Kempenaer,
Senior Technical Analyst, StockCharts.com
In this edition of StockCharts TV's Sector Spotlight, I talk you through the rotations for asset classes and sectors as they are currently unfolding. At asset class level, the improvement for fixed-income-related assets is worth noticing, as it is pushing stocks (SPY) down and into the lagging quadrant...
READ MORE
MEMBERS ONLY

"Those Who Do Not Learn from History . . .

by Carl Swenlin,
President and Founder, DecisionPoint.com
. . . are doomed to repeat it." The essence of that pithy observation is generally attributed to writer and philosopher George Santayana. I don't think it is usually applied to the stock market, but it should be, and looking at historical charts is the best way to learn from...
READ MORE
MEMBERS ONLY
Is Oil Gearing Up for a Big Move?
The country has been under pressure from rising gas prices for months.Even before the Ukraine war, gas was steadily increasing. While the U.S continues to look for solutions to manage prices, from releasing oil reserves to increasing imports, the oil sector could be looking for another big move...
READ MORE
MEMBERS ONLY

It's Time for a Rally, But that Comes with a Catch

by Martin Pring,
President, Pring Research
The stock market's recent sell-off has made the front pages and top headlines in TV broadcasts, and CNN's famous Fear and Greed Index has fallen to an extreme level of fear. My contrarian bones say it's time for a rally. Is that right? Yes...
READ MORE
MEMBERS ONLY

Base Metals ETF Survives Onslaught and Makes a Turn
by Arthur Hill,
Chief Technical Strategist, TrendInvestorPro.com
The DB Base Metals ETF (DBB) is reversing its downswing after becoming oversold within an uptrend. This analysis will cover the long-term trend using the chart and Trend Composite, the oversold conditions using the Momentum Composite and the short-term breakout over the last few days.
DBB fell some 18% from...
READ MORE
MEMBERS ONLY
Week Ahead: Stable Start to The Markets Expected While NIFTY Holds Key Supports; Focus on These Sectors Will Be Rewarding
by Milan Vaishnav,
Founder and Technical Analyst, EquityResearch.asia and ChartWizard.ae
The five sessions over the previous week were gripped with insane volatility; four out of five days saw the NIFTY gapping either on the up or on the downside. The wild moves are not reflected on the weekly charts, but the close examination of the daily chart made this behavior...
READ MORE
MEMBERS ONLY
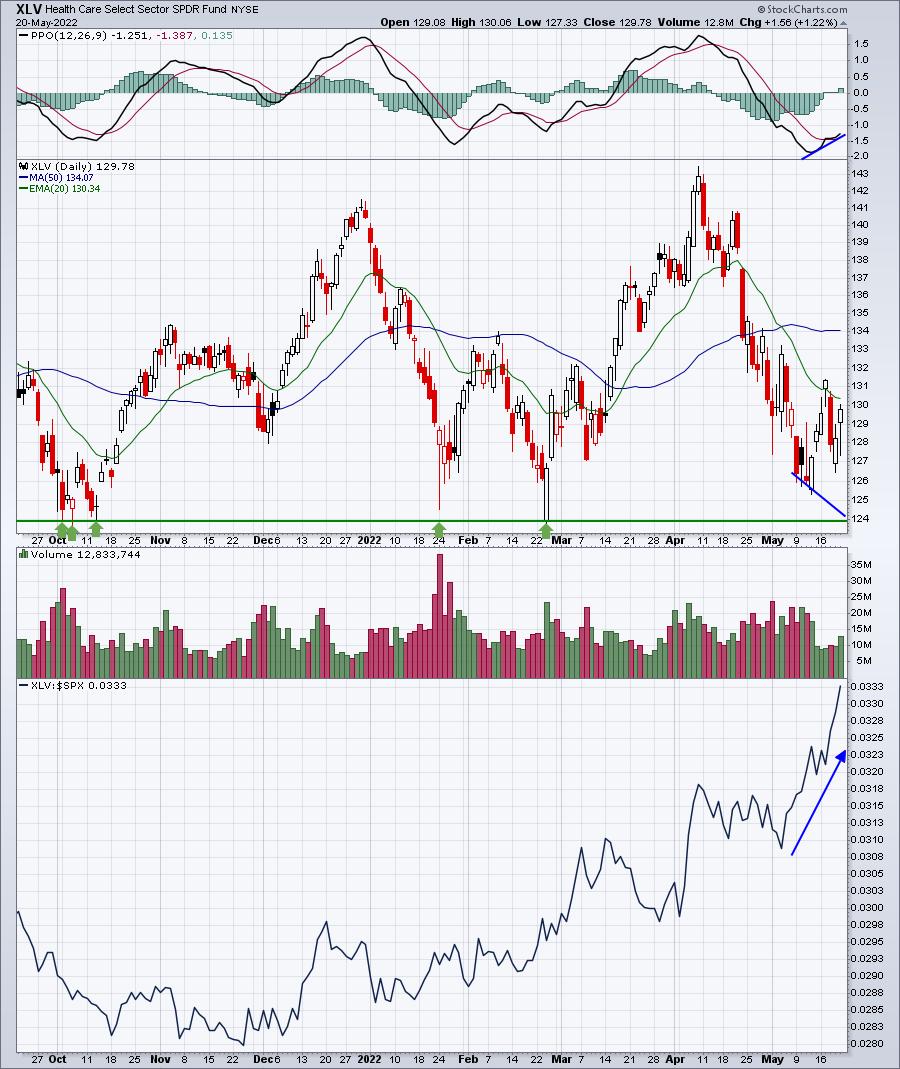
The Brutal Summer Ahead Will Favor Health Care
by Tom Bowley,
Chief Market Strategist, EarningsBeats.com
I've been warning all year about this cyclical bear market and, unfortunately, it's not over just yet. Sentiment is turning more and more bearish, which is good, but we haven't seen the peak to mark the market bottom. That will take time and patience....
READ MORE
MEMBERS ONLY
What Bear Market? These Stocks Have Great Looking Charts -- With Very Sound Reasons
by Mary Ellen McGonagle,
President, MEM Investment Research
The markets have fallen for seven consecutive weeks, with the S&P 500 having its worst period in over 20 years (which was back when investors were grappling with the dot-com bubble burst). Today, this Index briefly fell into bear market territory, which is marked by a 20% decline...
READ MORE
MEMBERS ONLY
How to Smile During a Bear Market
by David Keller,
President and Chief Strategist, Sierra Alpha Research
It is super difficult to disconnect from the emotional impact of investing. I've often spoken of the dangers of endowment bias, where we tend to hold on to a losing position despite very clear evidence that we should cut our losses.As legendary technical analyst Ralph Acampora told...
READ MORE
MEMBERS ONLY

The US is Dragging Stock Markets Around the World Lower
by Julius de Kempenaer,
Senior Technical Analyst, StockCharts.com
For a bird's eye view of developments in international stock markets, I use a Relative Rotation Graph that shows the rotations for a group of international stock indexes.
The RRG below shows the weekly rotation for this group. You can find this under the pre-defined groups in the...
READ MORE
MEMBERS ONLY
S&P 500 Flirts with Bear Market Status
by Mary Ellen McGonagle,
President, MEM Investment Research
On this episode of StockCharts TV'sThe MEM Edge, Mary Ellen reviews the status of the markets, highlighting areas and stocks that have positive charts and why. She also discusses the sector that was hardest hit this week, with further downside ahead.
This video was originally broadcast on May...
READ MORE
MEMBERS ONLY
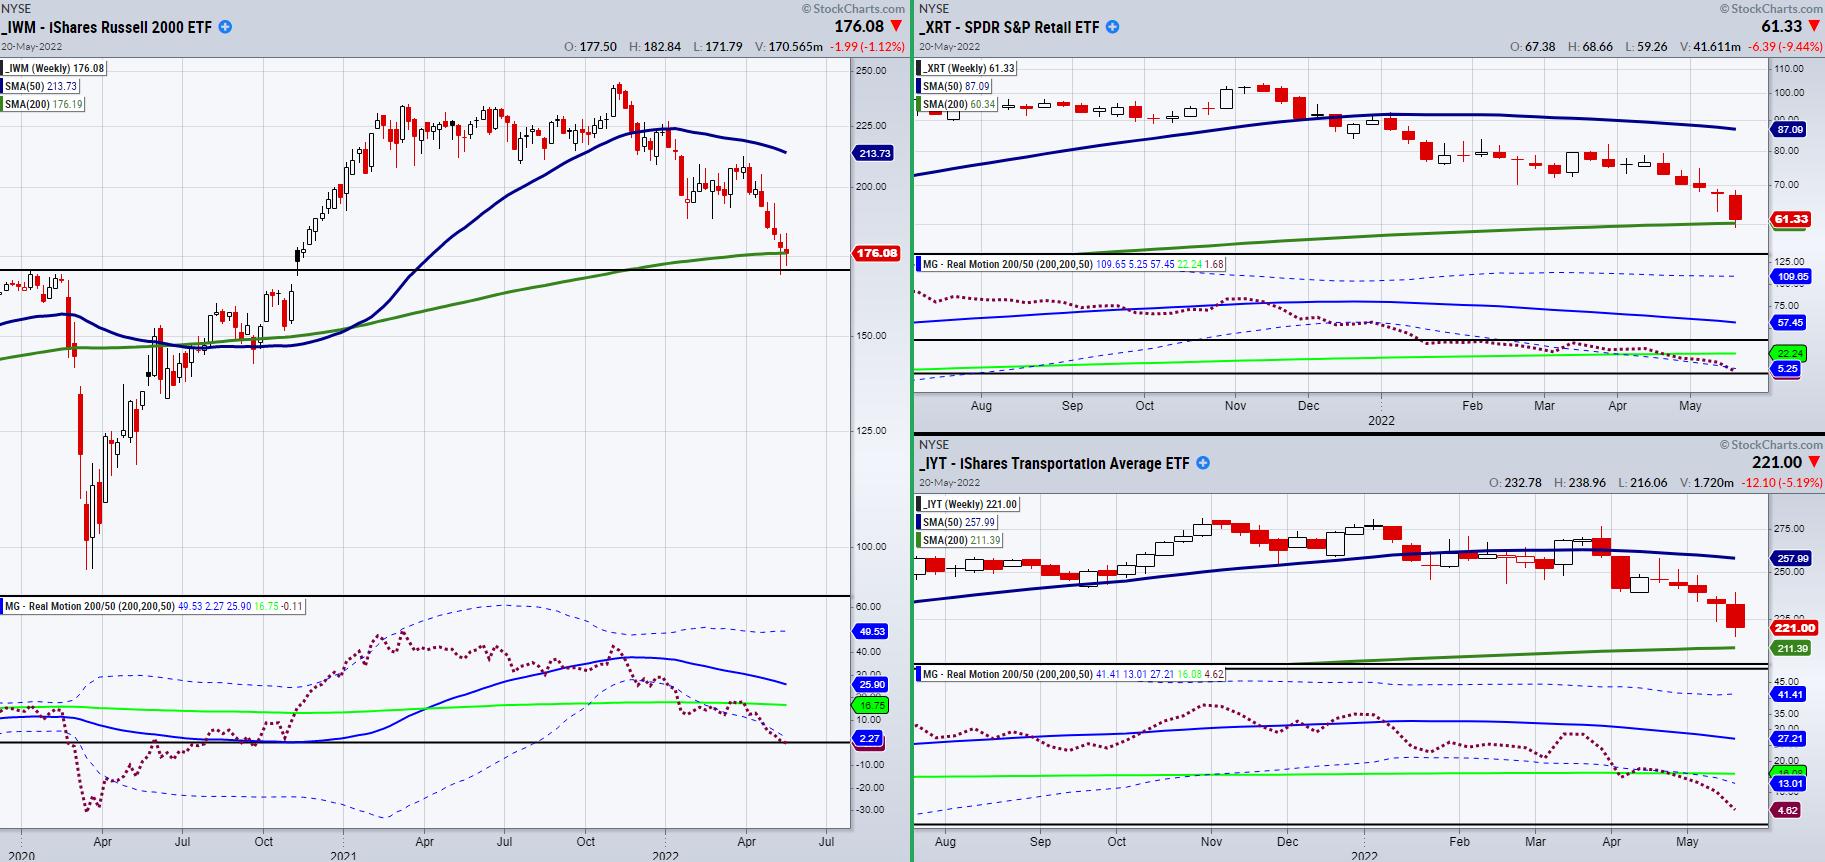
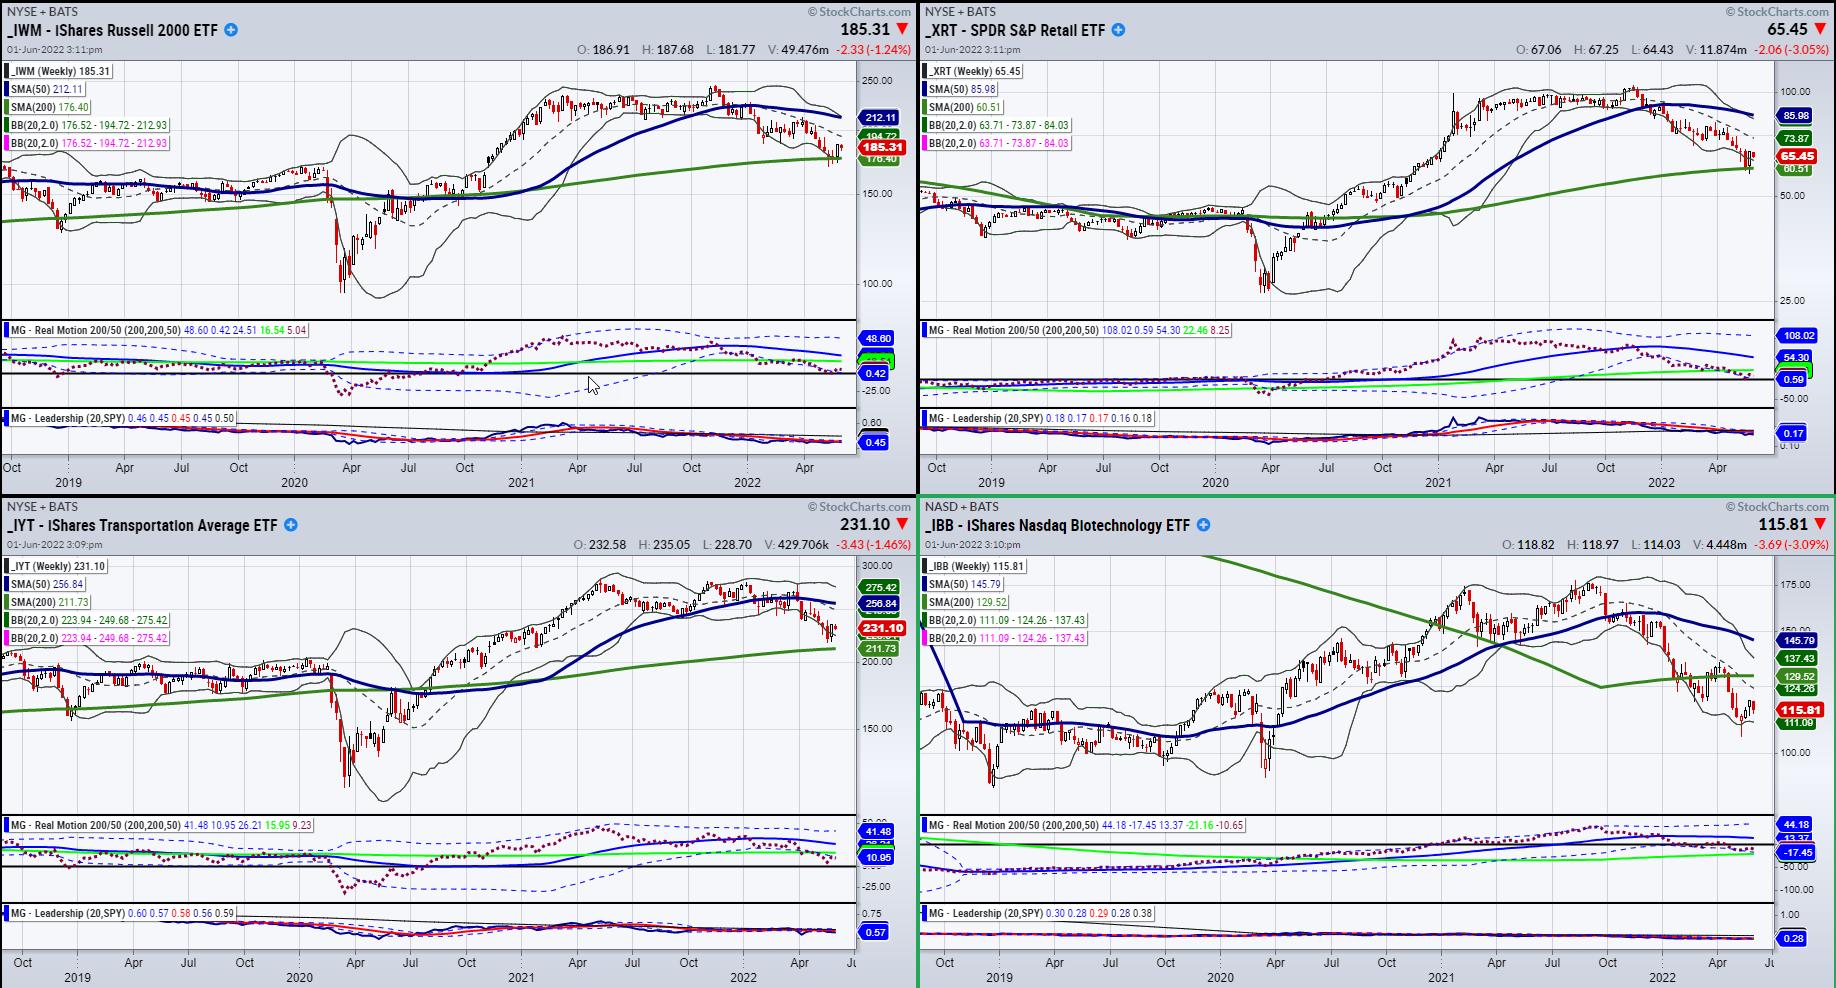
Watch the 200-Week Moving Average on These 3 Symbols
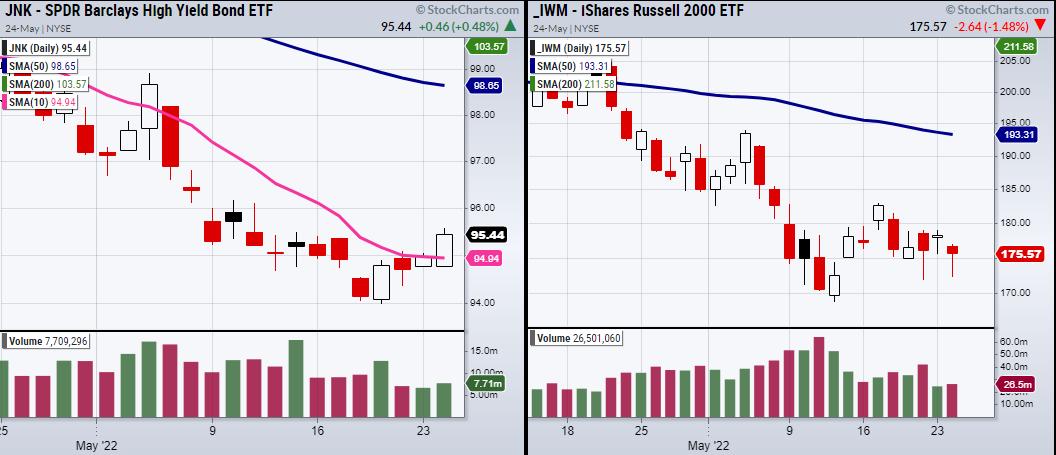
The small cap-index Russell 2000 (IWM) is hanging onto support from the 200-week moving average at $176.19. Last week, it dipped below the moving average with a low of $168.90. With that said, it looks as though IWM is trying to find temporary support in this price area...
READ MORE
MEMBERS ONLY
What Does Sideways Chop Mean for Market Direction?
by TG Watkins,
Director of Stocks, Simpler Trading
In this week's edition of Moxie Indicator Minutes, TG starts out with a deep dive of the SPY's price action. What does yesterday's sideways chop mean for the direction of the market? TG then talks about the recent 20% overall correction we have seen....
READ MORE
MEMBERS ONLY

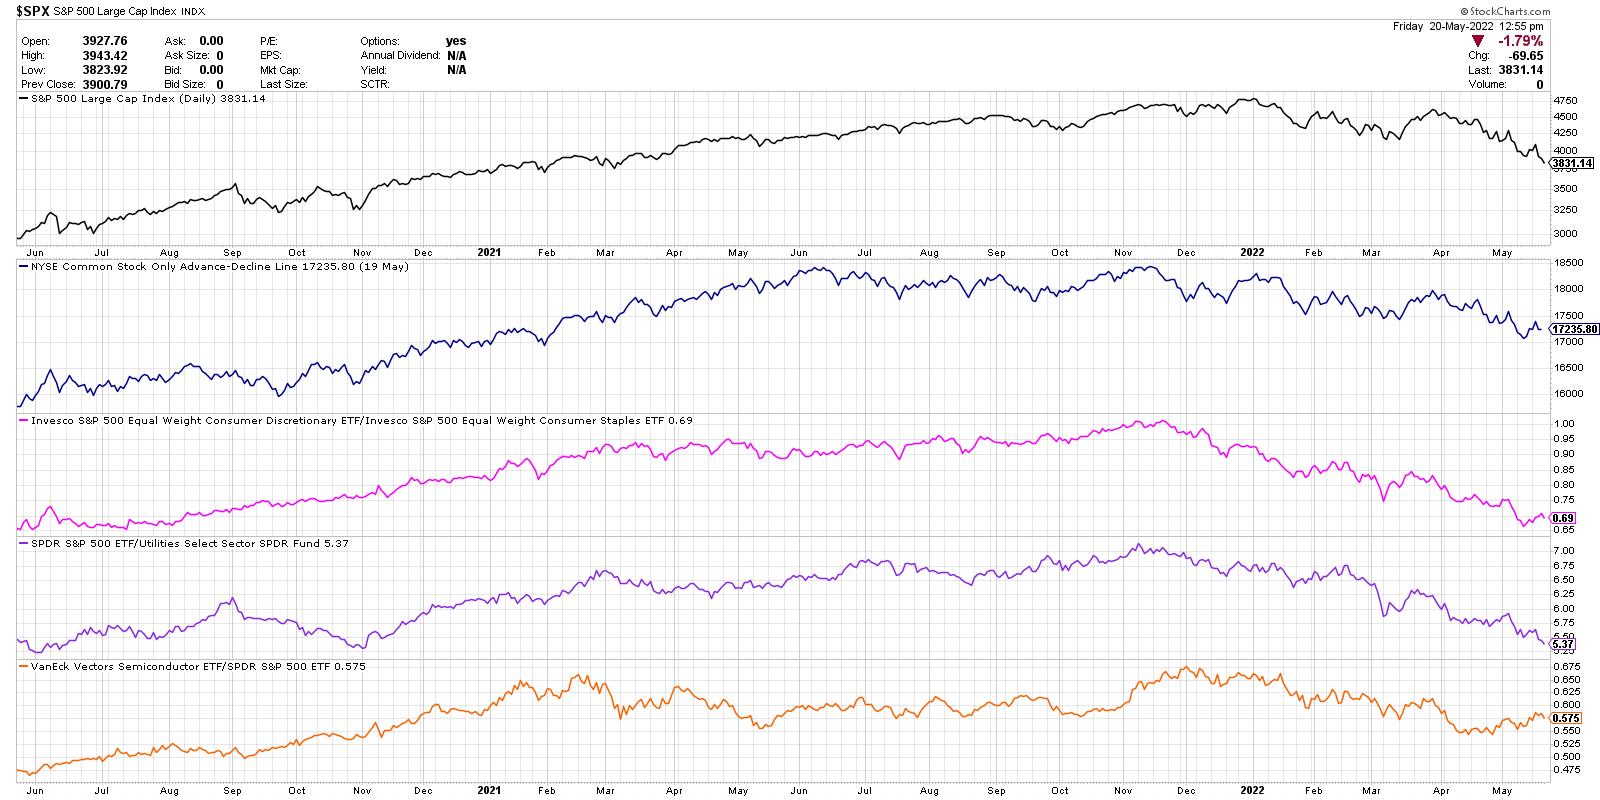
STOCKS REMAIN UNDER PRESSURE -- BREADTH FIGURES CONFIRM BEARISH OUTLOOK
by John Murphy,
Chief Technical Analyst, StockCharts.com
S&P 500 REMAINS IN DOWNTREND...Stock prices continue to weaken with no sign of a bottom. The daily bars in Chart 1 show the S&P 500 having fallen to the lowest level in more than a year and nearing a 20% loss which signals a bear...
READ MORE
MEMBERS ONLY
GNG TV: Just Say "NoGo" to Bear Market Rallies
by Alex Cole,
Co-founder, GoNoGo Charts®
by Tyler Wood,
Co-founder, GoNoGo Charts®
Defense is still the play on this week's edition of the GoNoGo Charts show. Wednesday's heavy selloff has tempted many analysts to go "bottom fishing" for oversold opportunities. But, instead of forecasting a market bottom, investors can use the weight of the evidence in...
READ MORE
MEMBERS ONLY
How I Use RSI to Pinpoint Longs & Shorts
by Joe Rabil,
President, Rabil Stock Research
On this week's edition of Stock Talk with Joe Rabil, Joe Rabil discusses how he uses the RSI indicator. He has 2 different forms of RSI, which he overlays onto the same scale. He shows how it can be helpful to pinpoint areas for longs and shorts and...
READ MORE
MEMBERS ONLY

"Believable" Misinformation Is a Danger to Long-Term Retirement Goals
by Greg Morris,
Veteran Technical Analyst, Investor, and Author
Many investment "truths" seem to go unchallenged but are in fact, very clearly just myths. Buy and hold investing is a good long-term strategy, economists are good at predicting the markets, diversification will protect you from losses, compounding is the eighth wonder of the world, missing the best...
READ MORE
MEMBERS ONLY
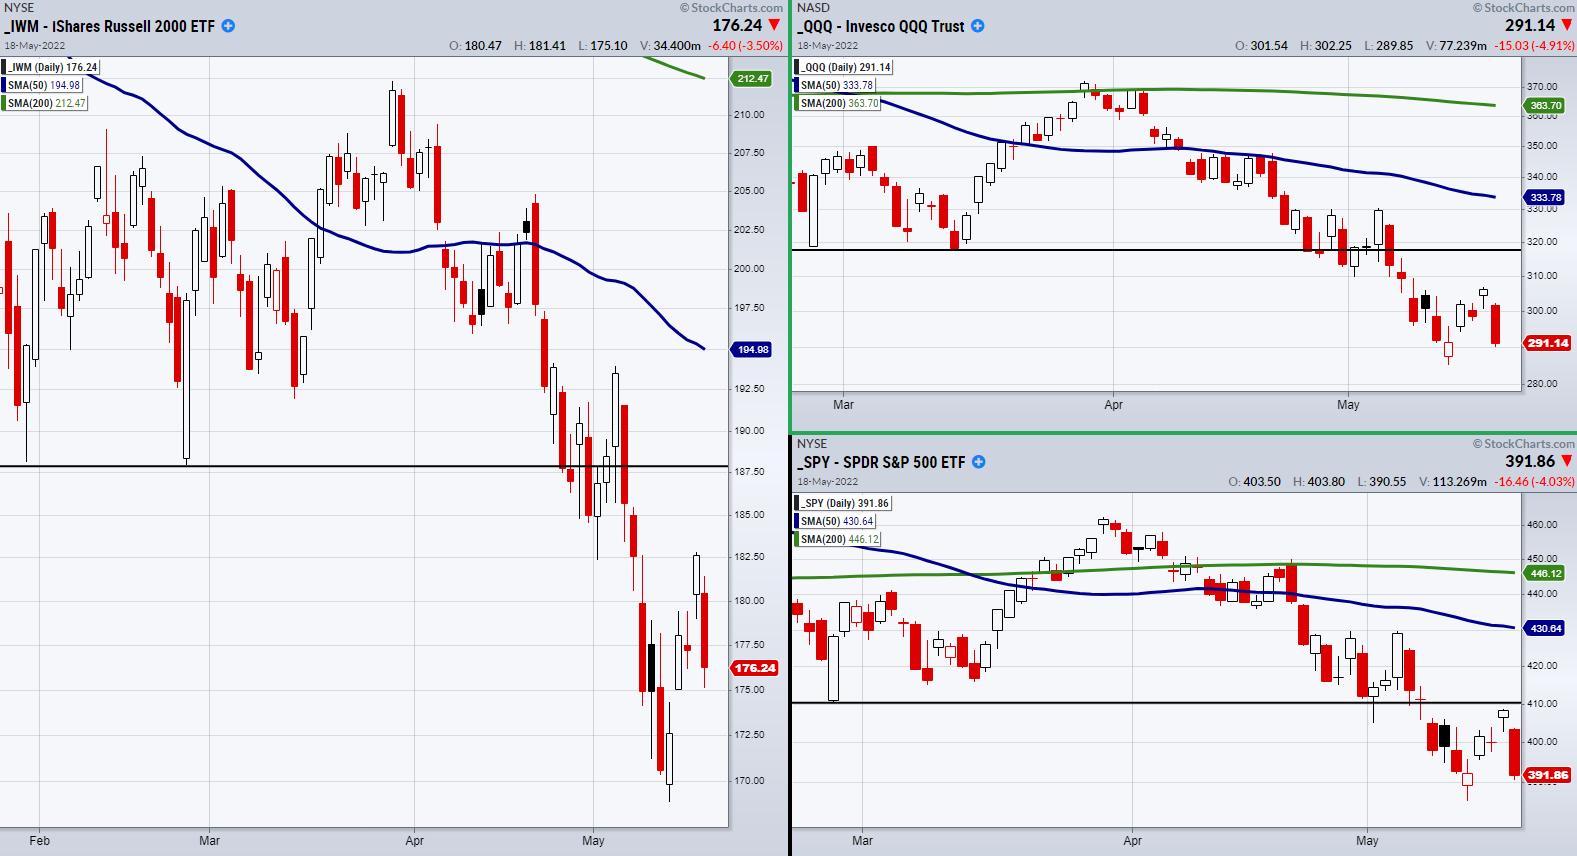
How Junk Bonds Saved Us from Loading Up on Equities
The Rally failed to carry the major indices past key resistance levels. This can be seen in the above chart of the S&P 500 (SPY), Nasdaq 100 (QQQ) and the Russell 2000 (IWM). Lines are drawn for previous support levels that, once broken turned into important resistance points...
READ MORE
MEMBERS ONLY
Performance-Based Investing
by Dave Landry,
Founder, Sentive Trading, LLC
On this week's edition of Trading Simplified, Dave revisits his discussion on how simplified technical analysis boils down to performance: you buy markets when they are performing well and sell them when they are underperforming. He then explains why even longer-term investors must factor performance into their investments....
READ MORE
