MEMBERS ONLY
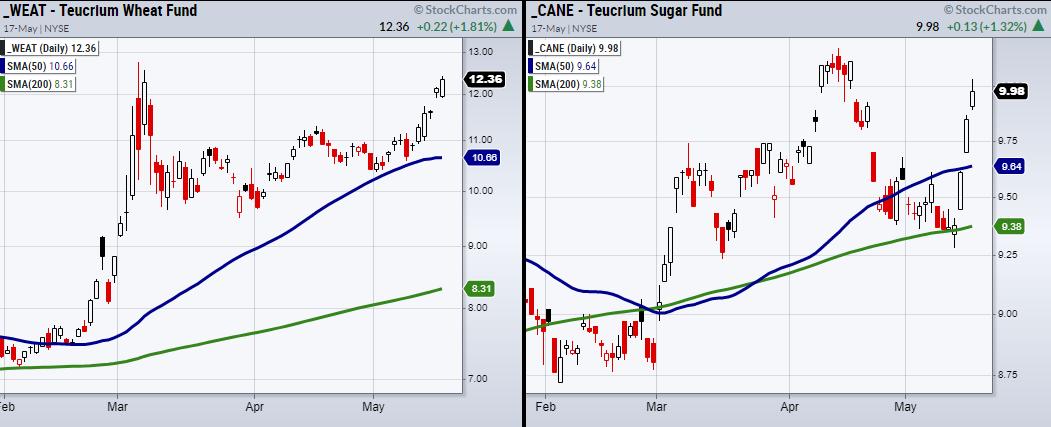
Fertilizer Companies Look to Follow the Recent Jump in Soft Commodities
So far, this week has been huge for wheat (WEAT) and sugar (CANE), with both gapping up on Monday and continuing higher. Soft commodities have been on the move, as supply chain issues involving China's COVID cases spiking and Ukraine cutting its wheat output have rapidly increased prices....
READ MORE
MEMBERS ONLY

Sector Spotlight: Bottom-Fishing with RRG

by Julius de Kempenaer,
Senior Technical Analyst, StockCharts.com
In this edition of StockCharts TV's Sector Spotlight, I very briefly touch on the rotation for asset classes, then spends a bit more time on sectors. I highlight how defensive sectors are still in the driving seat, but also alerting that one sector that could come up as...
READ MORE
MEMBERS ONLY

DP TV: Chart Patterns for Bull and Bear Markets

by Erin Swenlin,
Vice President, DecisionPoint.com
In this special edition of DecisionPoint, Erin goes through the primary chart patterns and how they can be used to determine upside and downside targets. She discusses how the market in general can affect the resolution of chart patterns. Regardless of the type of market environment, chart patterns give you...
READ MORE
MEMBERS ONLY
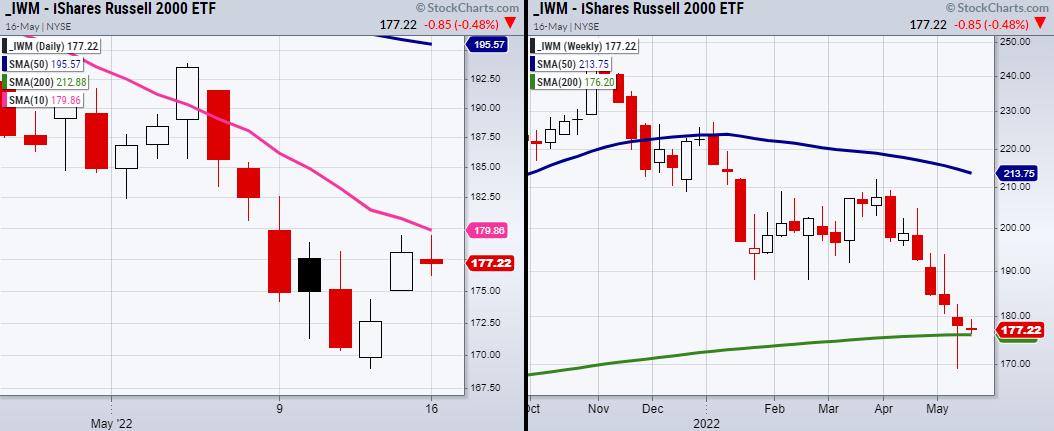
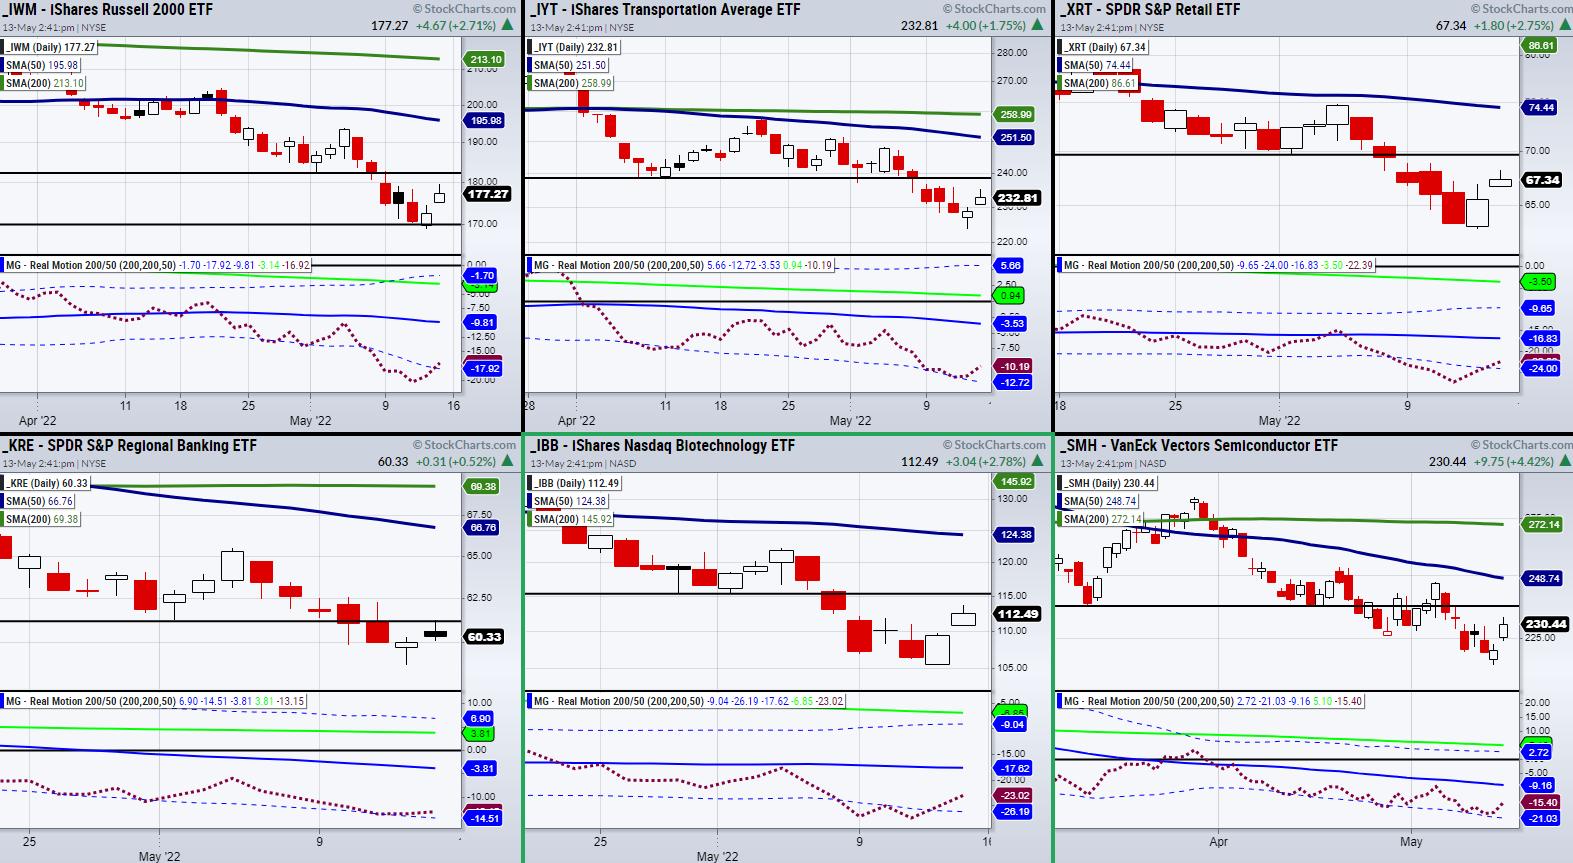
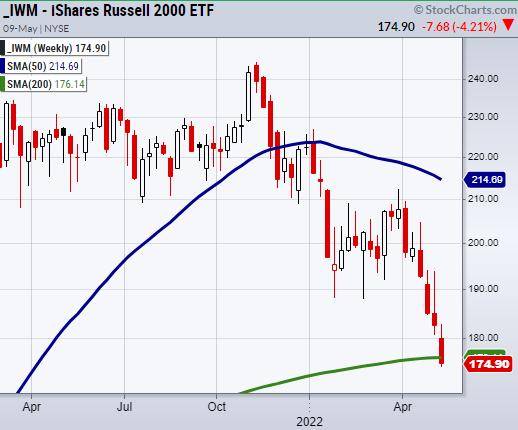
The Small-Cap Index Needs to Clear The 10-DMA and Hold Its 200-WMA
On Monday, the small-cap index Russell 2000 (IWM) tested its past Friday high at $179.41, but ultimately could not hold. Just above this price level stands the 10-day moving average at $179.86; this will be the next pivotal area for IWM to clear if we are going to...
READ MORE
MEMBERS ONLY

Commodities on the Verge of an Upside Breakout, But Participation Will Likely Narrow

by Martin Pring,
President, Pring Research
Chart 1 shows that the Invesco DB Commodity Tracking Fund could be on the verge of breaking out from a 3-month consolidation pattern. It also points out that the number of commodities participating in the rally has been narrowing of late. That's because the indicator monitoring a universe...
READ MORE
MEMBERS ONLY

Is $ONE the Better Benchmark to Use With Relative Rotation Graphs?
by Julius de Kempenaer,
Senior Technical Analyst, StockCharts.com
Following my article "Which Stocks Inside The Dow Are Worth Holding?", I received a few questions on using $ONE as the benchmark for a Relative Rotation Graph and whether it would be the better benchmark to use. The honest answer to that question?
It depends.
Let Me Explain...
READ MORE
MEMBERS ONLY
This is NOT a Long-Term Bear Market - Improving Signs Are Underway

by Tom Bowley,
Chief Market Strategist, EarningsBeats.com
Everyone is entitled to their own opinion and mine is that the issues we've experienced in the first half of 2022 will be mitigated in the second half. Until 2022, many of you I'm sure viewed me as a perma-bull. I've always said that...
READ MORE
MEMBERS ONLY
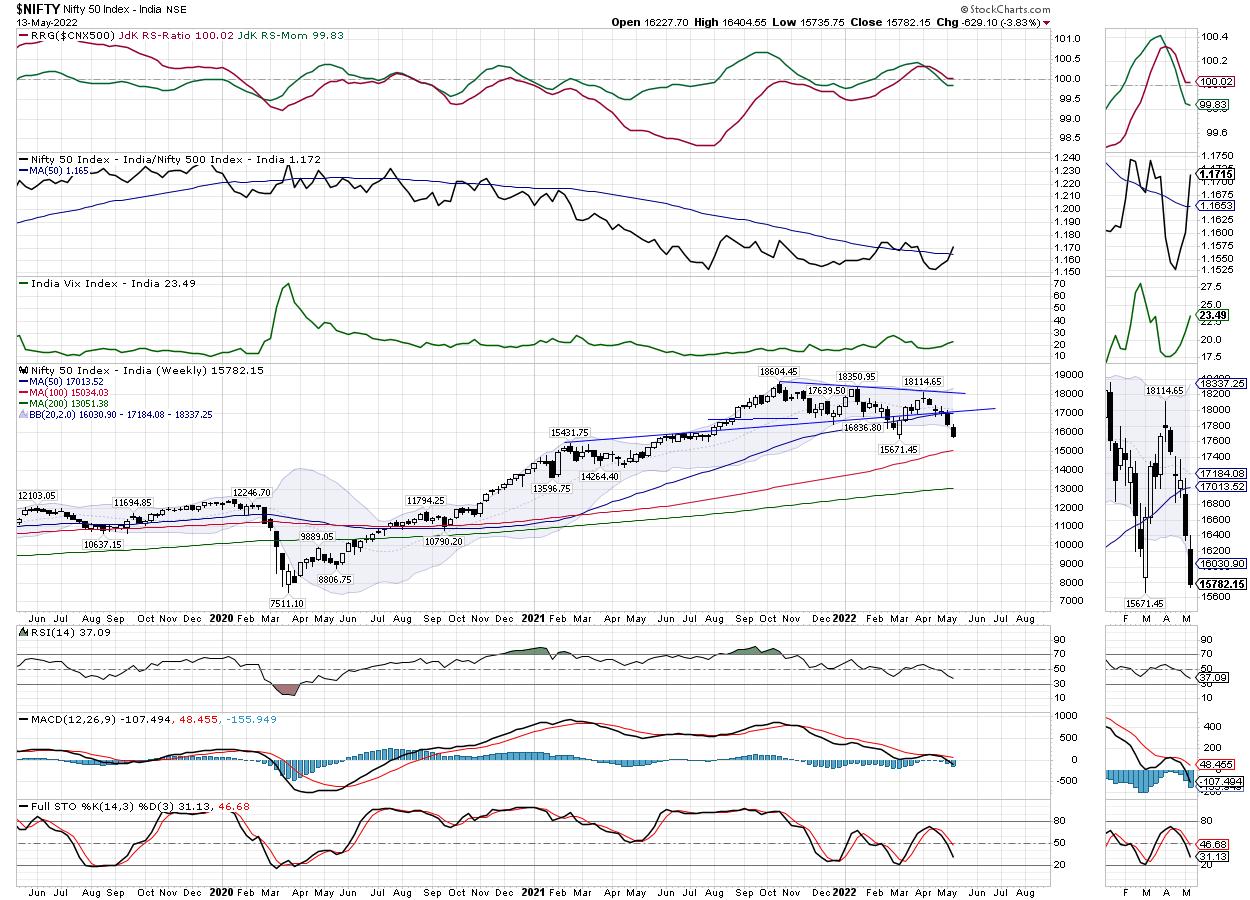
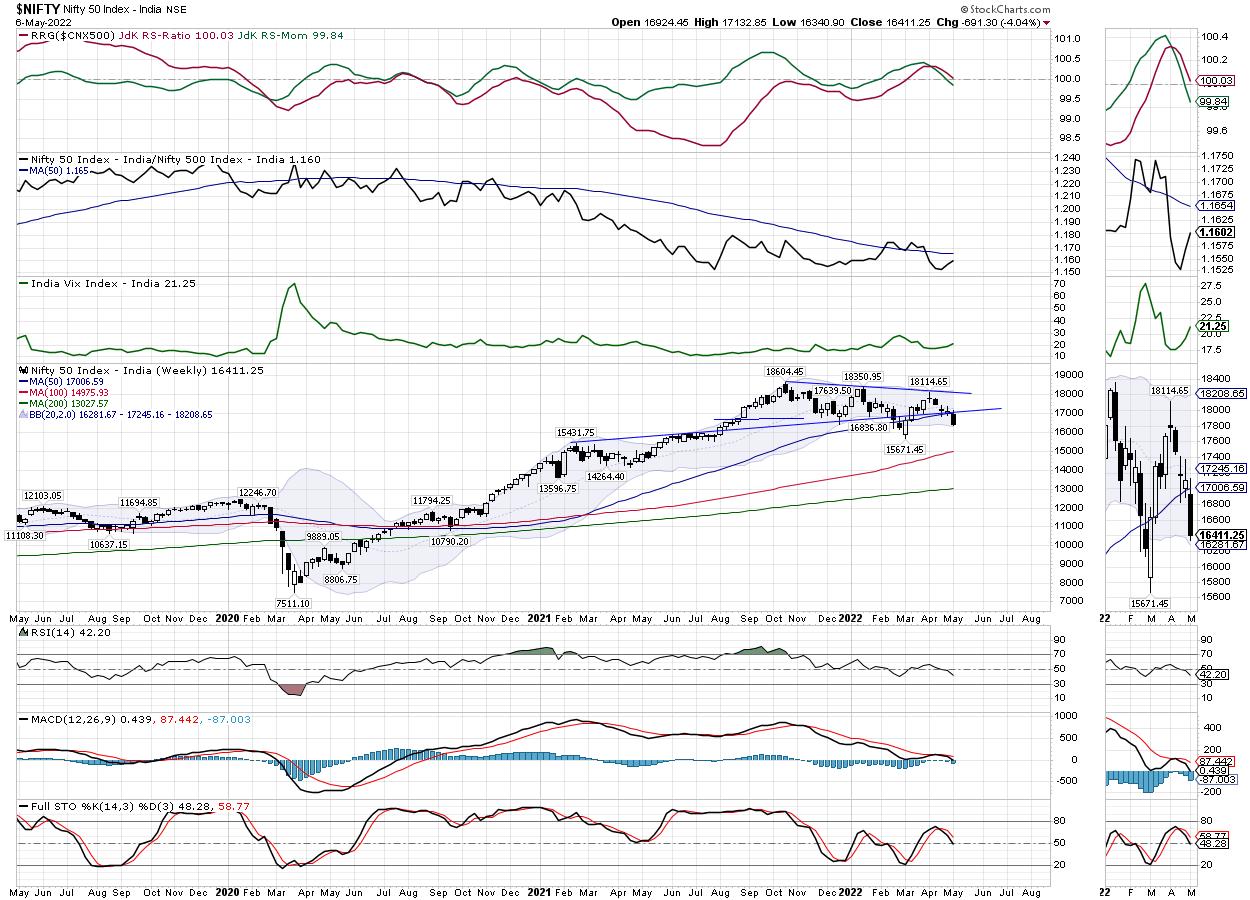
Week Ahead: NIFTY Approaches A Pattern Support; RRG Chart Shows Bunch Of Sectors That May Relatively Outperform

by Milan Vaishnav,
Founder and Technical Analyst, EquityResearch.asia and ChartWizard.ae
The entire week that went by kept the markets under a strong bear grip; all five trading sessions ended on a negative note. The markets continued to witness gaps on the downside; saw some intermittent short-covering but ultimately traded with a negative undertone. The trading range remained more or less...
READ MORE
MEMBERS ONLY
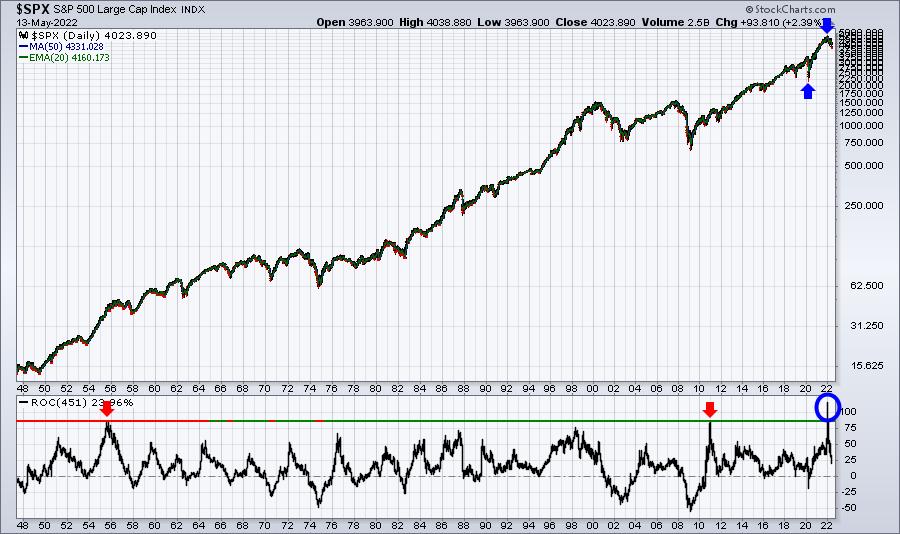
This Chart Says More Downside for S&P 500

by David Keller,
President and Chief Strategist, Sierra Alpha Research
We are now in the seasonally weakest half of the year, which is why "sell in May and go away" comments have made the annual rounds. While the Sell in May approach has not been particularly successfulin recent years, it is indeed based on the general tendency of...
READ MORE
MEMBERS ONLY
Great Rally But Lacked Conviction
by Erin Swenlin,
Vice President, DecisionPoint.com

by Carl Swenlin,
President and Founder, DecisionPoint.com
The following is a complimentary copy of Friday's subscriber-only DP Weekly Wrap. Want this content in your email box every market day? Subscribe to the DP Alert without delay!
It was a volatile trading week, with investors breathing a sigh of relief on today's positive close....
READ MORE
MEMBERS ONLY

Bottom Fishing Sparks Friday Rally

by Mary Ellen McGonagle,
President, MEM Investment Research
On this episode of StockCharts TV'sThe MEM Edge, Mary Ellen reviews today's sharp rally and its impact on the position of the broader markets. She also shares where the sharpest bounces took place and what that means for select groups.
This video was originally broadcast on...
READ MORE
MEMBERS ONLY
Is There Any Hope for the Beaten Down Stocks?

by John Hopkins,
President and Co-founder, EarningsBeats.com
The carnage in the market, which has resulted from the 30% decline in the NASDAQ since its November 22, 2021 high, is going to be remembered for a long time, especially by those who painfully held on to stocks that, in some cases, fell 50% or more from their all-time...
READ MORE
MEMBERS ONLY
3 Key Sectors to Watch with Hidden Momentum
Mish's Economic Modern Family looks to have found temporary support, as each of the members has closed over the prior day's high, providing relief from the downward trend. However, will this last, or is the rally a potential trap before the market breaks lower?
If we...
READ MORE
MEMBERS ONLY

Will We See a Reversal?

by TG Watkins,
Director of Stocks, Simpler Trading
In this week's edition of Moxie Indicator Minutes, TG talks about the air pockets he has been seeing, including one on the SPY and IWM. He then talks about his next target and why he is waiting for the SPY to hit 380.
This video was originally broadcast...
READ MORE
MEMBERS ONLY

A Key Factor in the Trading Puzzle

by Arthur Hill,
Chief Technical Strategist, TrendInvestorPro.com
The bigger trend is one of the most important factors to consider when trading stocks or ETFs. We can use trend signals as part of a trend-following strategy or to dictate our trading bias. I look for bullish setups and pullback opportunities when the trend is up. When the trend...
READ MORE
MEMBERS ONLY

GNG TV: Equity Selloff Continues, Commodities Hold a "Go" Trend

by Alex Cole,
Co-founder, GoNoGo Charts®

by Tyler Wood,
Co-founder, GoNoGo Charts®
Alex and Tyler are back together talking markets from midtown Manhattan on this week's edition of the GoNoGo Charts show. The heavy selling pressure this week has kept US Treasury bonds and major equity indices in strong "NoGo" trends. While many analysts are searching for signs...
READ MORE
MEMBERS ONLY

Is ADX Leading or Lagging? Yes!

by Joe Rabil,
President, Rabil Stock Research
On this week's edition of Stock Talk with Joe Rabil, Joe Rabil clears up some of the confusion surrounding the ADX indicator, explaining how it can give us important information in advance of a price move. He also explains the lagging nature of ADX and when it is...
READ MORE
MEMBERS ONLY

USING FIBONACCI RETRACEMENT LINES FOR POTENTIAL DOWNSIDE TARGETS

by John Murphy,
Chief Technical Analyst, StockCharts.com
INFLATION REMAINS THE BIGGEST THREAT TO MARKETS... It was reported this morning that April's Producer Price Index for the past year came in at 11%. That followed yesterday's report that the Consumer Price Index was 8.3%. Both reports confirm that inflation remains dangerously high with...
READ MORE
MEMBERS ONLY
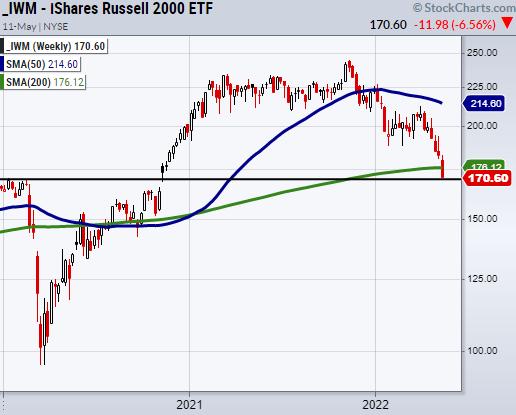
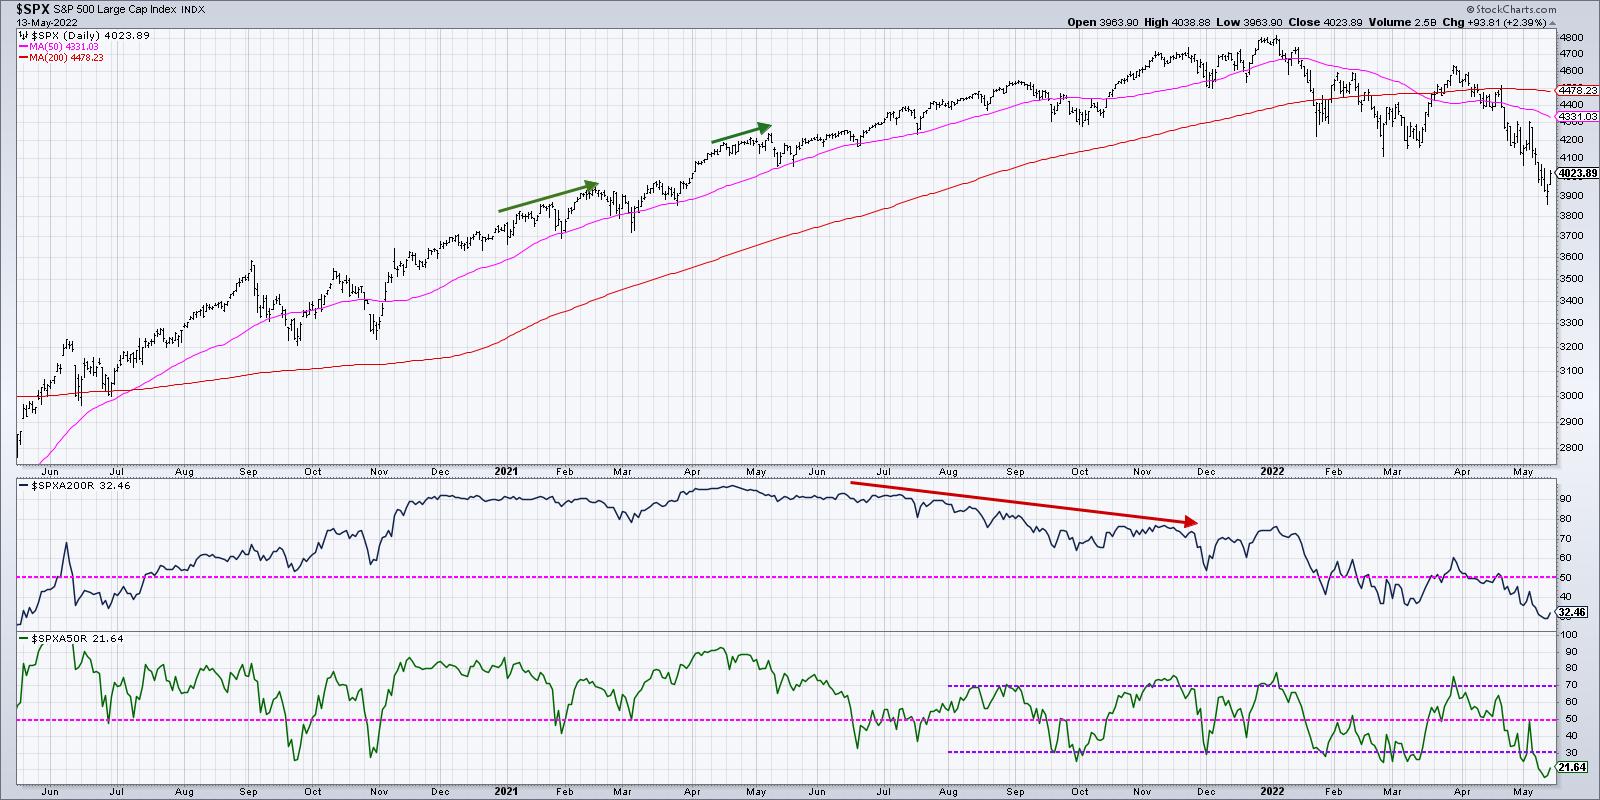
How Much Further Can the Stock Market Break Down?
Taking a step back and looking at important reference points and percentages helps us grasp where the stock market is and where it's potentially going.
Focusing on the small-cap index, the Russell 2000 (IWM) has broken its 200-Week moving average at $176.13. The last time IWM was...
READ MORE
MEMBERS ONLY

Apply Landry Light to Identify Trends

by Dave Landry,
Founder, Sentive Trading, LLC
On this week's edition of Trading Simplified, Dave presents his first of 100 trades, then covers how he sees indicators as illustrators. "Indicators don't 'indicate' and used sparingly, they can help you truly see 'what is.'" He then dives into...
READ MORE
MEMBERS ONLY

Sentiment is Bearish, But Is It Bearish Enough?
by Erin Swenlin,
Vice President, DecisionPoint.com
This is an excerpt from today's subscriber-only DecisionPoint Alert report...
We decided to cover some sentiment charts on the DecisionPoint Show yesterday. It is an interesting picture. Clearly sentiment is bearish. The question is whether it is bearish enough to start expecting a bear market bottom.
Let'...
READ MORE
MEMBERS ONLY
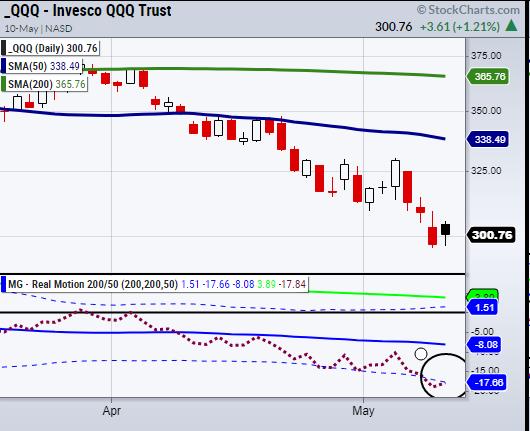
Why We are Focusing on Commodities Over Equities
On Tuesday, the Nasdaq 100 (QQQ) outperformed the other indexes, ending the day +1.20%, while other major indices closed roughly flat on the day.
From the momentum side, our Real Motion (RM) indicator is flirting with the lower band. This can be seen circled in the above chart. If...
READ MORE
MEMBERS ONLY

Bitcoin Bubble Finally Bursts
by Martin Pring,
President, Pring Research
I have written two articles about Bitcoin in recent months. The first,last December, concluded that "there are definitely some cracks appearing (in the technical structure), but a shrinking consensus of evidence continues to point to an uptrend." Thesecond, entitled "Has the Bitcoin Bubble Burst", noted...
READ MORE
MEMBERS ONLY
Sector Spotlight: 50% Of Market Cap is Lagging SPY
by Julius de Kempenaer,
Senior Technical Analyst, StockCharts.com
In this edition of StockCharts TV's Sector Spotlight, after looking at seasonality and long-term monthly charts in the last two episodes, I dive deep into the current sector rotation as it is playing out in the S&P 500 at the moment. The most important takeaway is...
READ MORE
MEMBERS ONLY
DP TV: Downside Targets for FAANG+ and Indexes
by Erin Swenlin,
Vice President, DecisionPoint.com
by Carl Swenlin,
President and Founder, DecisionPoint.com
On this episode of DecisionPoint, Carl walks viewers through the FAANG+ mega-cap stocks. Using earnings per share and P/E, Carl shows how to find "fair value" support. Erin discusses oversold indicators now versus 2020 bear market low. She then analyzes technical support levels on the major indexes...
READ MORE
MEMBERS ONLY
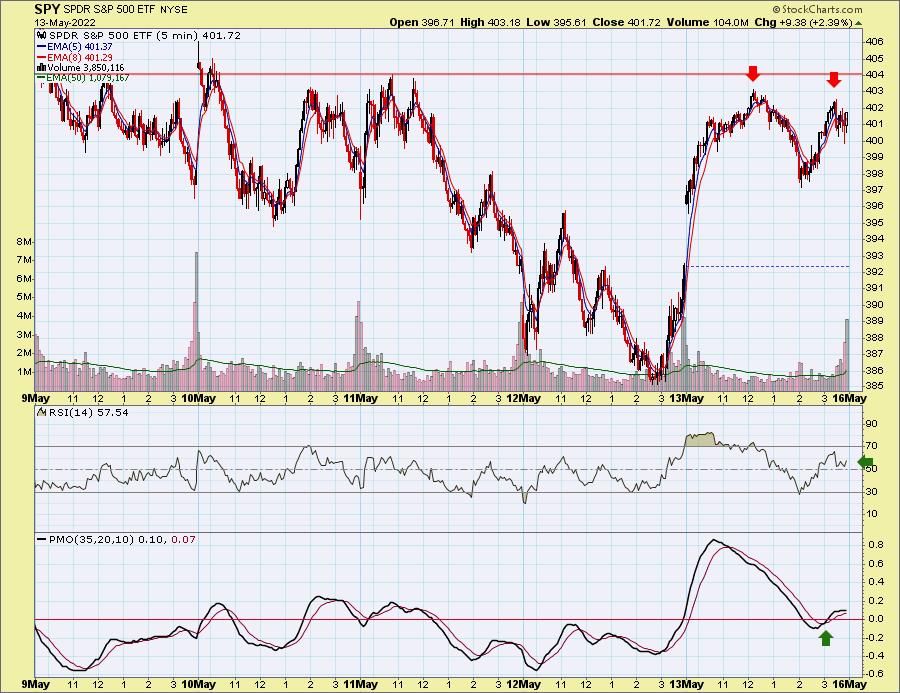
How to Handle Monday's Major Liquidity Crunch
All the major indices tumbled on Monday, leading to a large liquidation. Even safety plays, such as precious metals like gold (GLD) and silver (SLV), were down on the day. Many are wondering what to do, as most financial planners tell their clients to hold onto positions since the market...
READ MORE
MEMBERS ONLY

Bear Markets and Drawdowns - part 2

by Greg Morris,
Veteran Technical Analyst, Investor, and Author
This is a continuation of the previous article. The Dow Jones Industrial Average, also referred to as The Dow by the financial media, is a price-weighted measure of 30 U.S. blue-chip companies. The Dow covers all industries with the exception of transportation and utilities, which are covered by the...
READ MORE
MEMBERS ONLY
It's Not You, It's Me
by Tom Bowley,
Chief Market Strategist, EarningsBeats.com
If only growth stocks could talk.
You've probably heard of the "it's not you, it's me" breakup excuse. Maybe you've had to endure it. Well, in the land of stock market trading, I believe it's a quite valid...
READ MORE
MEMBERS ONLY
Week Ahead: NIFTY Violates Support, But Adds Massive Shorts to System; RRG Chart Shows These Sectors Staying Resilient
by Milan Vaishnav,
Founder and Technical Analyst, EquityResearch.asia and ChartWizard.ae
In a week that was truncated due to a trading holiday on account of Eid, the Indian equity markets traded weakly for the most part, ending in the red for three out of four sessions. Among these, the last trading day on Friday remained particularly weak. The markets also witnessed...
READ MORE
MEMBERS ONLY
There's 1 Missing Ingredient for a Market Bottom, and It's The Scariest One of All
by Tom Bowley,
Chief Market Strategist, EarningsBeats.com
As we closed out 2021, I began discussing sentiment and its need for a "reset." We had moved higher for the better part of two years, and the U.S. stock market had picked up a lot of new "post-pandemic" investors and traders. Unfortunately for this...
READ MORE
MEMBERS ONLY
Are the Markets Poised to Trade Much Lower? Keep Your Eye on This One Chart
by Mary Ellen McGonagle,
President, MEM Investment Research
It's been an extremely tough period for the markets over the past 2 weeks, with oversold rallies giving way to major selling. This uptick in volatility highlights investors concerns as we head into a period of rising interest rates amid what many consider to be an economic slowdown....
READ MORE
MEMBERS ONLY
Fed Relief Rally Fizzles
by Mary Ellen McGonagle,
President, MEM Investment Research
On this episode of StockCharts TV'sThe MEM Edge, Mary Ellen reviews where the markets stand following last week's volatile price action. She also shares areas that are bucking the downtrend and whether they're poised to trade higher.
This video was originally broadcast on May...
READ MORE
MEMBERS ONLY

The Most Important Chart of the Day
by David Keller,
President and Chief Strategist, Sierra Alpha Research
Some of my most painful experiences as an investor have come when I have been undisciplined. I would get away from my daily and weekly routines, act rashly when I noticed a compelling chart, and usually end up regretting that decision in a big way. I learned that, by going...
READ MORE
MEMBERS ONLY
The Stock Market May be on the Edge of a Cliff, But This Chart Says It May Not Fall Off
by Martin Pring,
President, Pring Research
Chart 1 reflects the fact that some market averages are on the edge of a cliff, in the form of major support trendlines marking the lower edges of potential top formations. Another, such as the Russell 2000, has already completed a top and is edging below a subsequent trading range....
READ MORE
MEMBERS ONLY
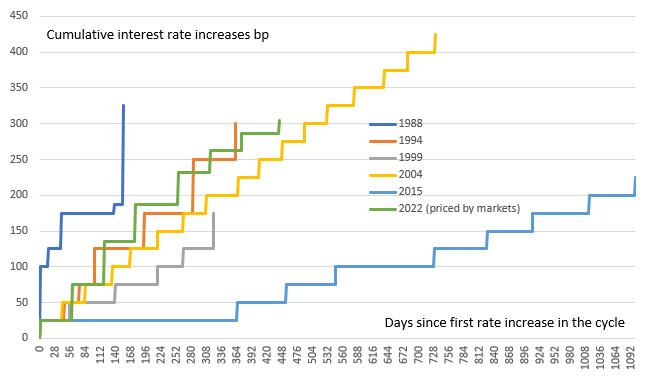
Should the Fed Entertain .75% Interest Rate Hikes Going Forward?
Inflation is a spotlight topic in the media, with more reports and predictions surfacing every day. Since the Fed has been sorely wrong on its inflation predictions, the country is closely monitoring interest rate hikes. As prices increase and potentially look to move higher, people are feeling the pain.
While...
READ MORE
MEMBERS ONLY
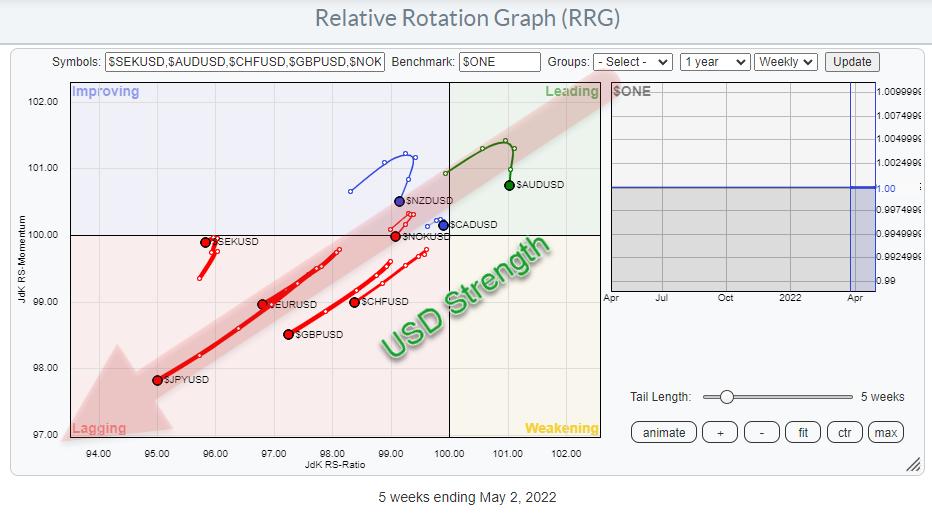
USD Strength Continues with EUR/USD Arriving at Critical Junction
by Julius de Kempenaer,
Senior Technical Analyst, StockCharts.com
The Relative Rotation Graph that shows the rotation for currencies against the USD as the base is sending us a very clear picture!
USD Strength
The graph holds the G10 currencies. As we are plotting against the USD base, it means that there are nine tails on the canvas and...
READ MORE
MEMBERS ONLY
Is the Market Meltdown Only the Beginning?
by TG Watkins,
Director of Stocks, Simpler Trading
In this week's edition of Moxie Indicator Minutes, TG outlines the market action post-Fed meeting. He does this by deep-diving into the SPY's price action and comparing it to previous market conditions. Then, he will explain why this may only be the beginning to bear market...
READ MORE
MEMBERS ONLY
GNG TV: Volatility Ensures Keeping Up Defenses!
by Alex Cole,
Co-founder, GoNoGo Charts®
by Tyler Wood,
Co-founder, GoNoGo Charts®
On this week's edition of the GoNoGo Charts show, Alex and Tyler are back from the CMT Symposium in Washington D.C. and excited to dig into the markets! Following a big rally mid-week, they run through all the charts of interest and discuss the importance of keeping...
READ MORE
MEMBERS ONLY
Crucial Things to Know When Buying Pullbacks
by Joe Rabil,
President, Rabil Stock Research
In today's environment, it can be difficult to determine if the market is going to turn or keep declining. On this week's edition of Stock Talk with Joe Rabil, Joe discusses the importance of having a self-regulating trading pattern, and shows how your plan can help...
READ MORE
MEMBERS ONLY

What the Heck Just Happened?!!
by Carl Swenlin,
President and Founder, DecisionPoint.com
Yesterday's monster rally was not expected by most people, me included, and it left me a little disoriented. For weeks the Fed has been expected to raise interest rates by 50 basis points, and the realization of that expectation should have caused the market to sell off, shouldn&...
READ MORE
