MEMBERS ONLY

DP Trading Room: What's Up With Semiconductors?

by Erin Swenlin,
Vice President, DecisionPoint.com
Today Erin takes a deep dive into the Semiconductors (SMH). She goes over the "under the hood" health of the industry group and then takes us within the industry group to find the leadership stocks in that area.
Carl shares his wisdom on the current conditions of the...
READ MORE
MEMBERS ONLY

The One Chart to Watch as S&P 500 Makes New All-Time Highs

by David Keller,
President and Chief Strategist, Sierra Alpha Research
As the S&P 500 and Nasdaq 100 have once again made new all-time highs, and the Dow Jones Industrial Average has briefly broken above the 40,000 level for the first time, how should we think about further upside for our equity benchmarks?
There are two general ways...
READ MORE
MEMBERS ONLY

Is This the Magic Upward Break Everybody Was Waiting For?

by Julius de Kempenaer,
Senior Technical Analyst, StockCharts.com
KEY TAKEAWAYS
* Sector rotation still pointing to defense
* Upward break in SPY not supported by volume
* Asset class rotation starting to rotate in favor of bonds
No Confirmation In Volume
This week, the S&P 500 is breaking out above its previous high, undeniably a bullish sign. After the...
READ MORE
MEMBERS ONLY

A Grand Slam: Broader Stock Market Indexes Soar to New Highs

by Jayanthi Gopalakrishnan,
Director of Site Content, StockCharts.com
KEY TAKEAWAYS
* The S&P 500, Dow Jones Industrial Average, and the Nasdaq Composite close at all-time highs
* Bond prices also moved higher, as did gold and silver
* The VIX remains low, indicating investors are complacent
The bull market hasn't gone anywhere. Despite of worrying about the...
READ MORE
MEMBERS ONLY
Powerful Entry Strategy Using One Moving Average

by Joe Rabil,
President, Rabil Stock Research
On this week's edition of Stock Talk with Joe Rabil, Joe explains how to use one SMA to pinpoint great entries in pullback plays, demonstrating how it can develop in slightly different ways. He shows 3 different types of setups in the price action and its relationship to...
READ MORE
MEMBERS ONLY

The Top Performing Sector is Utilities?!?
by David Keller,
President and Chief Strategist, Sierra Alpha Research
In this edition of StockCharts TV'sThe Final Bar, Dave recaps a choppy day for equities, with utilities remaining atop the leaderboard for a second straight session. He lays out a potential reversal in interest rates, what that could mean for growth stocks, and recaps earnings plays including WYNN,...
READ MORE
MEMBERS ONLY
The Market Breadth Indicator You Should Be Following
by David Keller,
President and Chief Strategist, Sierra Alpha Research
In this edition of StockCharts TV'sThe Final Bar, Dave recaps another strong day for stocks as the S&P 500 regains its 50-day moving average. He then identifies key levels to watch for PLTR, LCID, NFLX, NVDA, and AAPL, and breaks down the latest market breadth indicator...
READ MORE
MEMBERS ONLY

35 Years of Crude Oil Forecasting the Future | Focus on Stocks: May 2024

by Larry Williams,
Veteran Investor and Author
All You Need to Know About Crude Oil and the Future
Gold, black gold, is what Crude Oil has become. The entire world runs on energy. 98% of our cars and transportation, our lights, the device you are using to read this... virtually everything we can do is thanks to...
READ MORE
MEMBERS ONLY
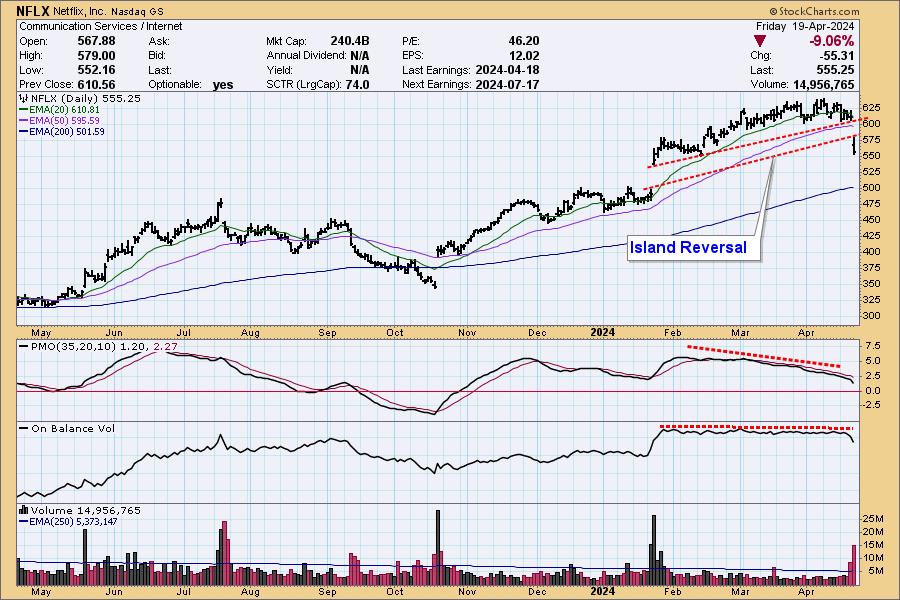
Netflix Gets Island Reversal On Earnings

by Carl Swenlin,
President and Founder, DecisionPoint.com
Netflix (NFLX) earnings were released today, and the news was good. . . except for one little thing. They also suspiciously announced that, starting next year, they would no longer be reporting subscriber metrics. That's like General Motors saying that they will no longer report how many cars and trucks...
READ MORE
MEMBERS ONLY
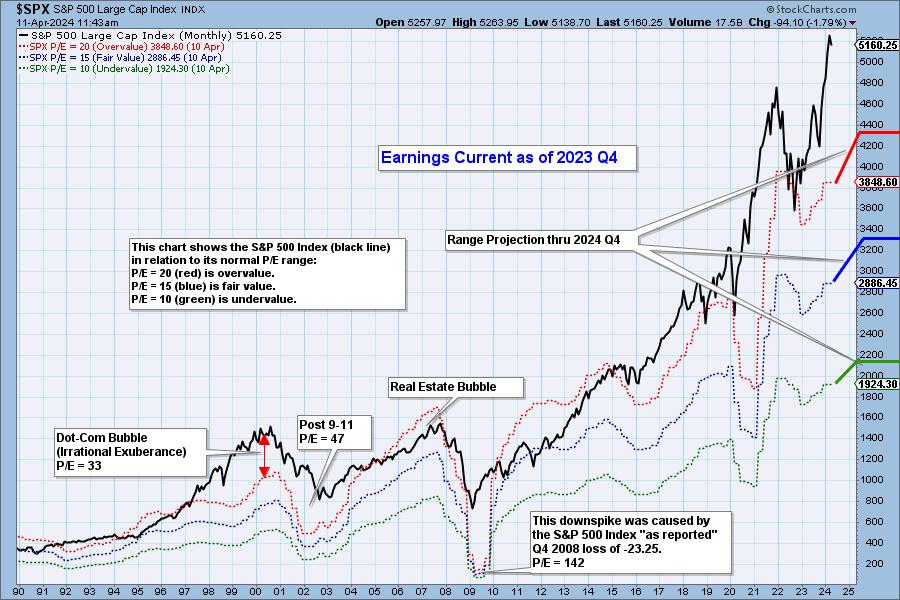
2023 Q4 Earnings Analysis and Projections Through 2024 Q4
by Carl Swenlin,
President and Founder, DecisionPoint.com
S&P 500 earnings are in for 2023 Q4, and here is our valuation analysis.
The following chart shows the normal value range of the S&P 500 Index, indicating where the S&P 500 would have to be in order to have an overvalued P/E...
READ MORE
MEMBERS ONLY

The Stock Market's Tremendous Resilience: What This Means For Q2
by Jayanthi Gopalakrishnan,
Director of Site Content, StockCharts.com
KEY TAKEAWAYS
* The Dow Jones Industrial Average, S&P 500, and Nasdaq Composite remains unfazed about interest rates remaining higher for longer.
* Commodity prices such as oil, gold, and cocoa are rising, even though inflation seems to be cooling.
* The top S&P 500 sector performers indicate the...
READ MORE
MEMBERS ONLY

Rates Look Set to Rise as TLT Resumes its Downtrend

by Arthur Hill,
Chief Technical Strategist, TrendInvestorPro.com
The 20+ Yr Treasury Bond ETF (TLT) failed again at the falling 40-week SMA and looks poised to resume its bigger downtrend. Keep in mind that bonds and yields move in the opposite direction. A resumption of the downtrend in TLT translates into a resumption of the uptrend in the...
READ MORE
MEMBERS ONLY

The Business Cycle is Edging its Way to a More Inflationary Stage

by Martin Pring,
President, Pring Research
Last week, I pointed out the inflationary consequences of the recent gold breakout, as gold market participants initially expect prices to firm up in the commodity pits and later the CPI itself. This week, we will take those thoughts a step further by relating swings in industrial commodity prices to...
READ MORE
MEMBERS ONLY

Would You Rather Own AMZN or AAPL Stock?
by David Keller,
President and Chief Strategist, Sierra Alpha Research
In this edition of StockCharts TV'sThe Final Bar, Dave shows how the Magnificent 7 has become much less of a comparable group of stocks, with TSLA, AAPL, and GOOGL all breaking down in recent weeks. He also tracks Bitcoin's retest of all-time highs and why high...
READ MORE
MEMBERS ONLY

Market In a "Wait and See" Mode: Awaiting Important Inflation Data
by Jayanthi Gopalakrishnan,
Director of Site Content, StockCharts.com
KEY TAKEAWAYS
* Investors are anxiously awaiting the PCE data to get clues on when the Fed will start cutting interest rates
* Small cap stocks look like they want to break out of a range and join the bullish equity rally
* Bitcoin is having a strong week with three consecutive significant...
READ MORE
MEMBERS ONLY
The Halftime Show: Don't Box the Invisible Man -- EPS Reports

by Pete Carmasino,
Chief Market Strategist, Chaikin Analytics
On this week's edition ofStockCharts TV'sHalftime, Pete takes a look at long-term trends. Semiconductors taking it on the chin. Inflation is still a problem. Bonds are selling off, and the Fed isn't cutting rates until, in Pete's opinion, the unemployment rate falls....
READ MORE
MEMBERS ONLY

Sector Spotlight: Stocks vs. Bonds -- Monthly Trends Revealed!
by Julius de Kempenaer,
Senior Technical Analyst, StockCharts.com
On this episode of StockCharts TV's Sector Spotlight, I review the monthly charts for January 2024, in combination with the Relative Rotation on the Monthly RRGs for asset classes and sectors. At asset class level, the preference for stocks over bonds remains clearly visible. Looking at the monthly...
READ MORE
MEMBERS ONLY

Three Things I WISH I'd Known About Trading
by David Keller,
President and Chief Strategist, Sierra Alpha Research
In this edition of StockCharts TV'sThe Final Bar, Dave speaks to weakening short-term breadth conditions as the McClellan Oscillator rotates to a bearish level this week. Guest Dave Landry of DaveLandry.com drops some serious trader wisdom and also shares what he does first thing every morning to...
READ MORE
MEMBERS ONLY

S&P 500, Dow Jones Hit All-Time Highs Again; Tech Stocks Back in the Spotlight
by Jayanthi Gopalakrishnan,
Director of Site Content, StockCharts.com
KEY TAKEAWAYS
* The S&P 500, Dow Jones Industrial Average, and Nasdaq 100 closed at all-time highs
* Tech stocks are back in focus as mega-tech companies wrap up their Q4 earnings
* Investors should take advantage of pullbacks if they want to add positions to their portfolios
What a week!...
READ MORE
MEMBERS ONLY

GNG TV: A STRONG Week for Equities and Internet Stocks SOAR!

by Alex Cole,
Co-founder, GoNoGo Charts®
On this week's edition of the GoNoGo Charts show from StockCharts TV, Alex takes a look at the market using the GoNoGo methodology as the S&P 500 digests the rally to all time highs. After using the GoNoGo Asset Map to look at the trends across...
READ MORE
MEMBERS ONLY
Bullish Buyers Return After Market Selloff
by David Keller,
President and Chief Strategist, Sierra Alpha Research
In this edition of StockCharts TV'sThe Final Bar, Jay Woods, CMT of Freedom Capital Markets brings the energy of the NYSE floor to the show, relating today's market rebound to longer term themes for small caps and regional banks. Dave shares one breadth indicator recognizing broad...
READ MORE
MEMBERS ONLY
The Halftime Show: Fed Stays Put, Bond Markets Rally!
by Pete Carmasino,
Chief Market Strategist, Chaikin Analytics
Uncertainty needs attention in order for it to make you second guess yourself. Instead, wait for trends to change, and then make changes. On this week's edition ofStockCharts TV'sHalftime, Pete Carmasino goes over some thoughts on interest rates and when the Fed will finally cut. He...
READ MORE
MEMBERS ONLY

S&P 500 Falls, Nears First Support Level -- How Much Lower Can It Go?
by Jayanthi Gopalakrishnan,
Director of Site Content, StockCharts.com
KEY TAKEAWAYS
* The Fed leaves interest rates unchanged as expected, but investors weren't happy
* S&P 500, Dow Jones Industrial Average, and Nasdaq Composite all close lower after Fed decision
* The 10-year Treasury yield falls to a three week low
Will the Fed cut interest rates at...
READ MORE
MEMBERS ONLY

S&P 500 Still SUPER Undervalued!
by David Keller,
President and Chief Strategist, Sierra Alpha Research
In this edition of StockCharts TV'sThe Final Bar, guest Ari Wald, CFA CMT of Oppenheimer lays out a bull case for the S&P 500 based on valuations and forward returns given strong breadth conditions. Dave reviews stocks reporting earnings this week, including LOGI, LMT, PG, DHI,...
READ MORE
MEMBERS ONLY
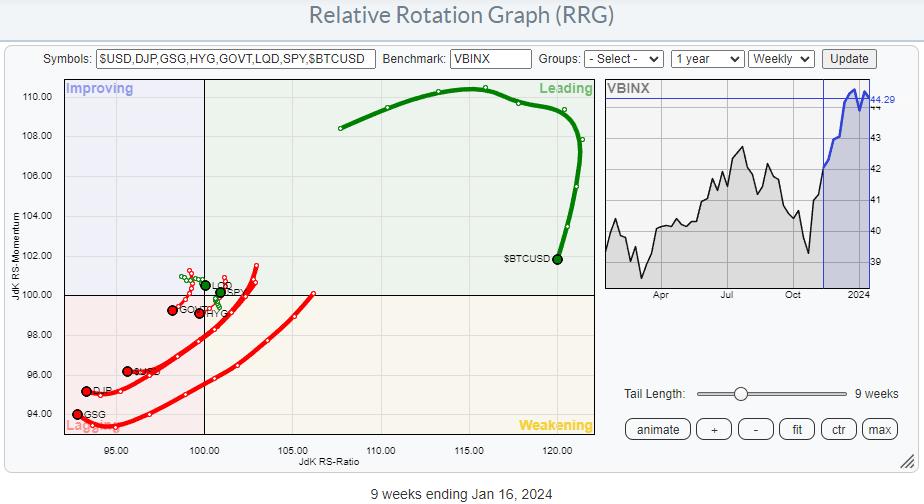
Watch Stocks Triumph in Latest Asset Allocation Battle
by Julius de Kempenaer,
Senior Technical Analyst, StockCharts.com
KEY TAKEAWAYS
* Commodities and USD rotating deep inside the lagging quadrant, indicating weak relative strength
* Bitcoin is in a strong relative uptrend vs all other asset classes, but going through a corrective phase
* Stocks are the clear winner in this asset allocation battle
The RRG above shows the rotation of...
READ MORE
MEMBERS ONLY

The Halftime Show: Escape the Chaos - Discovering the Key to Tackling Market Uncertainty
by Pete Carmasino,
Chief Market Strategist, Chaikin Analytics
Uncertainty needs attention in order for it to make you second guess yourself. Instead, wait for trends to change, and then make changes. On this week's edition ofStockCharts TV'sHalftime, Pete Carmasino shares a broad market overview, starting with a divergence signal on the bullish percent of...
READ MORE
MEMBERS ONLY

Don't Miss Out! 2 Promising Sectors in Early 2024
by David Keller,
President and Chief Strategist, Sierra Alpha Research
In this edition of StockCharts TV'sThe Final Bar, Julius de Kempenaer of RRG Research talks stocks over bonds and highlights two sectors with upside potential based on improvements in their relative strength. Dave unveils a bearish momentum divergence for Netflix and reveals two technology stocks that could still...
READ MORE
MEMBERS ONLY

MEM TV: Jobs Growth Reveals NEW Opportunities in These AREAS

by Mary Ellen McGonagle,
President, MEM Investment Research
Not a great start to the year! In this episode of StockCharts TV'sThe MEM Edge, Mary Ellen takes a look at where the broader markets closed, and sees we're hovering around some rather critical areas. The sharp pullback in growth stocks drove last week's...
READ MORE
MEMBERS ONLY

Guidelines for 2024 | Focus on Stocks: January 2024
by Larry Williams,
Veteran Investor and Author
Let's Get This Out of The Way Right Now
For the last 18 years, I've had a love affair with my annual forecast report. Until I began writing this letter, it was the only thing I did. Many of you purchased it last year, and some...
READ MORE
MEMBERS ONLY

Investing in 2024: 3 Promising Opportunities To Watch
by Jayanthi Gopalakrishnan,
Director of Site Content, StockCharts.com
KEY TAKEAWAYS
* The stock market ended with a bang in 2023 in spite of inflationary fears
* Small caps and emerging markets are breaking out of a trading range so look for value plays in these asset groups
* Bitcoin has soared and the trend is likely to continue in 2024
The...
READ MORE
MEMBERS ONLY

Intermediate-Term Participation Levels Are Very Overbought, and They Are Weak Long-Term
by Carl Swenlin,
President and Founder, DecisionPoint.com
When we discuss participation, we are referring to the more specific and accurate assessment of breadth available with the Golden Cross and Silver Cross Indexes. The venerable and widely-known Golden Cross is when the 50-day moving average of a price index crosses up through the 200-day moving average, which signals...
READ MORE
MEMBERS ONLY

More from Mish's Outlook 2024 -- 17 Predictions
One area I cover in the Outlook 2024 is the teachings of Raymond Lo and how he sees the upcoming Year of the Dragon. Part of my comments on his analysis is based on this statement by Lo:
"Many has the misunderstanding that the Dragon is glamorous auspicious animal...
READ MORE
MEMBERS ONLY
MEM TV: Markets in Bullish Mode as We Head Toward Year-End
by Mary Ellen McGonagle,
President, MEM Investment Research
In this episode of StockCharts TV'sThe MEM Edge, join Mary Ellen as she as she dives into the latest news and trends that are driving price action in the markets. From housing updates to consumer confidence and inflationary data, she breaks it all down and shows you how...
READ MORE
MEMBERS ONLY

Stock Market Delivered Huge Gift, Wipes Away Recession Fears
by Jayanthi Gopalakrishnan,
Director of Site Content, StockCharts.com
KEY TAKEAWAYS
* Cooling inflation data sends the S&P 500 higher, which is a good start to the Santa Claus rally
* Investors should monitor small-cap stocks and bonds and consider adding them to investment portfolios
* Volatility is low but investors should continue monitoring the VIX to identify changes in...
READ MORE
MEMBERS ONLY

GNG TV: Buying Opportunity or Trend Reversal?
by Alex Cole,
Co-founder, GoNoGo Charts®

by Tyler Wood,
Co-founder, GoNoGo Charts®
In this edition of the GoNoGo Charts show, Tyler and Alex dive into the current trends and momentum in the markets, in order to help navigate through the ever-changing landscape of stocks, bonds, commodities, and the dollar. Is the recent pullback in the S&P 500 is just a...
READ MORE
MEMBERS ONLY

Top Five Charts of 2023 #2: Ten-Year Treasury Yield
by David Keller,
President and Chief Strategist, Sierra Alpha Research
In the second of a five-part special series on StockCharts TV'sThe Final Bar, Dave takes a deep dive into the bond markets, talking rising rates, Fed rate hikes, value vs. growth, inverted yield curves, and what the bond markets in 2023 could tell us about potential future paths...
READ MORE
MEMBERS ONLY

DP Trading Room: Finally! Signs of Life in the Energy Sector
by Erin Swenlin,
Vice President, DecisionPoint.com
by Carl Swenlin,
President and Founder, DecisionPoint.com
In this week's edition of The DecisionPoint Trading Room, with Energy (XLE) finally showing signs of life, Carl and Erin dive into the sector to learn more about participation and new momentum. Carl discusses Total Returns on SPX, which are showing new all-time highs before the actual index....
READ MORE
MEMBERS ONLY

Energy Sector Finally Becoming Bullish?
by Carl Swenlin,
President and Founder, DecisionPoint.com
We publish this table daily to give an overview of the market, sector, and industry group indexes we follow. The Intermediate-Term Trend Model (ITTM) BUY Signals occur when the 20-day EMA crosses up through the 50-day EMA (Silver Cross). Long-Term Trend Model (LTTM) BUY Signals occur when the 50-day EMA...
READ MORE
MEMBERS ONLY

Larry's "Family Gathering" December 14, 2023 Recording
by Larry Williams,
Veteran Investor and Author
In this video, Larry presents his forecast for FANG stocks, including an analysis of the stock selloff for META. He then digs into the cycle of debt and why he's bothered about credit card writeoffs. After that, he examines the weekly economic index and GDP and how they...
READ MORE
MEMBERS ONLY
DP Trading Room: How Bad Data From Major Indexes Leads to Bad Analysis
by Erin Swenlin,
Vice President, DecisionPoint.com
by Carl Swenlin,
President and Founder, DecisionPoint.com
In this week's edition of The DecisionPoint Trading Room, Carl discusses his recent epiphany regarding data derived from major indexes. Bad data will lead to bad analysis, so it's important to understand this concept for analyzing major indexes. He and Erin discuss the implications of Magnificent...
READ MORE
