MEMBERS ONLY

Santa Comes to Wall Street | Focus on Stocks: December 2023

by Larry Williams,
Veteran Investor and Author
Santa Comes to Wall Street
Maybe St. Nick gets into the eggnog before he visits Wall Street each year, because the trading pattern has been a step up, then a stumble down before recovering at the end of the year. I first noticed this Up-Down-Up pattern back in the early...
READ MORE
MEMBERS ONLY

DP Trading Room: How To Time Your Trade Entries & Exits Like a Pro

by Erin Swenlin,
Vice President, DecisionPoint.com
In this week's edition of The DecisionPoint Trading Room, Erin flies solo today and gives everyone a refresher course on how to expertly time your entries and exits for trades, using the 5-minute candlestick chart. She covers the market in general, followed by analysis of sectors of interest...
READ MORE
MEMBERS ONLY

Wrong Data Gets Wrong Answers

by Carl Swenlin,
President and Founder, DecisionPoint.com
A recent article on the Business Insider site reported a set of Death Cross/Golden Cross signals on the Dow Jones Industrial Average ($INDU). Specifically, on November 13, the 50-day moving average crossed down through the 200-day moving average, commonly called a Death Cross. Two days later, the 50-day moving...
READ MORE
MEMBERS ONLY
These Three Intermarket Relationships are at Key Juncture Points

by Martin Pring,
President, Pring Research
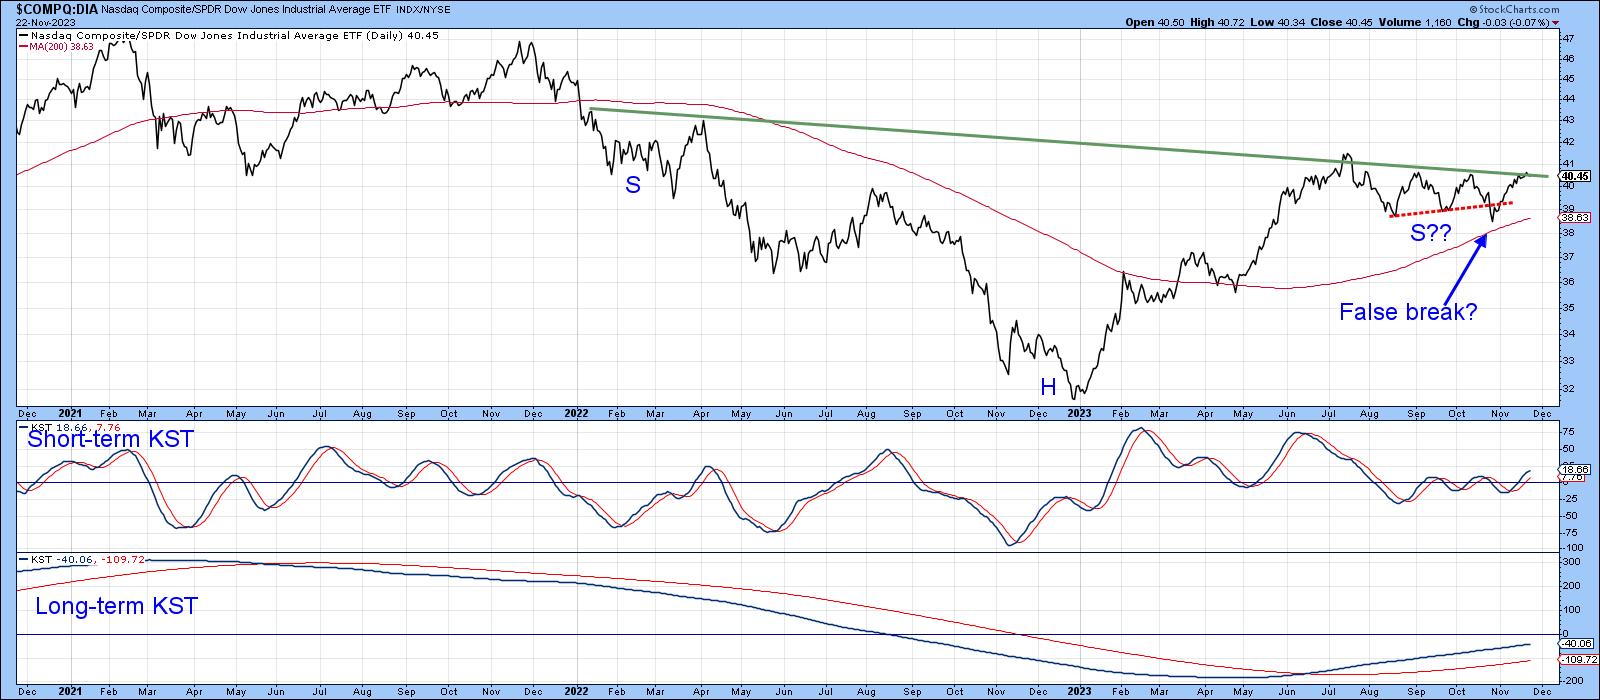
We spend a lot of time analyzing sector rotation, but there are also other relationships that can offer useful insights to internal market dynamics. One aspect of this is the relationship between market averages.
NASDAQ vs. the DJIA
As an example, Chart 1 plots the relationship between the NASDAQ Composite...
READ MORE
MEMBERS ONLY

The Stock Market In 3 Charts: Market Breadth, Bonds, Sentiment

by Jayanthi Gopalakrishnan,
Director of Site Content, StockCharts.com
KEY TAKEAWAYS
* Stock market breadth is widening which is an indication that market internals are strong
* Falling treasury yields suggest that inflation expectations are declining
* Investors are more complacent than in October which is bullish for equities
Stocks are having a good November, which aligns with typical stock market behavior....
READ MORE
MEMBERS ONLY
Is It Time for Interest Rates to Fall?
by Martin Pring,
President, Pring Research
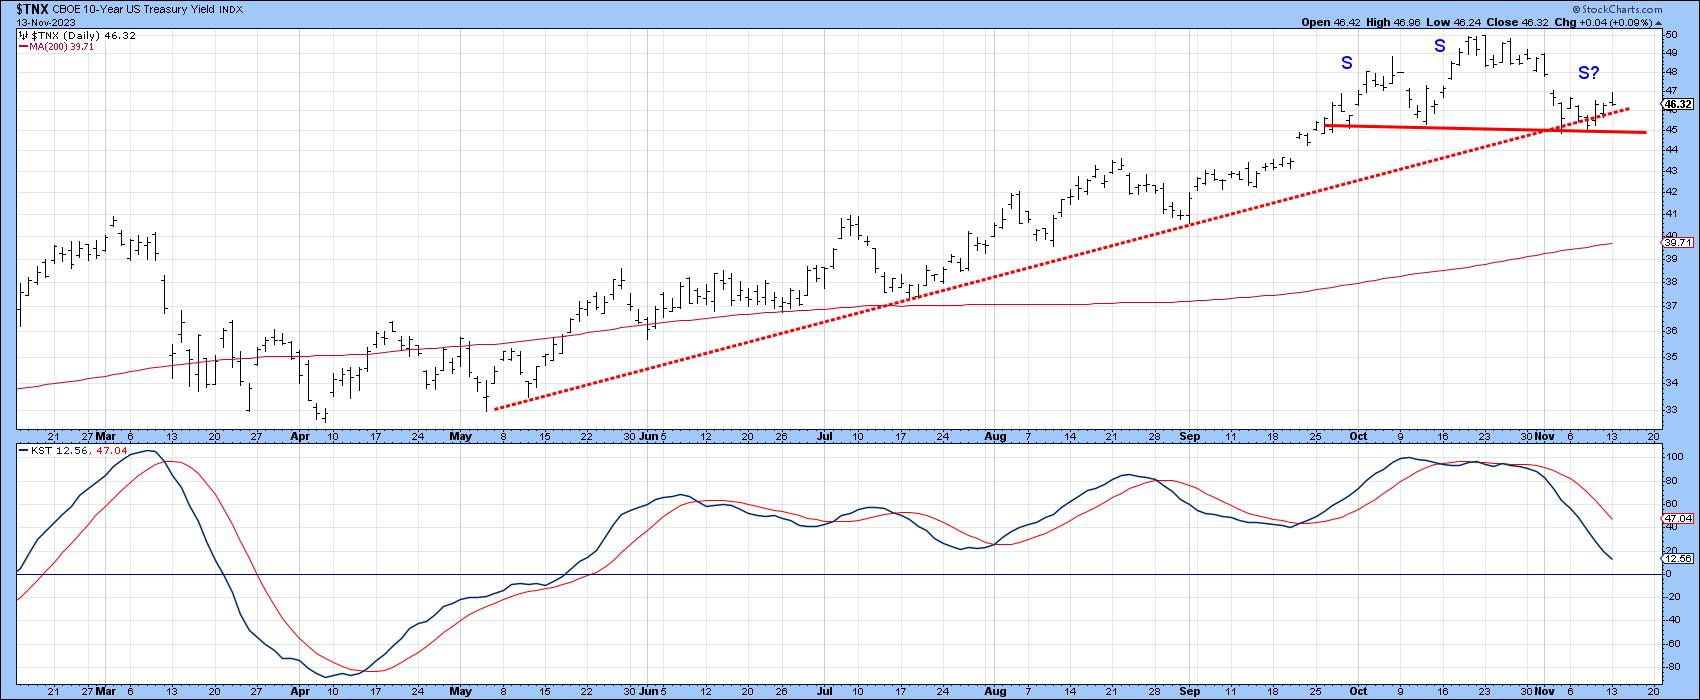
I last wrote about bonds and interest rates in August, as they were in the process of challenging their October 2022 highs. My conclusion at the time was that they were likely to go through, but that upside potential would be limited due to what seemed at the time to...
READ MORE
MEMBERS ONLY

DP Trading Room: Is Your Portfolio OUTDATED? The Truth About The 60/40 Mix
by Erin Swenlin,
Vice President, DecisionPoint.com
by Carl Swenlin,
President and Founder, DecisionPoint.com
In this week's edition of The DecisionPoint Trading Room, Carl opens the show with a discussion about the typical 60/40 Portfolio (60% US Stocks/40% US Bonds) and whether it will continue to serve you well given the decline in Bonds. Is this portfolio blend obsolete? Both...
READ MORE
MEMBERS ONLY

This Relative Strength Signal Can Provide Early Warning Signs

by Joe Rabil,
President, Rabil Stock Research
On this week's edition of Stock Talk with Joe Rabil, Joe shows how to use comparative relative strength to identify important shifts in trend, sometimes well in advance of price. He explains what the line means, plus how to use it to provide early warning signals and for...
READ MORE
MEMBERS ONLY

Long-Term Bond Rally On the Way
by Carl Swenlin,
President and Founder, DecisionPoint.com
After making a major low in 1981, bonds entered a rising trend that lasted nearly 40 years. During that period, new rules and expectations were constructed and acquired that still influence decision making today -- which is unfortunate, because the game has changed.
In 2022, the long-term rising trend line...
READ MORE
MEMBERS ONLY

Stock Indexes Continue Winning Streak: Growth Stocks Still In the Lead
by Jayanthi Gopalakrishnan,
Director of Site Content, StockCharts.com
KEY TAKEAWAYS
* The S&P 500 and Nasdaq Composite continue their winning streak
* Crude oil continues to slide as it trades below its 200-day moving average
If there were one thing that was surprising about the stock market, it would be how quickly the charts changed in November. Equities...
READ MORE
MEMBERS ONLY
This Key Resistance Level is Crucial for the S&P 500

by David Keller,
President and Chief Strategist, Sierra Alpha Research
In this edition of StockCharts TV'sThe Final Bar, Dave breaks down the charts of the S&P 500 and Nasdaq 100 with a focus on the downtrend channel for the QQQ and key resistance at 4400 for the S&P 500. He answers viewer questions on...
READ MORE
MEMBERS ONLY
DP Trading Room: This Powerful Scan Finds Stocks Showing NEW Momentum
by Carl Swenlin,
President and Founder, DecisionPoint.com
by Erin Swenlin,
Vice President, DecisionPoint.com
In this week's edition of The DecisionPoint Trading Room, Carl covers the major markets as well as the Dollar, Gold, yields, and Bitcoin. Erin runs her "Momentum Sleepers Scan" to find stocks that are showing new momentum under the surface. She uncovers a few stocks for...
READ MORE
MEMBERS ONLY

Bonds Got Clipped. Now What?

by Bruce Fraser,
Industry-leading "Wyckoffian"
Last week's sharp upward reversal in the bond market followed the FOMC Interest Rate decision. A decision to not change the Fed Funds Interest Rate target. Unlike the prior meeting ‘non-action', this decision inspired robust bond and stock buying by the investment community. The downward stride of...
READ MORE
MEMBERS ONLY
Start Trading Like a Pro with These RSI Divergence Signals!
by Joe Rabil,
President, Rabil Stock Research
On this week's edition of Stock Talk with Joe Rabil, Joe presents a few examples in different timeframes of how to use the RSI indicator for divergences. He explains what to look for when finding counter trend plays, as well as divergence with the trend. Joe then analyses...
READ MORE
MEMBERS ONLY

Sector Spotlight: Monthly Charts Suggest Downside Risk is Limited

by Julius de Kempenaer,
Senior Technical Analyst, StockCharts.com
On this episode of StockCharts TV's Sector Spotlight, I address the completed monthly charts for October and assess the condition of the long term trends, along with whether they are still in play or have shifted. As usual, I start with the long-term rotation and trends in asset...
READ MORE
MEMBERS ONLY

Signs of Top in Rates As Fed Says NO CHANGE
by David Keller,
President and Chief Strategist, Sierra Alpha Research
In this edition of StockCharts TV'sThe Final Bar, Katie Stockton, CMT of Fairlead Strategies shares her weekly charts of the S&P 500, VIX, and XLK and identifies three areas of opportunity through year-end 2023. Dave breaks down this week's Fed meeting from a technical...
READ MORE
MEMBERS ONLY

The Halftime Show: Watch the Unemployment Rate - It Could Change Everything!

by Pete Carmasino,
Chief Market Strategist, Chaikin Analytics
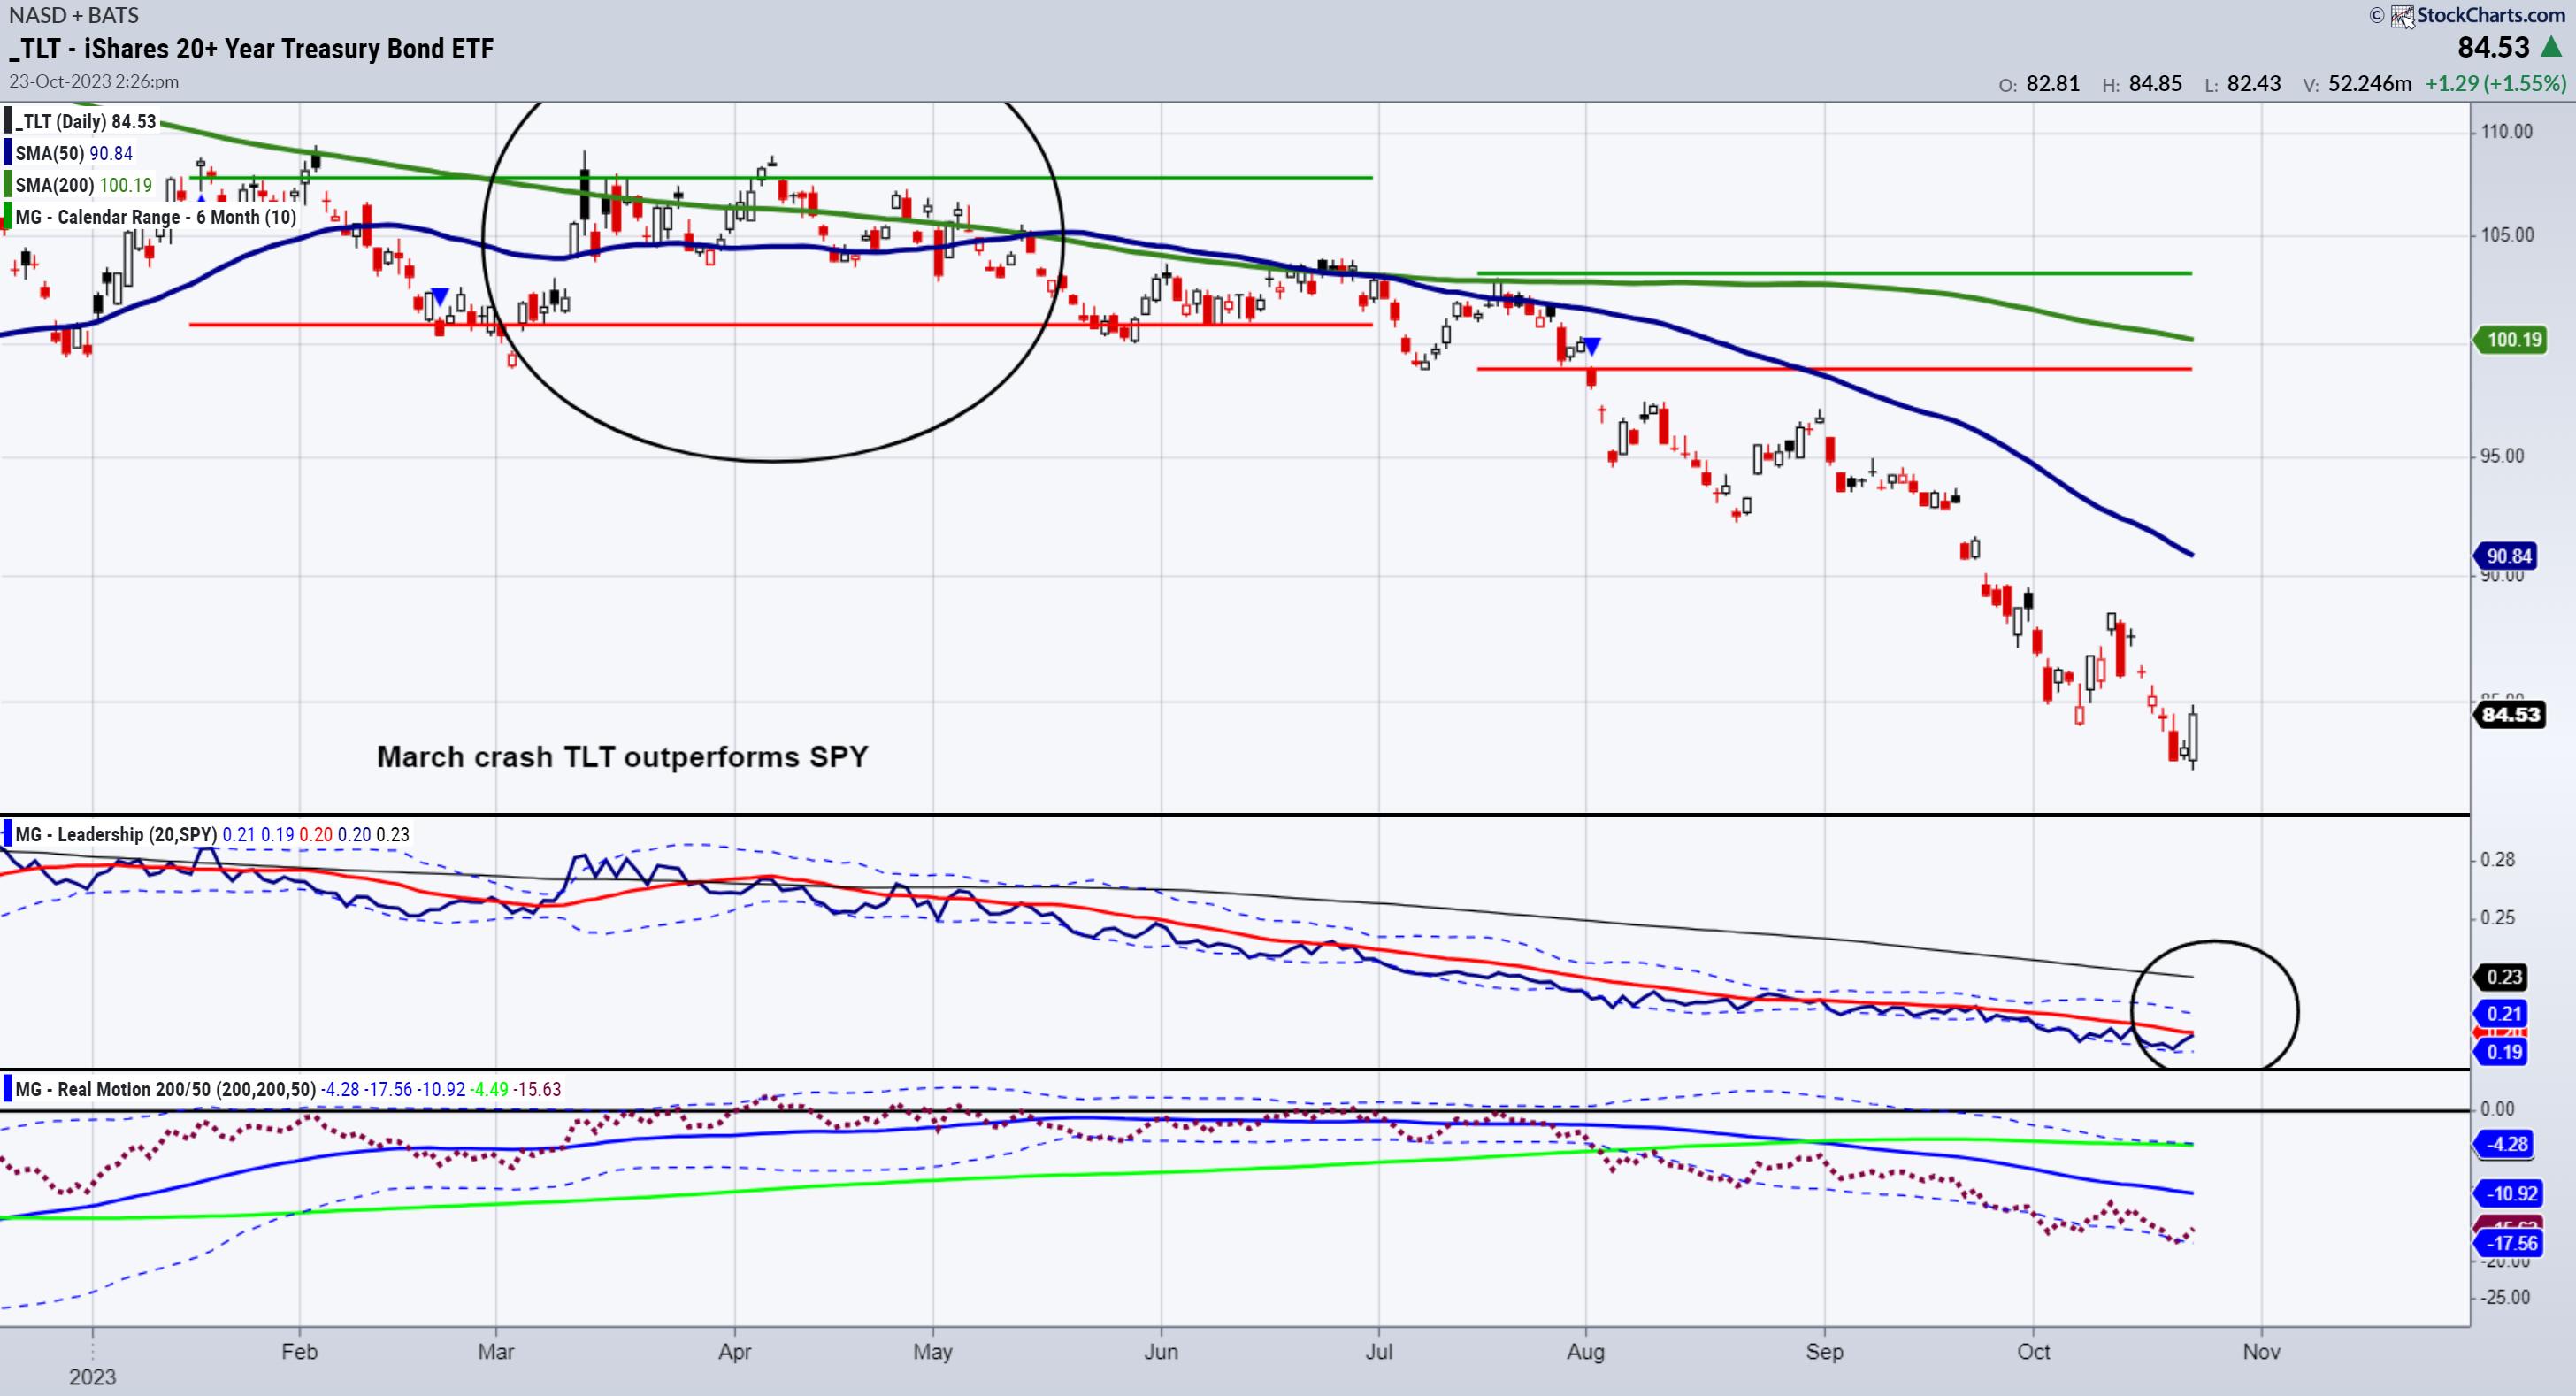
On this week's edition of StockCharts TV'sHalftime, Pete explains how his TLT call from 10/10 was spot-on! But that could all change based on the unemployment rate. Pete believes that rates will fallifthe unemployment rate spikes higher, likely to the 4.25-4.5% level. Until...
READ MORE
MEMBERS ONLY
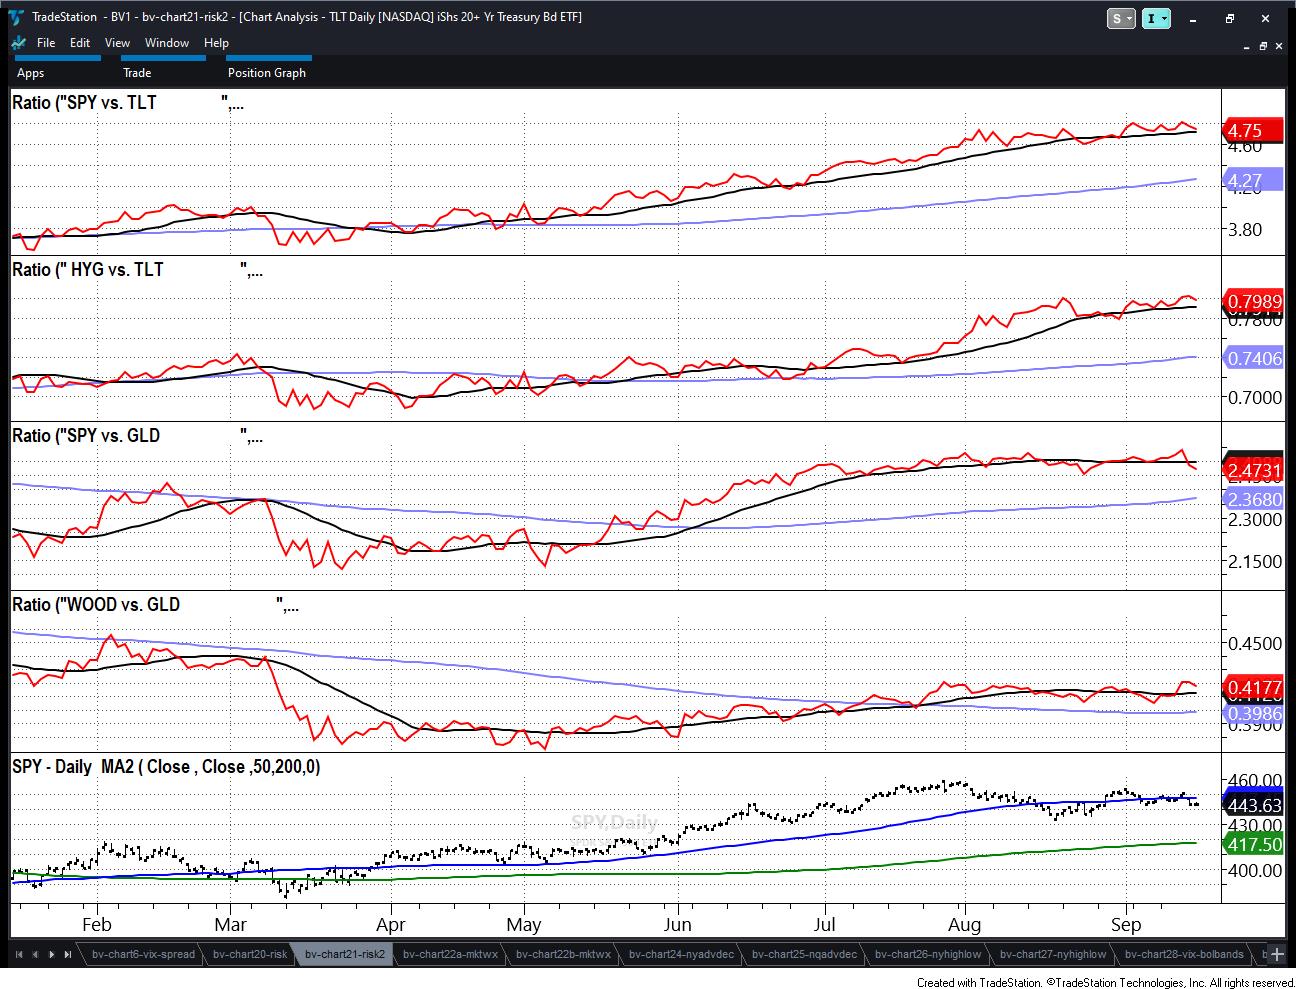
It's All About Risk and the Long Bonds
Monday, after a lot of spooky headlines, the SPDR S&P 500 ETF (SPY) touched its 23-month moving average (MA) or the two-year biz cycle breakout point right around 417.
Plus, the iShares 20+ Year Treasury Bond ETF (TLT)flashed green as didIWM,the small caps.
The big question...
READ MORE
MEMBERS ONLY

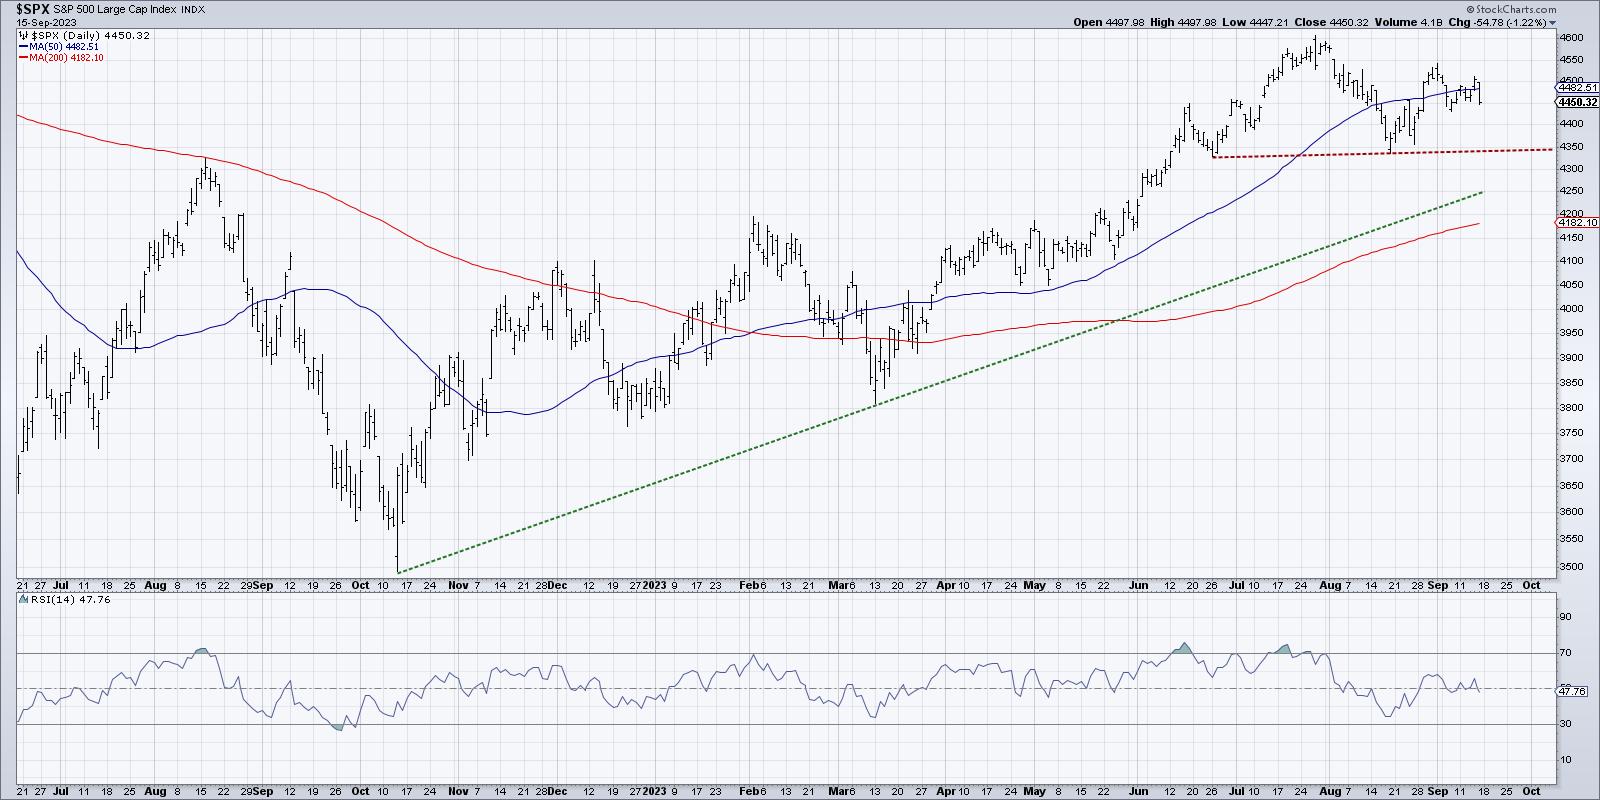
S&P Breaks Below 200-Day Moving Average: It's Going to be a Big Volatile Ride
by Jayanthi Gopalakrishnan,
Director of Site Content, StockCharts.com
KEY TAKEAWAYS
* The S&P 500 index closed lower for the week and below its 200-day moving average
* Long-dated Treasury yields continue to move higher as investors digest the higher-for-longer narrative
* VIX has been trending higher which indicates a rise in investor uncertainty
Stock market action in the last...
READ MORE
MEMBERS ONLY
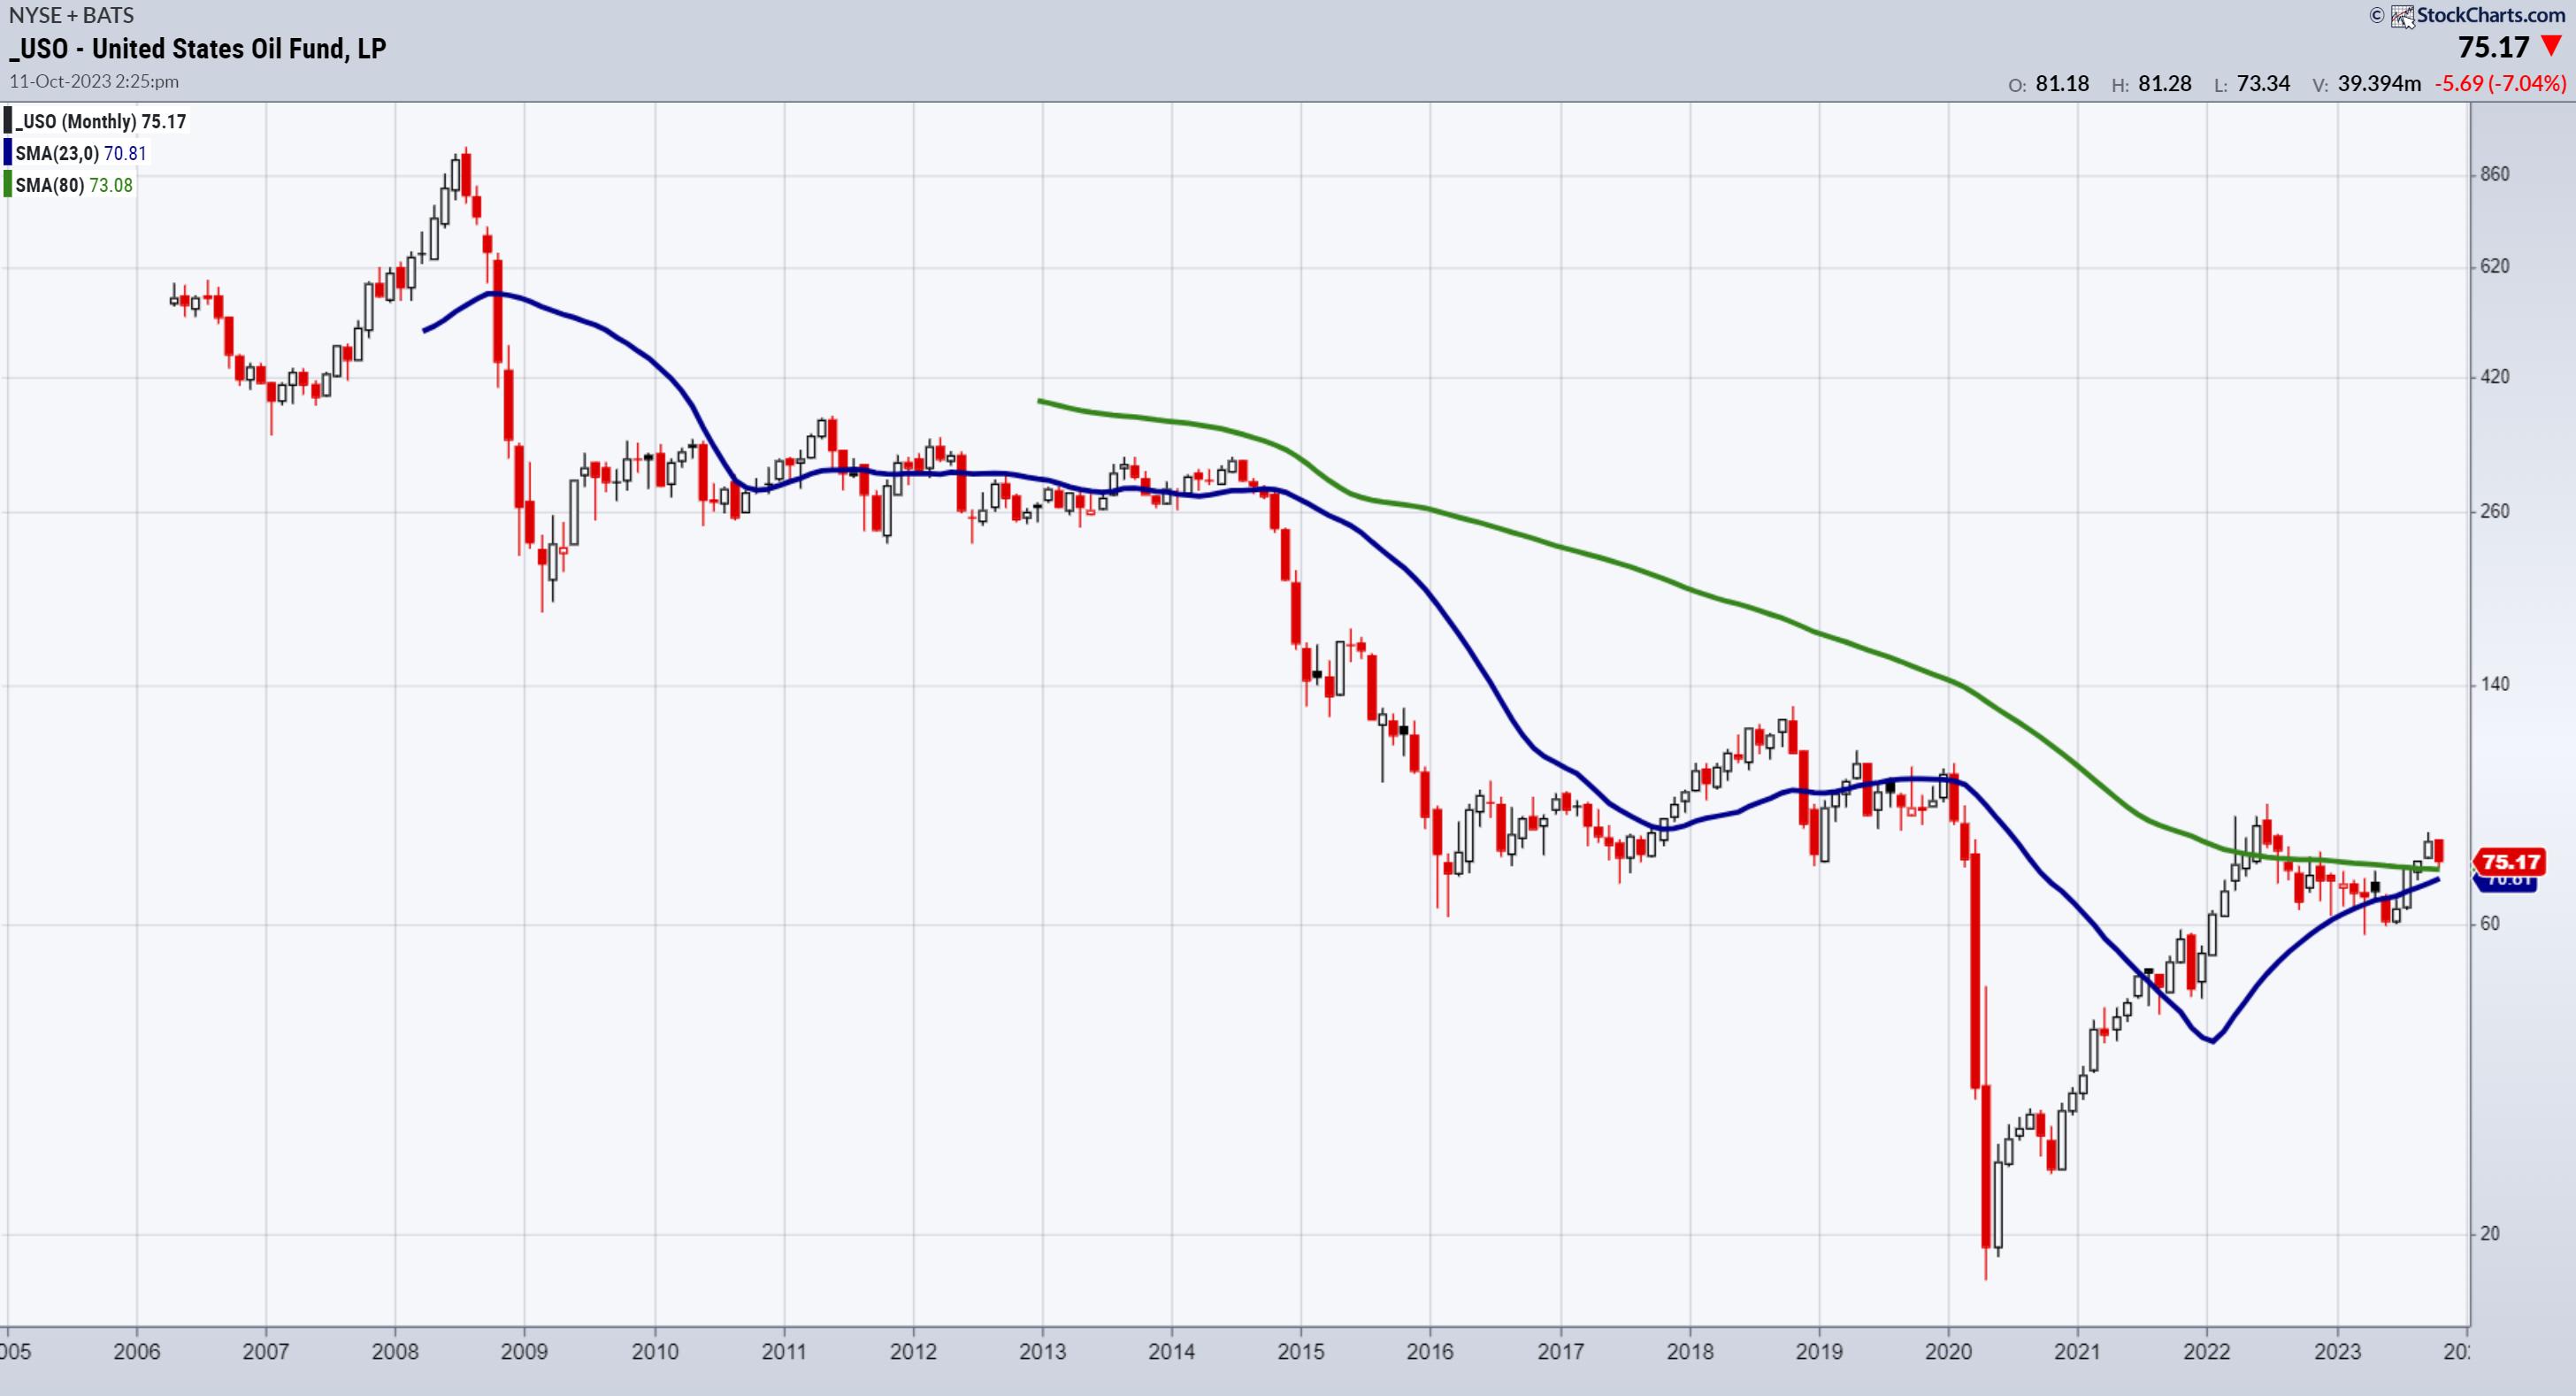
Monthly Chart Points to Much Higher Oil Prices Coming
Before we begin, just a note to mention that TLT took out the fast MA featured in the October 10th daily, while SPY underperformed. If that is a trend, it behooves you to review that daily.
Loyal readers of the Daily know that we often focus on zooming out to...
READ MORE
MEMBERS ONLY

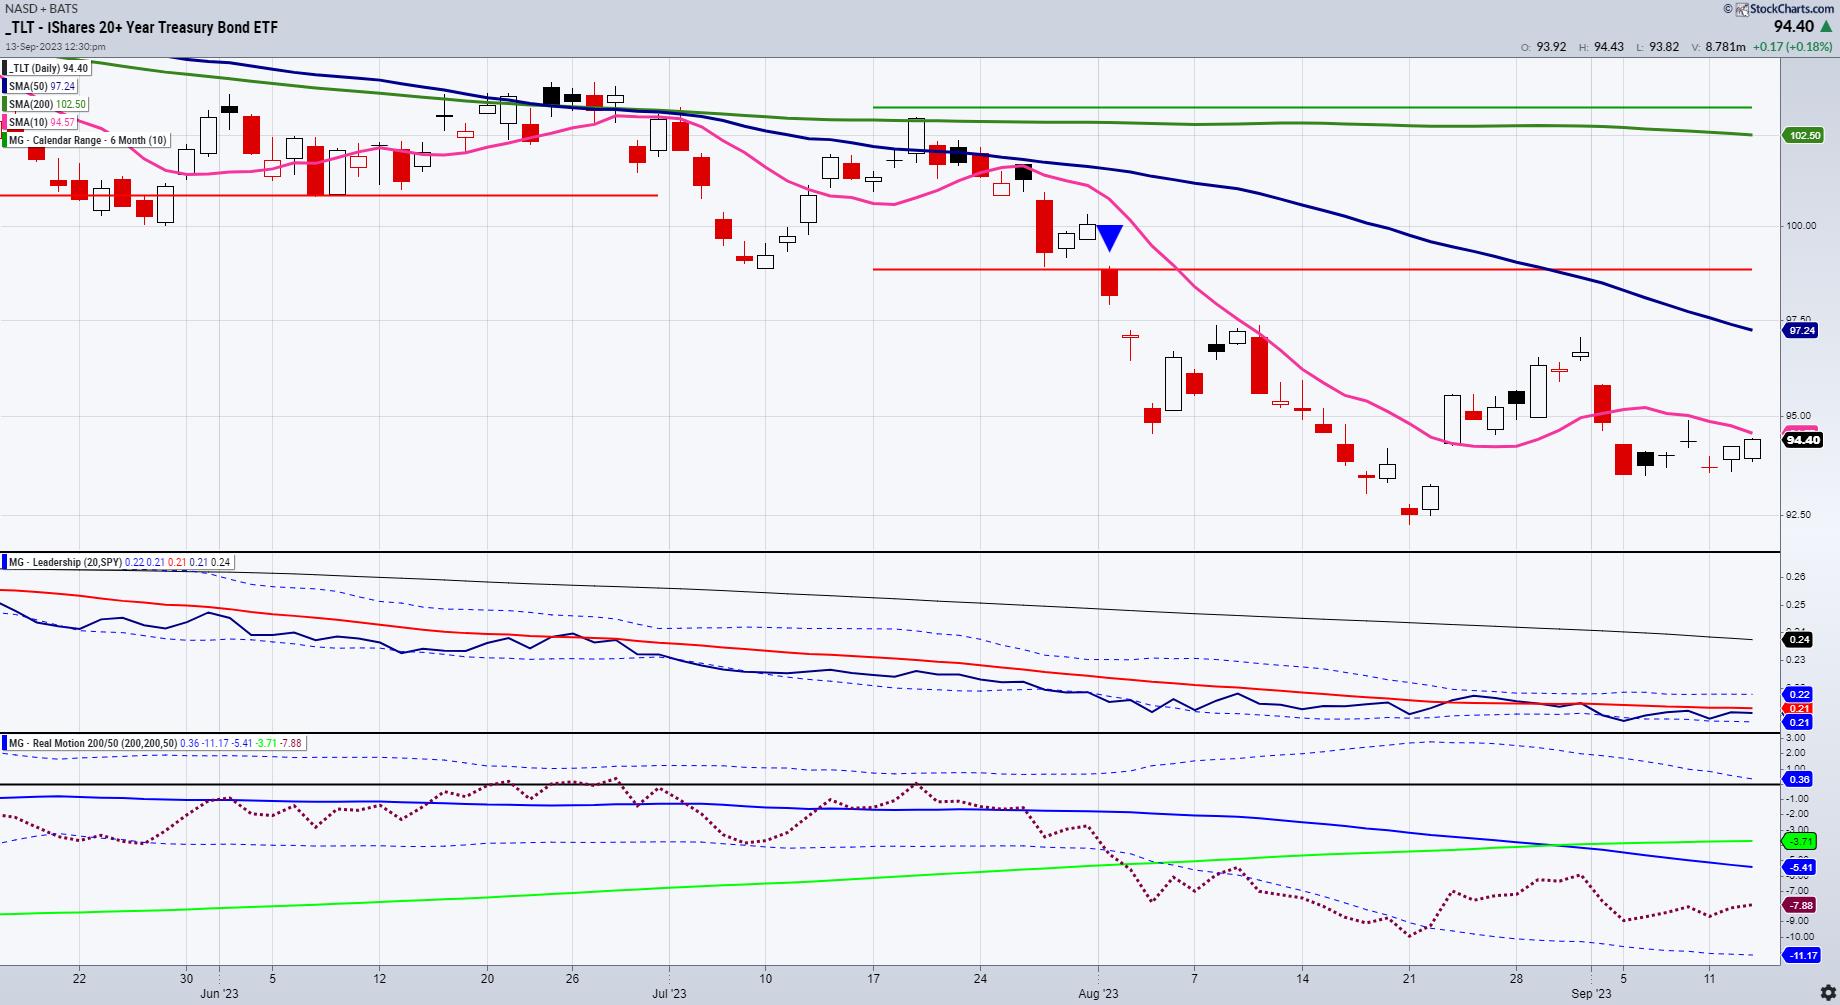
A Closer Look at Long Bonds and The US Dollar
The next direction of the long bonds is crucial in determining the macro.
First, after a wrecking ball crash and ahead of the FOMC, we could surmise that a bottoming-like action defines the last several trading days. Our Real Motion indicator shows a mean reversion. The 10-day moving averages (cyan...
READ MORE
MEMBERS ONLY
The Halftime Show: Are Oversold Conditions Real? The Bullish Percent Says So
by Pete Carmasino,
Chief Market Strategist, Chaikin Analytics
On this week's edition of StockCharts TV'sHalftime, Pete reviews the bullish percent index; with all the market talking about oversold conditions, the bullish percent makes that narrative make more sense. He then reviews the 20+ Year Treasury Bond ETF (TLT) and deciphers what is happening on...
READ MORE
MEMBERS ONLY
Navigating Uncertain Times: Market Recap with Mish Schneider
In this special edition of StockCharts TV'sThe Final Bar, Mish Schneider, Chief Strategist at MarketGauge, takes over for Dave Keller to share her thoughts on the daily Market Recap during a day of uncertain news.
This video originally premiered on October 9, 2023. Watch on our dedicated Final...
READ MORE
MEMBERS ONLY
What We Will Use to Ascertain the Market's Next Moves
For consistency, here are the key go-tos during an uncertain time in the market:
1. The next direction of long bonds (TLT).
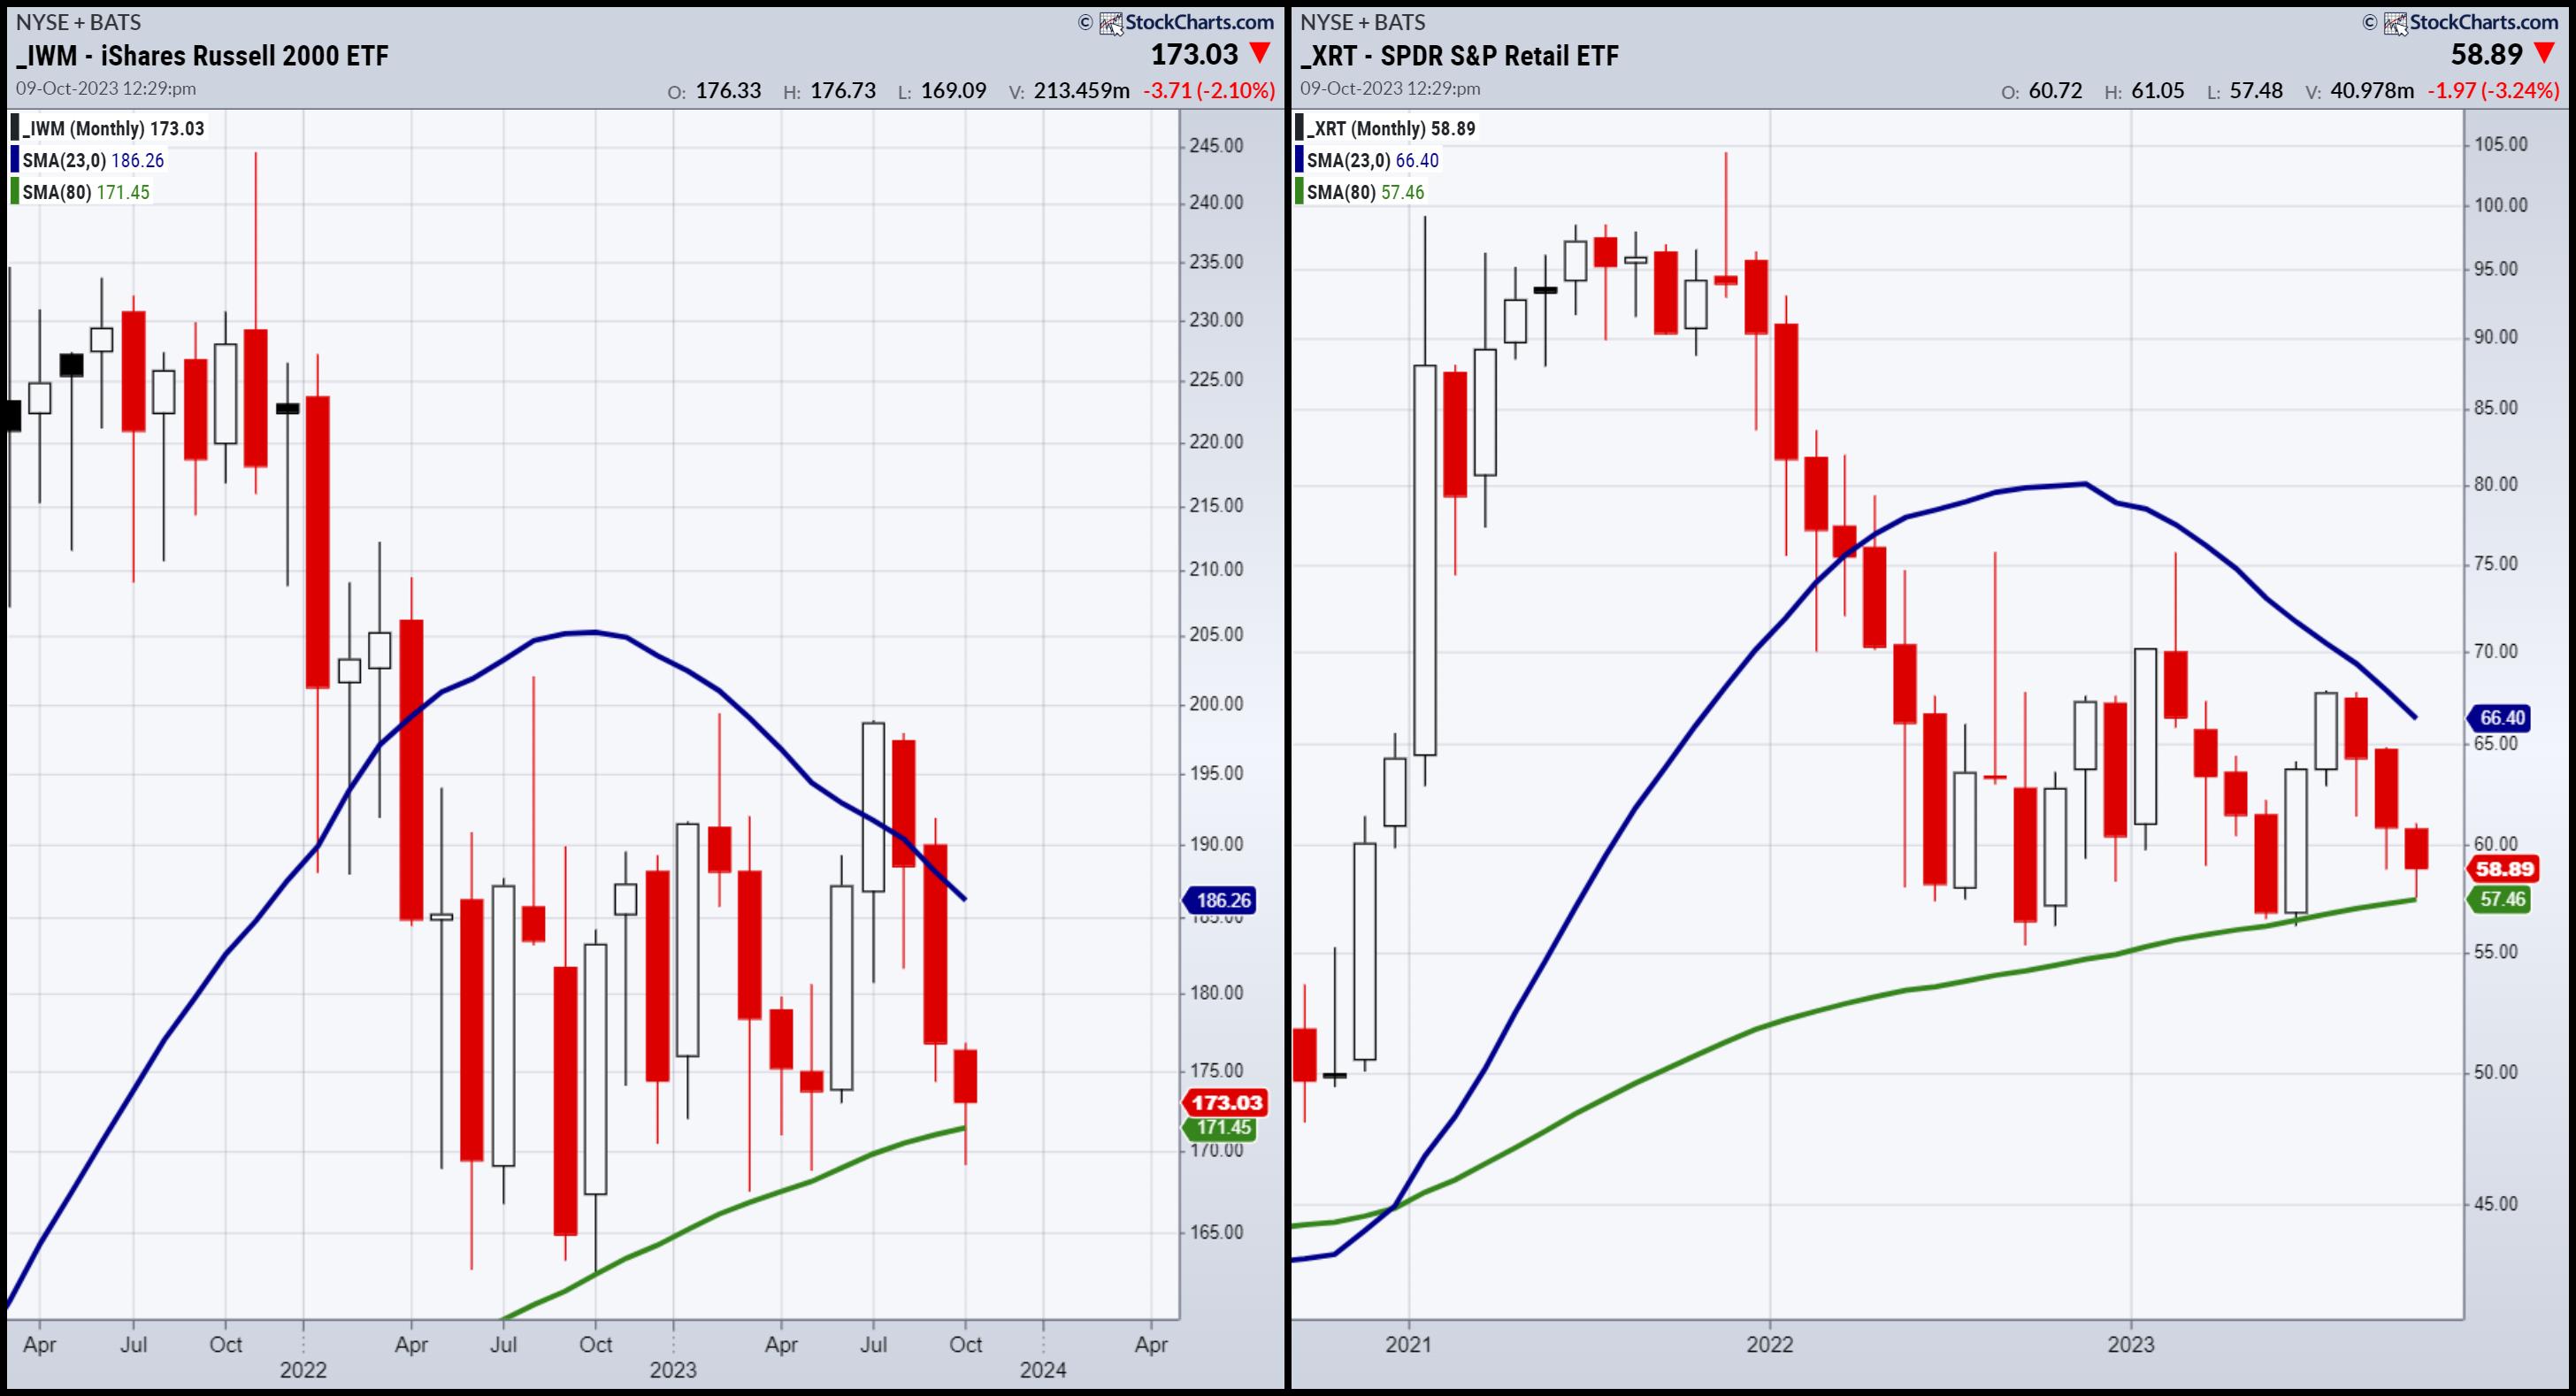
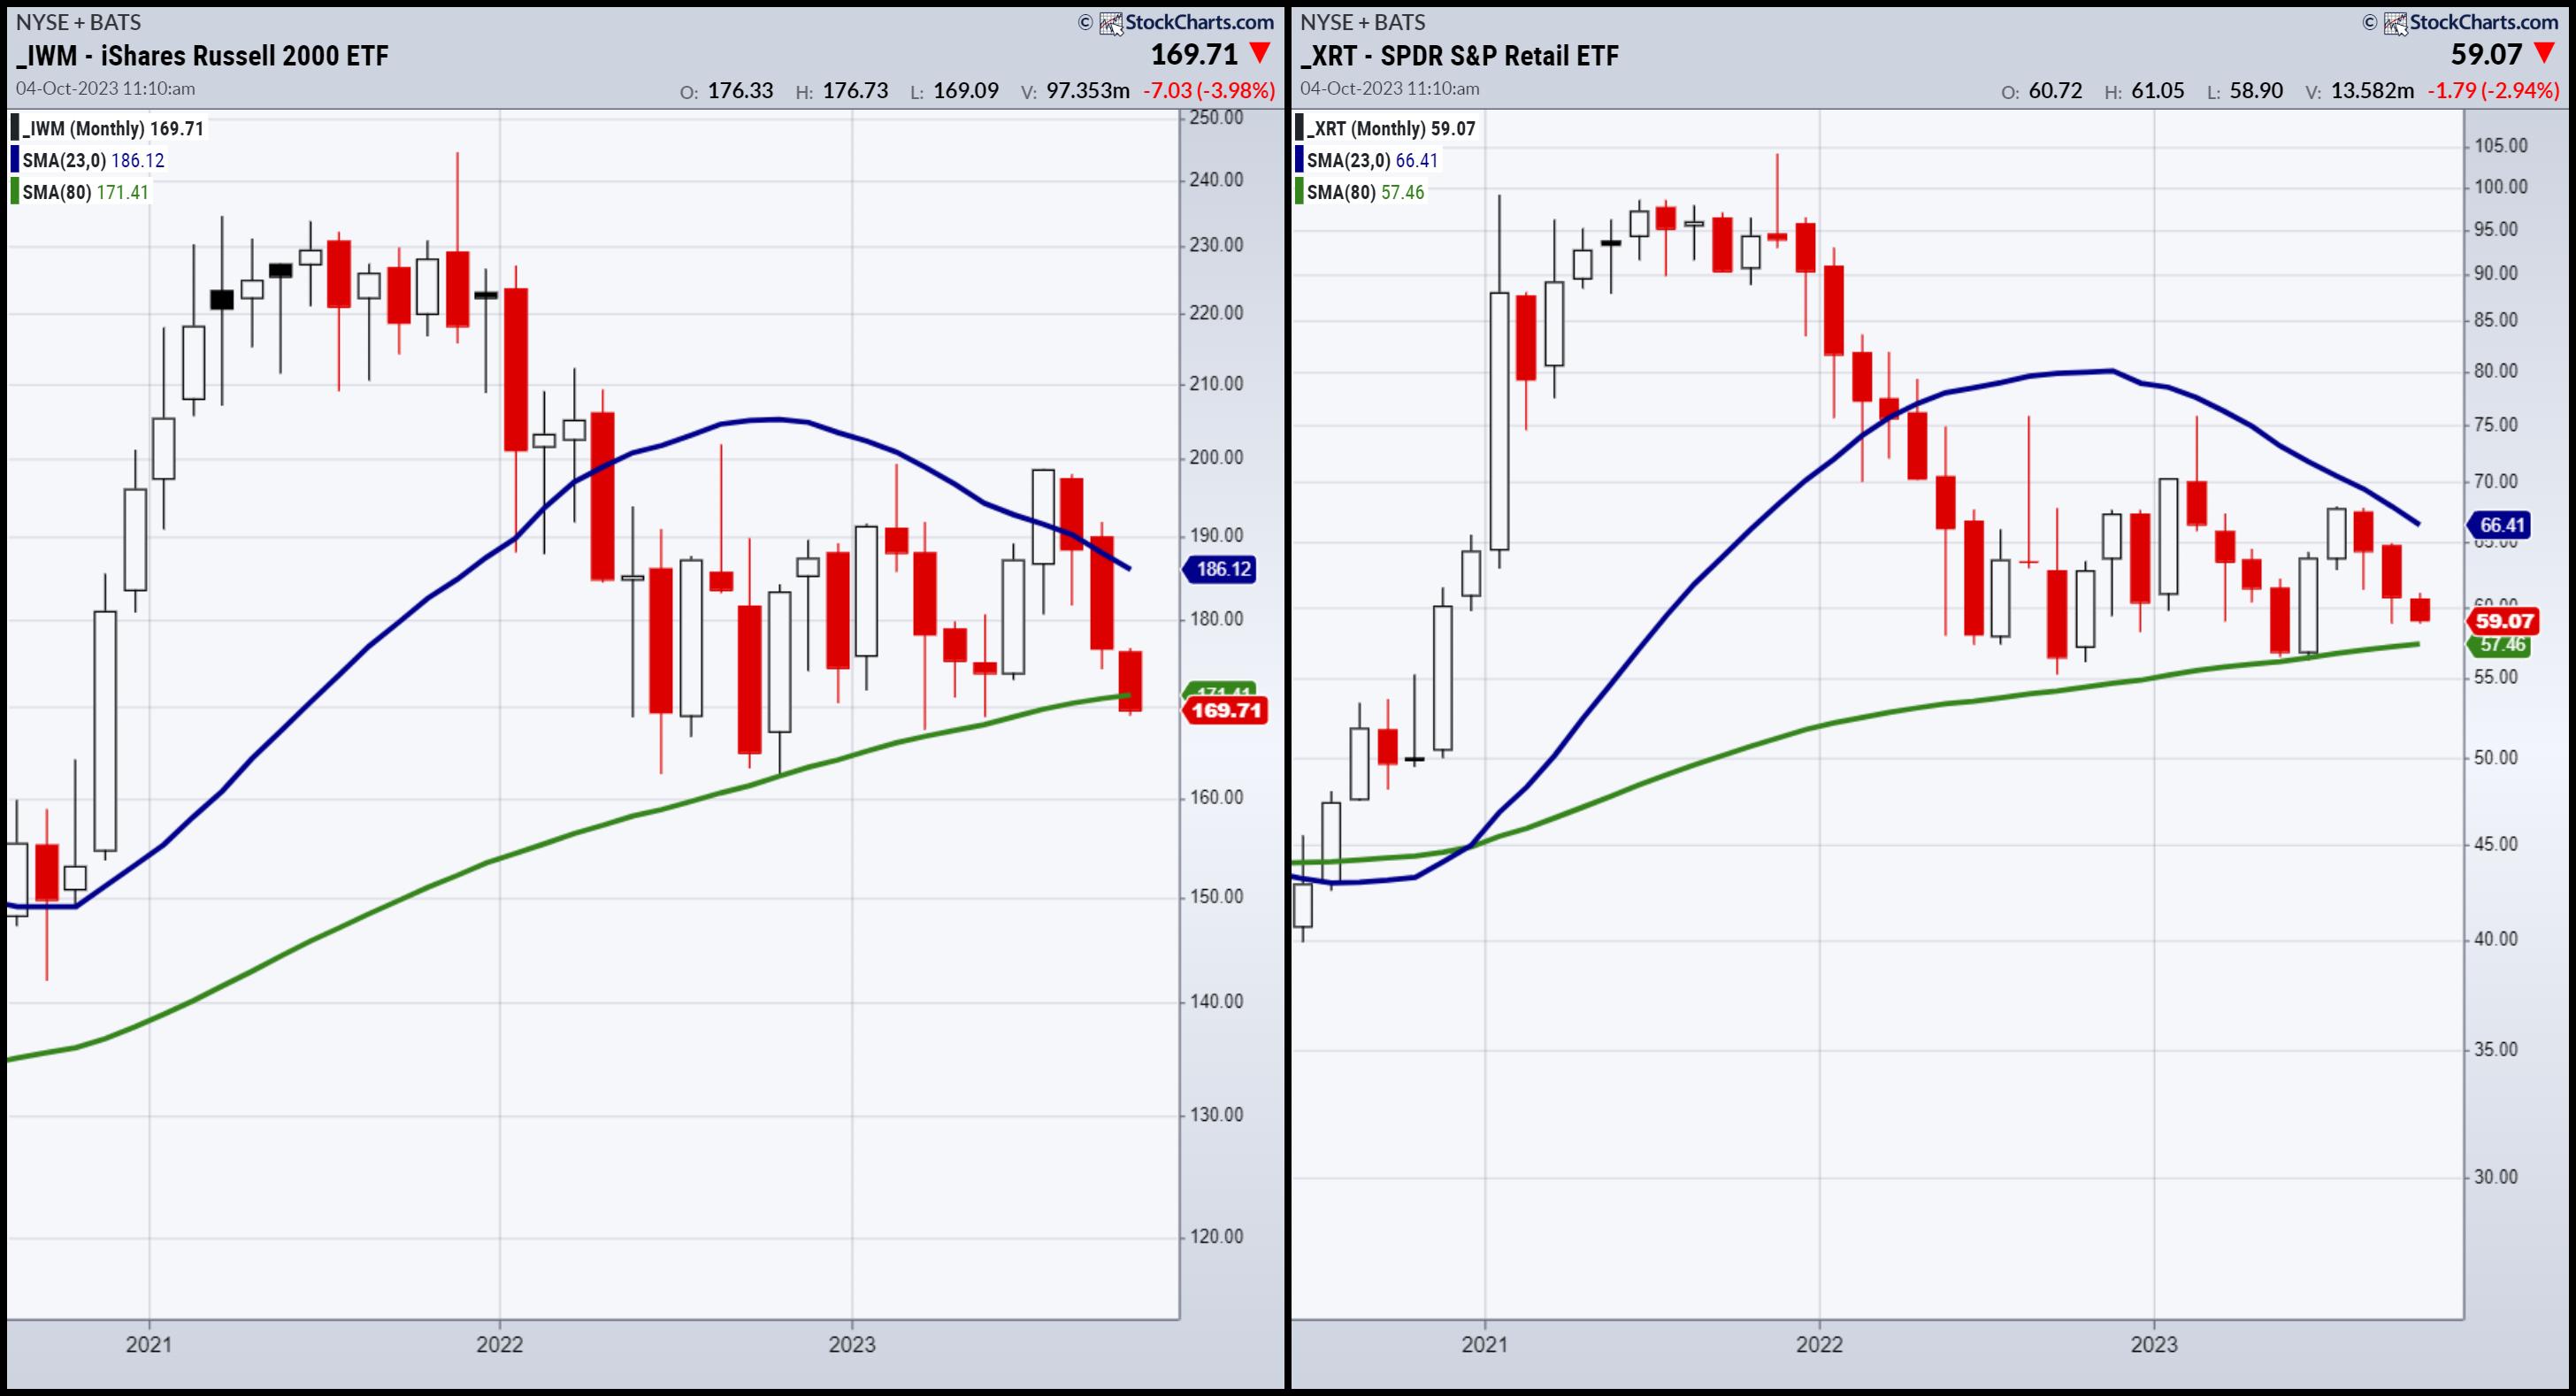
2. The next direction of the small caps and retail sectors (IWM, XRT).
3. The next direction of commodities, all of them, but particularly the agricultural ones, oil...
READ MORE
MEMBERS ONLY

Small-Caps and Retail Hold the Line in the Sand
I spent all of last week, in the media and in print, going over the importance of 2 key indicators. (See the media clips below.)
1. Our risk gauges on Big View, all of which kept flashing risk-on regardless of the doom-and-gloom and initial selloff in bonds and SPY.
2....
READ MORE
MEMBERS ONLY
The Halftime Show: What the Federal Reserve Doesn't Do, The Bond Market Does
by Pete Carmasino,
Chief Market Strategist, Chaikin Analytics
The bond market is doing what the Federal Reserve hasn't -- raising rates. The fear is something is going to break.
On this week's edition of StockCharts TV'sHalftime, Pete reviews the TLT chart again, talking over the US 2-year yield less the US 10-year...
READ MORE
MEMBERS ONLY
Watch Mish on Real Vision and More!
Yesterday, we covered the 80-month moving average in small caps and retail.
Today, I did several interviews -- some already out (BNN Bloomberg), others out soon (Financial Sense with Jim Pupluva), and the one that you'll find on YouTubelater today with Real Vision.
We chose this one to...
READ MORE
MEMBERS ONLY
3 Key Relationships to Help Assess Market Direction
If you are finding yourself fluctuating between bullishness and bearishness, then congratulations! Hopefully, that also means you are waiting for certain signals to help you commit to one way or another.
Here are the signals we are waiting for before overly committing to a bias:
1. As we wrote over...
READ MORE
MEMBERS ONLY

Risk-Neutral Market Gauges Ahead of Sunday Deadline
We do not want to walk down the political aisle. Nonetheless, what person can turn their heads away from the Sunday deadline on funding the government?
The aftermath of a shutdown will most likely include a credit downgrade for the US. Do Americans need another reason to distrust the politicos?...
READ MORE
MEMBERS ONLY
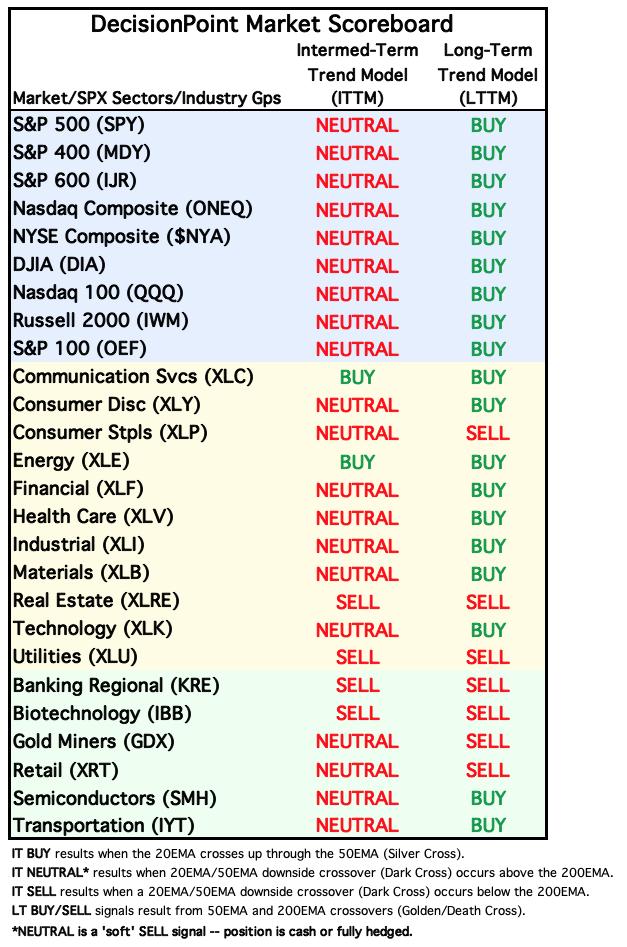
New Tables Show Intermediate-Term Overview is Negative
by Carl Swenlin,
President and Founder, DecisionPoint.com
We have introduced two new tables in the DecisionPoint ALERT to give an overview of trend and BIAS for the major market indexes, sectors, and industry groups that we track. The first is our Market Scoreboard, which shows the current Intermediate-Term and Long-Term Trend Model (ITTM and LTTM) signal status....
READ MORE
MEMBERS ONLY
Looking at Recent Market PULLBACK in a Long-Term Context & More!
by David Keller,
President and Chief Strategist, Sierra Alpha Research
In this edition of StockCharts TV'sThe Final Bar, Joe Rabil of Rabil Stock Research walks through his monthly, weekly, and daily S&P 500 charts to put the recent market pullback into proper long-term context. Host David Keller, CMT digs into breadth indicators that have turned quite...
READ MORE
MEMBERS ONLY
The Halftime Show: Fixed Income Continues To Fall, Can't Say I Didn't WARN You!
by Pete Carmasino,
Chief Market Strategist, Chaikin Analytics
Pete has been monitoring and calling out the downfall of TLT for nearly 20 months. In this week's edition of StockCharts TV'sHalftime, Pete explains why the ETF broke below $90 and how the US 10-year is over 4.5% on the same day. He dives into...
READ MORE
MEMBERS ONLY
The Halftime Show: Homebuilder and Building Product Stocks in Downtrend
by Pete Carmasino,
Chief Market Strategist, Chaikin Analytics
In this week's edition of StockCharts TV'sHalftime, Pete reviews the NVDA chart, which closed its nearest gap today. He then looks at the S&P 500 and the Nasdaq 100 charts, as well as home builder DR Horton and building products company Masco -- both...
READ MORE
MEMBERS ONLY
DP Trading Room: Mega-Caps Looking Bearish
by Erin Swenlin,
Vice President, DecisionPoint.com
by Carl Swenlin,
President and Founder, DecisionPoint.com
In this week's edition of The DecisionPoint Trading Room, Carl notes that the "Magnificent 7" stocks are looking "toppy", with only a few exceptions. These leadership stocks could put downside pressure on an already weak market. Erin picks out the strongest of the sectors...
READ MORE
MEMBERS ONLY
Three ETFs Suggest Further Downside
by David Keller,
President and Chief Strategist, Sierra Alpha Research
This past week had all the potential to see a revival of the great bull market of 2023. The September inflation data, Apple's latest product announcements, and Arm's IPO all seemed had the possibility to reignite the fire of bullishness for investors.
By Friday's...
READ MORE
MEMBERS ONLY

Timeless Lessons from the Godfather of Technical Analysis
by David Keller,
President and Chief Strategist, Sierra Alpha Research
In this edition of StockCharts TV'sThe Final Bar, Dave sits down with Ralph Acampora, CMT, co-founder of the CMT Association, for a memorable conversation on all things technical analysis. They review lessons learned from the October 2022 market low, words of wisdom for traders new to technical analysis,...
READ MORE
MEMBERS ONLY
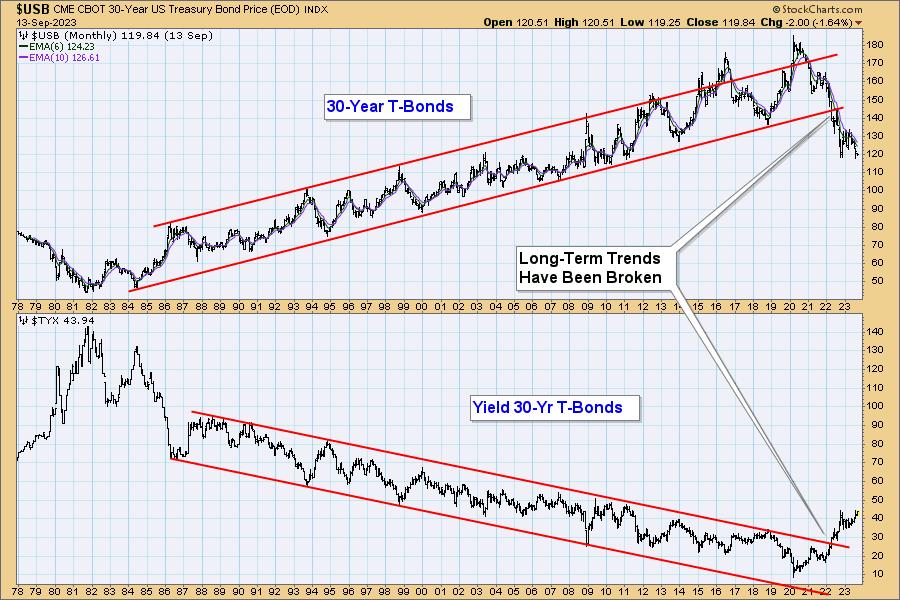
Bonds: Don't Forget the Long-Term Trend
by Carl Swenlin,
President and Founder, DecisionPoint.com
Many of the forecasts I hear regarding bonds seem to be based upon what bonds have done for most of the last 40 years, without acknowledging what has happened more recently. The chart below shows that 30-Year T-Bonds were in a rising trend from the 1982 low, but, in early...
READ MORE
MEMBERS ONLY
Fresh Look at Long Bonds
I doubt any of our readers are too surprised by the CPI reading coming in a bit hotter than expected.
The bulk of it was in energy costs. Food costs were, mixed with bread and meat, up, while eggs and milk were down. Services inflation was up slightly, while shelter...
READ MORE
MEMBERS ONLY
BONDS & CASH - But Can We Find Better Income Alternatives?
by David Keller,
President and Chief Strategist, Sierra Alpha Research
In this edition of StockCharts TV'sThe Final Bar, Dave wraps the week with a focus on weakening breadth conditions, the Russell 2000 and underperformance of small caps, and strong energy stocks driven by stronger crude oil prices. He answers viewer questions on using ETFs instead of bonds or...
READ MORE
MEMBERS ONLY

GNG TV: On the Lookout for LOVE with GoNoGo Charts

by Tyler Wood,
Co-founder, GoNoGo Charts®
As all eyes watch the Fed in anticipation of this week's Jackson Hole Summit, GoNoGo Charts help investors retain an objective, evidence-based view on what is actually happening in markets. In this edition of the GoNoGo Charts show, Tyler examines US Dollar strength (UUP) and the rally in...
READ MORE
