MEMBERS ONLY

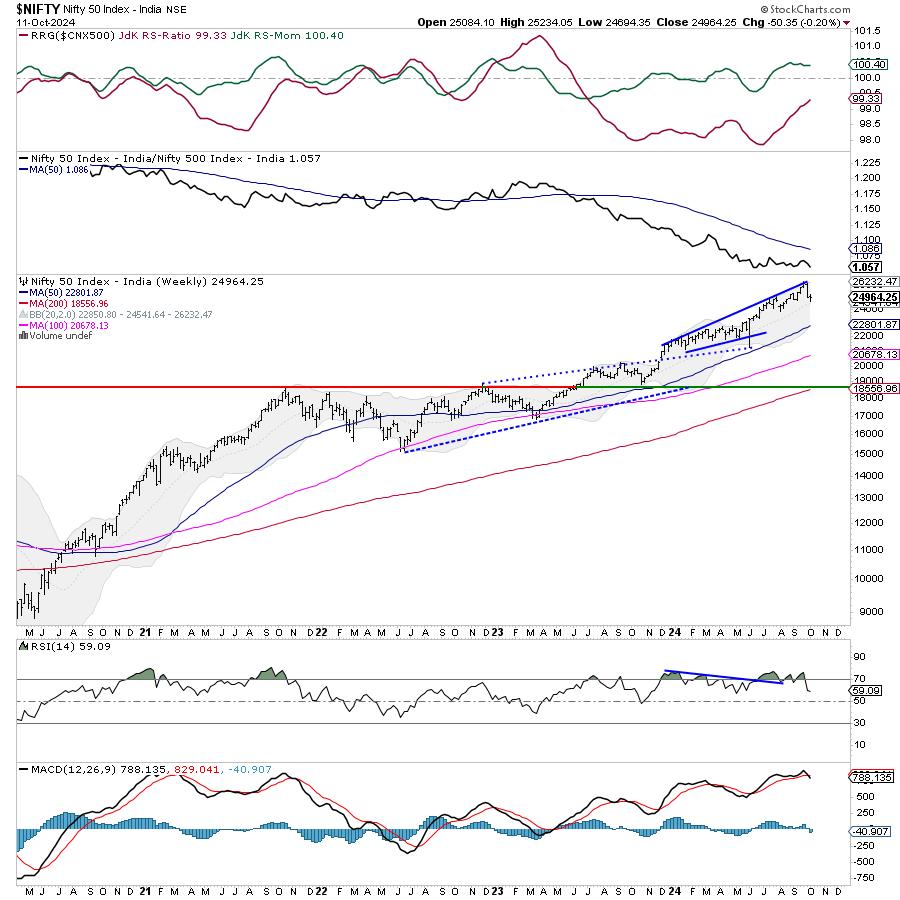
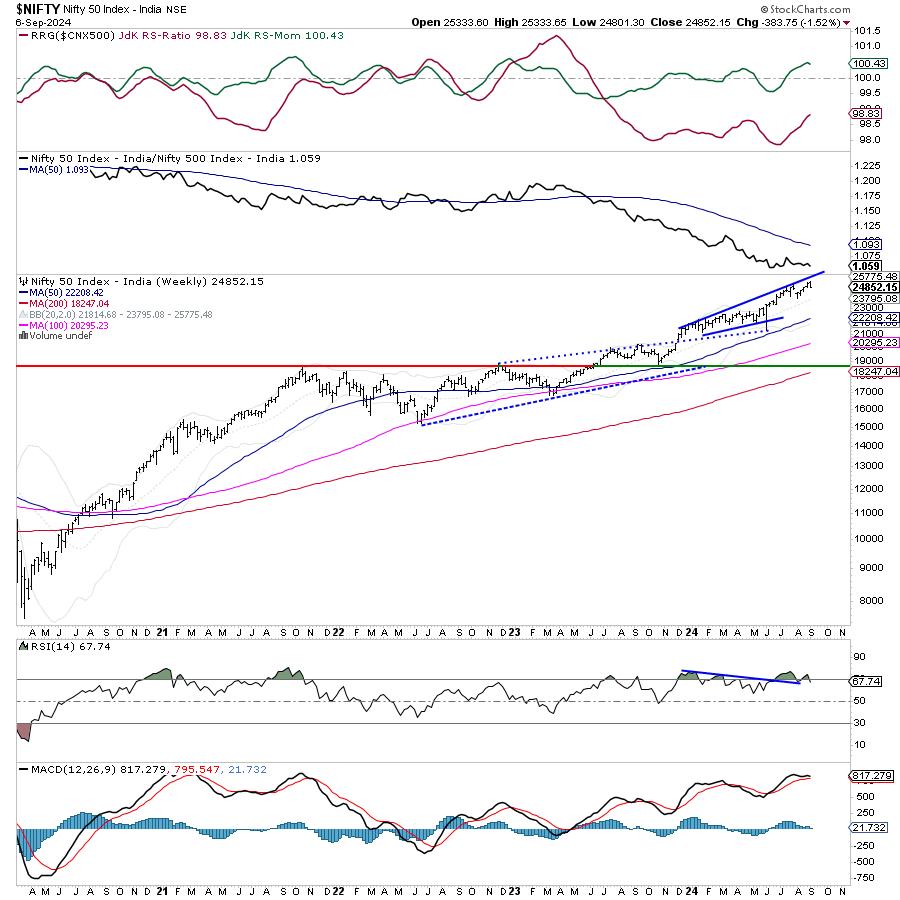
Week Ahead: NIFTY May Stay Ranged; Trending Moves to Occur Only If These Edges are Breached

by Milan Vaishnav,
Founder and Technical Analyst, EquityResearch.asia and ChartWizard.ae
The markets closed on a negative note for the third week in a row; over the past five sessions, the Nifty remained largely on a declining trajectory, except for the last trading day where it saw some relief rally from the lower levels. Following a strong weekly decline of 1167...
READ MORE
MEMBERS ONLY
Does the MACD Histogram Hold the Secret to Anticipating Trend Changes?

by David Keller,
President and Chief Strategist, Sierra Alpha Research
KEY TAKEAWAYS
* The MACD and PPO indicators are trend-following devices designed to confirm a trend reversal has occurred.
* The histogram shows when the MACD indicator is showing signs of a potential reversal, providing more of a leading indicator.
* Investors can use other indicators, such as the Chandelier Exit system, on...
READ MORE
MEMBERS ONLY

A Strong Week: Stocks, Gold, and Crypto's Robust Performance

by Jayanthi Gopalakrishnan,
Director of Site Content, StockCharts.com
KEY TAKEAWAYS
* The S&P 500 and Dow Jones Industrial Average closed at record highs.
* Gold prices are on fire, closing at a record high.
* Bitcoin breaks out of a consolidation pattern.
Despite a light economic data week, the stock market continued its rally, with the S&P...
READ MORE
MEMBERS ONLY
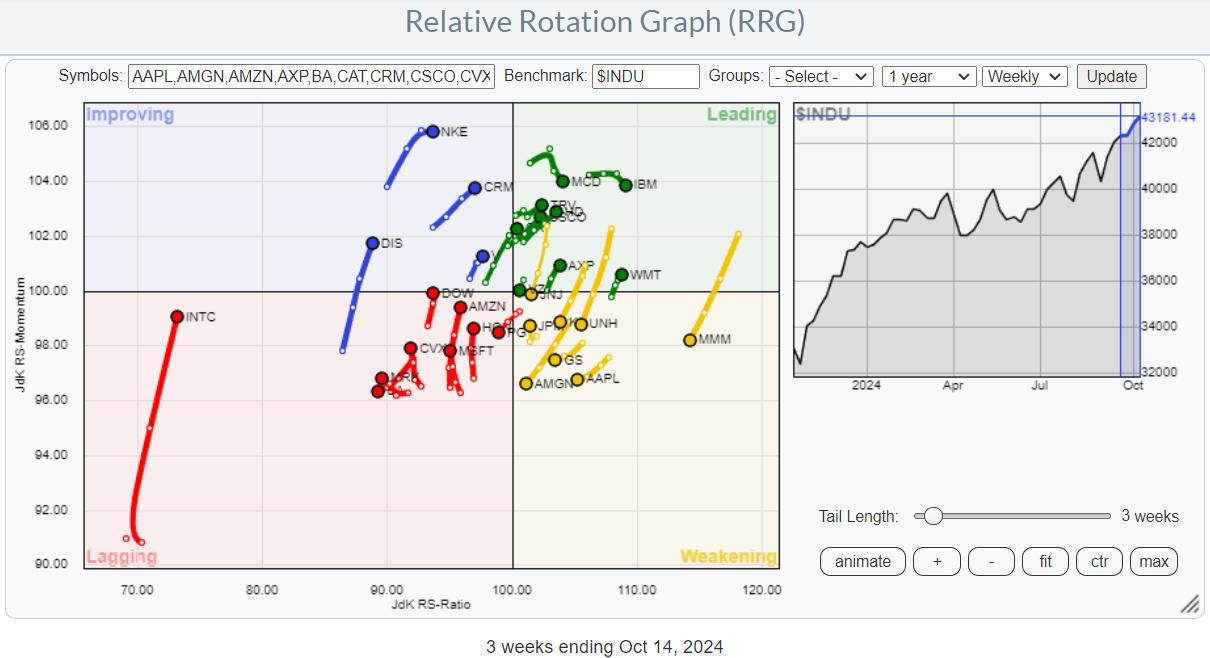
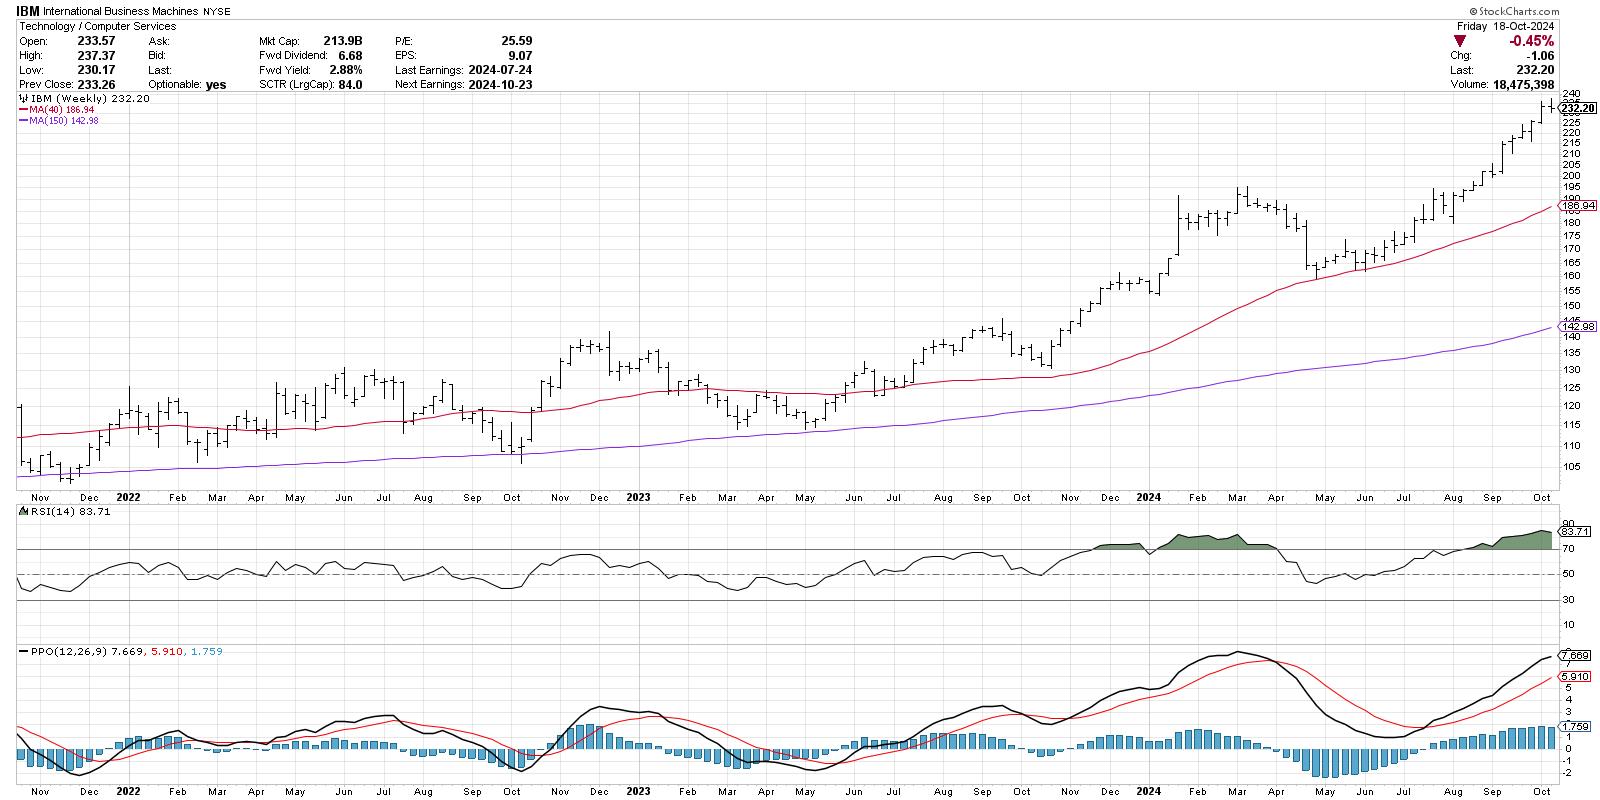
Using RRG To Find Best Three Stocks inside the DJ Industrials Index

by Julius de Kempenaer,
Senior Technical Analyst, StockCharts.com
KEY TAKEAWAYS
* Sector Rotation Model and current sector rotation are not supporting broad market strength.
* Plotting the members of $INDU on a Relative Rotation Graph helps find the best names in that universe.
* TRV, WMT, and AXP are still strong, but now have too much risk for new positions.
* CAT,...
READ MORE
MEMBERS ONLY

Disney Stock Options Strategy: A Detailed Guide to Boost Your Earnings

by Tony Zhang,
Chief Strategist, OptionsPlay
KEY TAKEAWAYS
* Disney's stock price has the potential to rise higher.
* A call vertical spread could be a viable strategy to trade Disney stock as a less expensive alternative to trading a long call.
* The long call vertical for DIS can also offset some of your risks.
Walt...
READ MORE
MEMBERS ONLY

Dell's Bullish Climb: Should You Get In Now?

by Karl Montevirgen,
The StockCharts Insider
KEY TAKEAWAYS
* Dell's stock price continues its near-term uptrend after bottoming in August.
* A cross above 70 in the SCTR line will signal increasing technical strength for Dell stock.
* Set price alerts for Dell stock so you're notified when the stock price hits a specific threshold....
READ MORE
MEMBERS ONLY

United Airlines Stock Soars: Watch For a Promising Buying Opportunity
by Jayanthi Gopalakrishnan,
Director of Site Content, StockCharts.com
KEY TAKEAWAYS
* United Airlines stock took off on solid earnings.
* UAL has broken above a consolidation pattern and is ascending to a higher altitude.
* Look for a pullback before entering a long position in UAL.
Airline stocks had a strong day, with United Airlines (UAL), American Airlines (AAL), and Delta...
READ MORE
MEMBERS ONLY

SCTR Report: American Tower is Breaking Out Now; Don't Miss It!
by Jayanthi Gopalakrishnan,
Director of Site Content, StockCharts.com
KEY TAKEAWAYS
* American Tower is a Real Estate Investment Trust (REIT) stock that's on the verge of an upside breakout.
* The weekly chart of American Tower shows clear resistance and support levels that can help identify entry points.
* Look for American Tower's stock price to reach...
READ MORE
MEMBERS ONLY

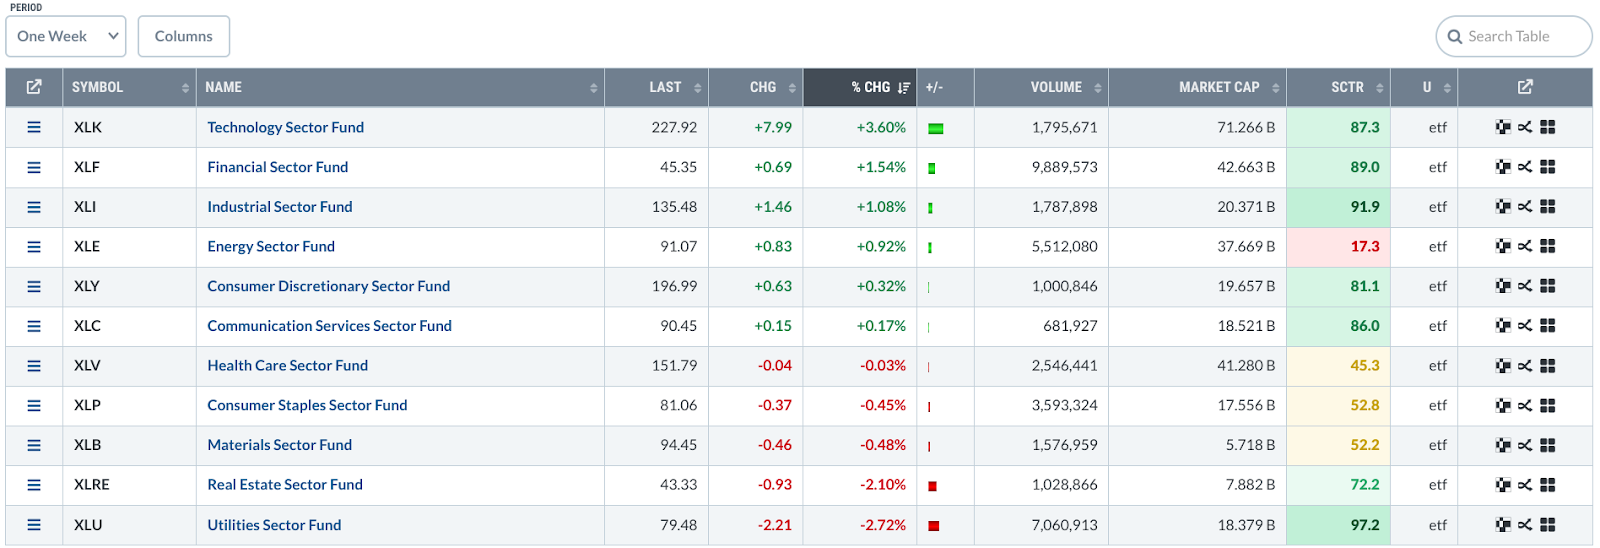
MarketCarpets: The Fastest Way to Scan for Hidden Market Opportunities
by Karl Montevirgen,
The StockCharts Insider
KEY TAKEAWAYS
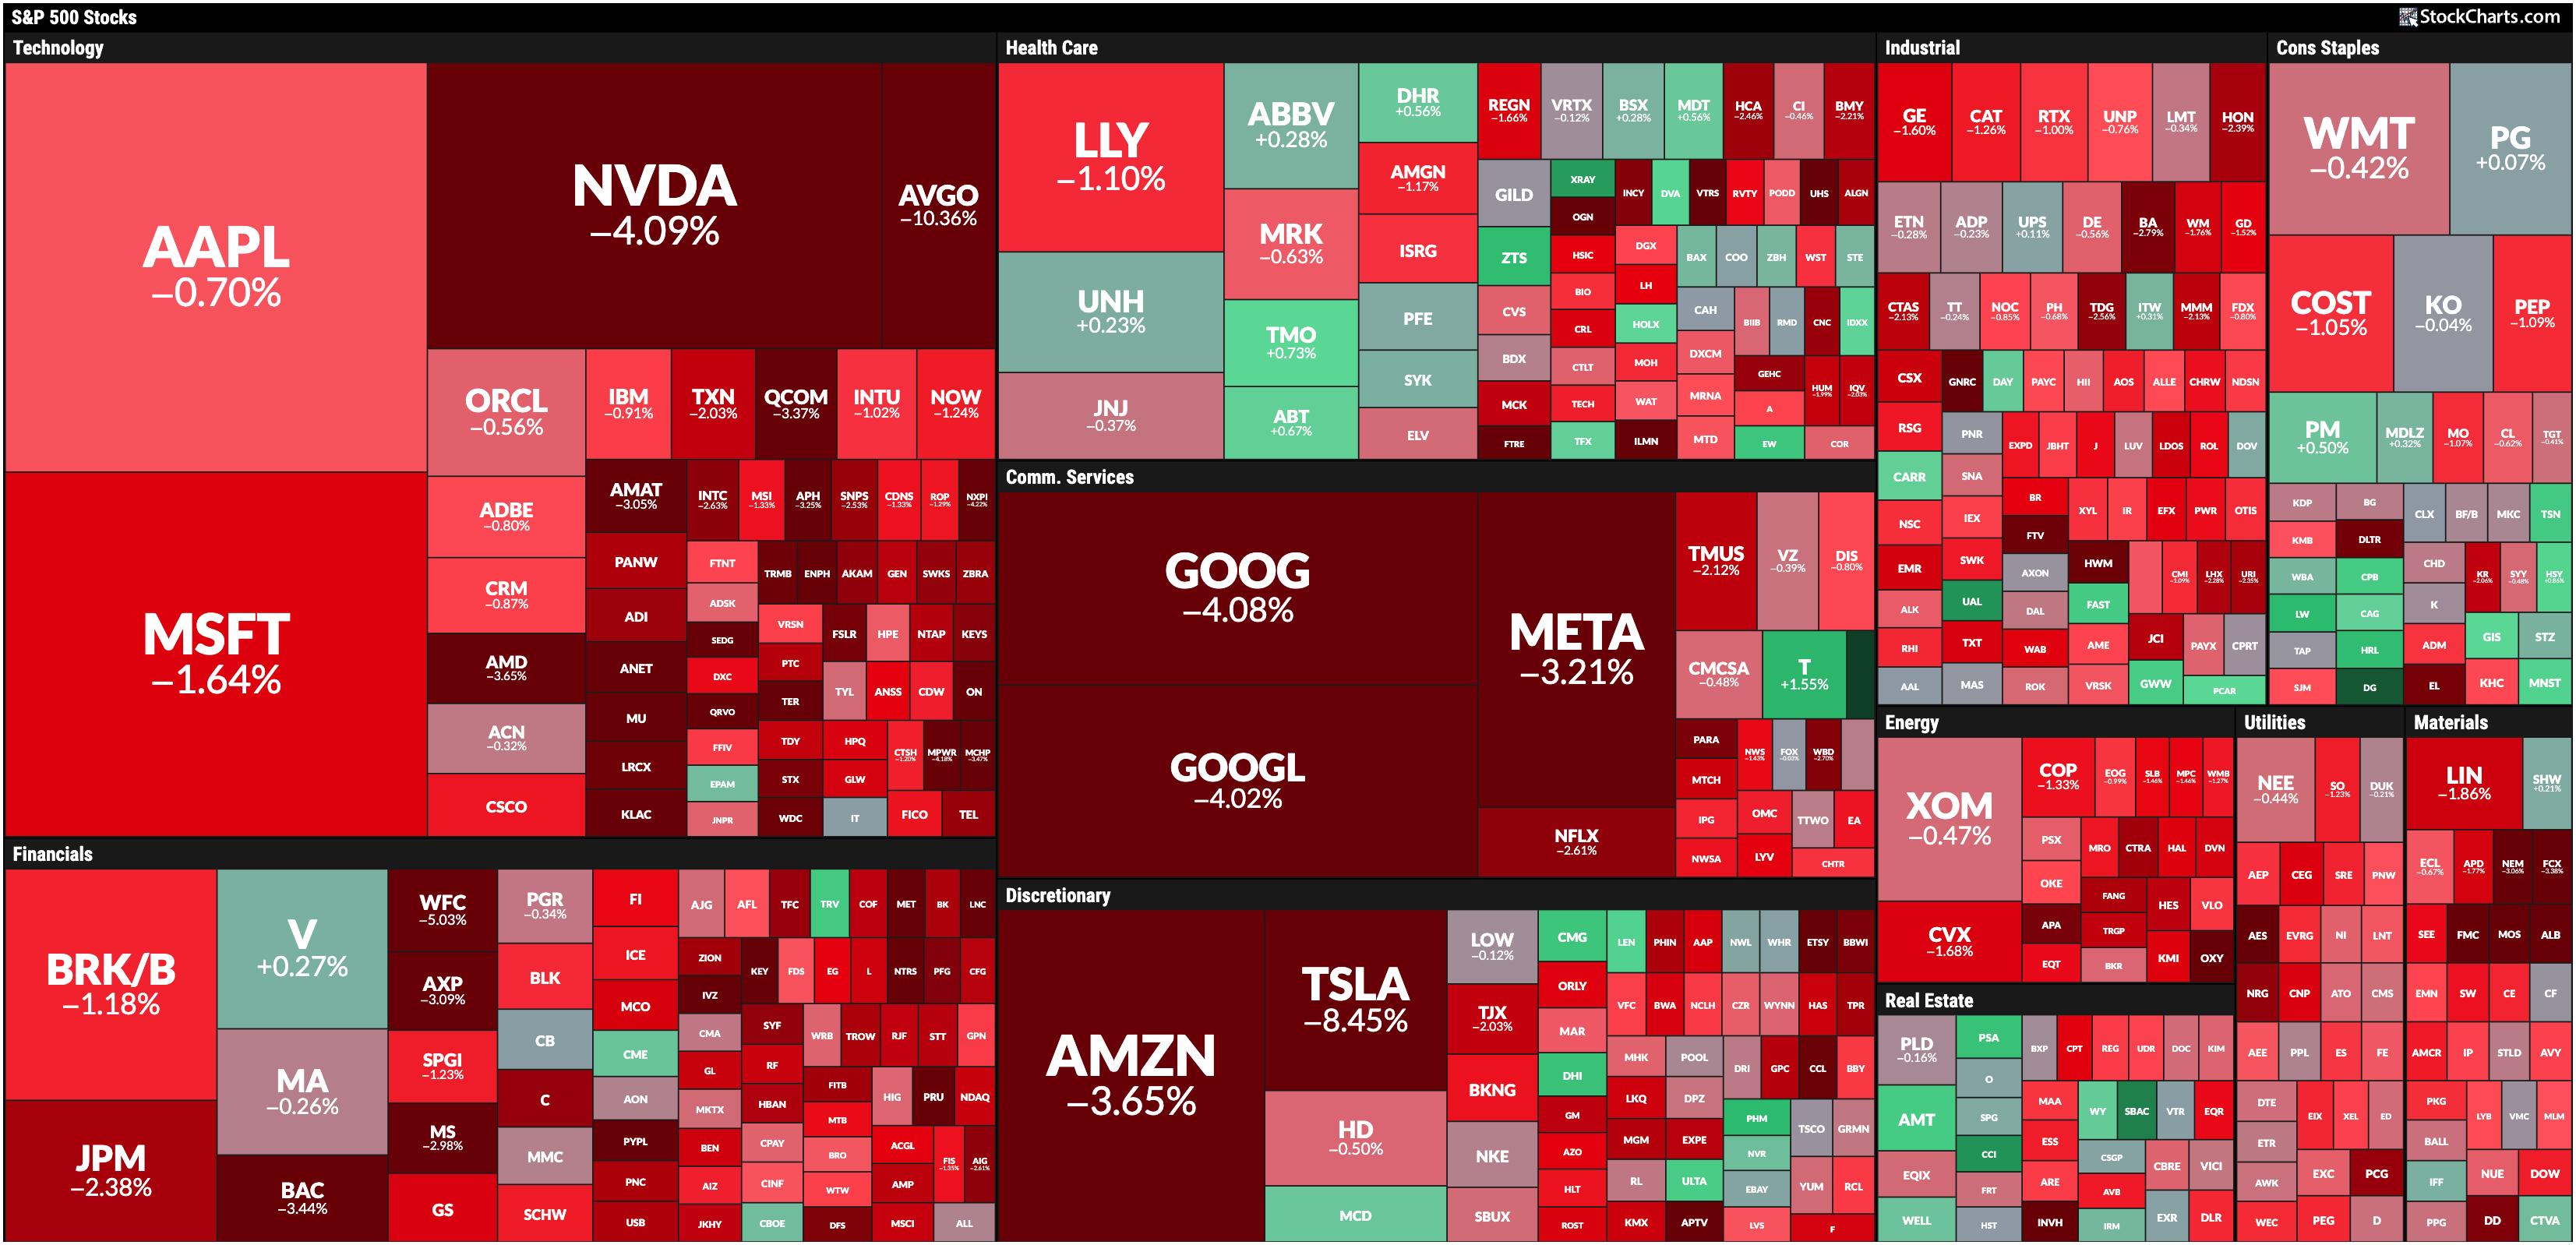
* Use the StockCharts MarketCarpets to get a fast snapshot of market trends without sifting through endless news.
* Toggle between performance and technical rankings like SCTR to find hidden opportunities.
* Make MarketCarpets part of your daily routine to catch opportunities faster than traditional methods.
When Wall Street rings its...
READ MORE
MEMBERS ONLY

DP Trading Room: NVDA Lifts Semiconductors Higher

by Erin Swenlin,
Vice President, DecisionPoint.com
It's time to put Semiconductors in the spotlight. NVDA is starting to trade at all-time highs again and that is likely to bring the Semiconductor industry group up to its own all-time highs. Erin discusses Semiconductors "under the hood" and highlights the NVDA chart.
Carl brings...
READ MORE
MEMBERS ONLY
Week Ahead: While Nifty Consolidates, Keeping Above These Levels Crucial
by Milan Vaishnav,
Founder and Technical Analyst, EquityResearch.asia and ChartWizard.ae
The week that went by was in complete contrast to the week before, as the markets heavily consolidated in a tight range. In the previous week, the Nifty had seen a significant retracement of over 1167 points; however, over the past five trading days, the index stayed totally devoid of...
READ MORE
MEMBERS ONLY
It's Large-Cap Growth Stocks (Mag 7) Once Again
by Julius de Kempenaer,
Senior Technical Analyst, StockCharts.com
KEY TAKEAWAYS
* SPY is starting to resolve its negative divergence with RSI.
* Large-cap growth is coming back into favor.
* Magnificent 7 stocks provided 2.9% of the S&P 50's 6.8% performance over the past five weeks.
Where is the Recent Performance in the S&...
READ MORE
MEMBERS ONLY
Tech vs Semiconductors: Which One Should You Be Trading?
by Karl Montevirgen,
The StockCharts Insider
KEY TAKEAWAYS
* Doing a top-down sector-to-industry analysis can be an effective way to find tradable opportunities.
* It makes sense to compare charts to see which ones are outperforming and which are underperforming.
* Get a bigger picture, drill down using relative performance indicators, and then examine specific key levels of each...
READ MORE
MEMBERS ONLY

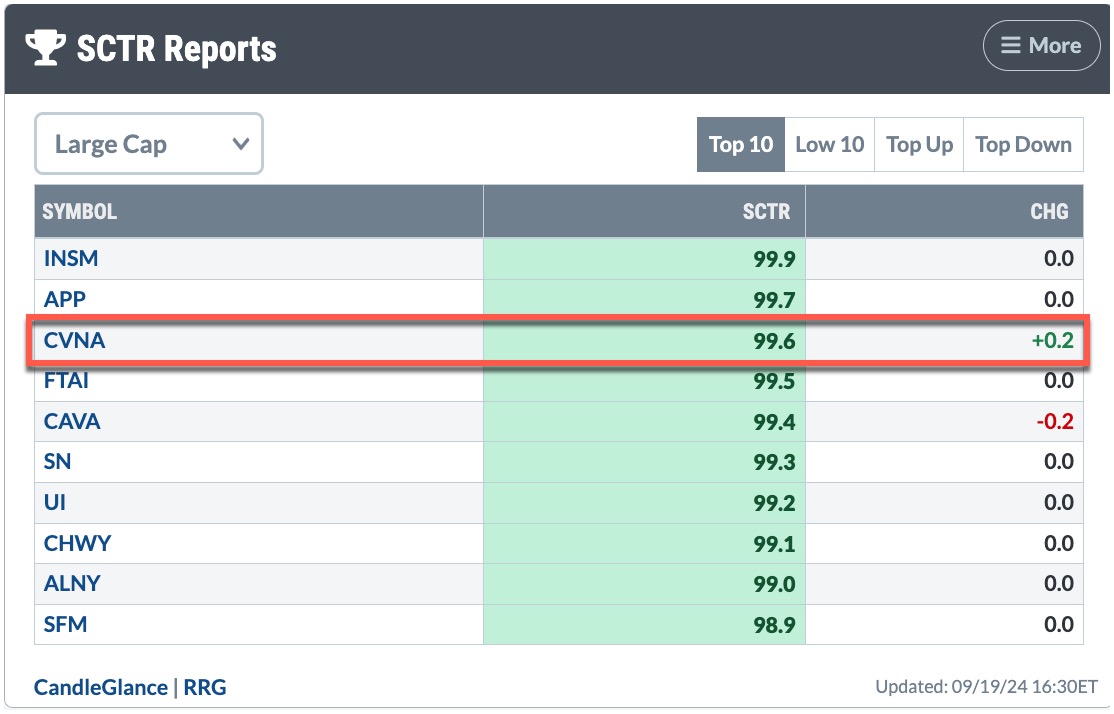
SCTR Report: Carvana Stock Skyrockets, Hits a New 52-Week High -- What This Means for Investors
by Jayanthi Gopalakrishnan,
Director of Site Content, StockCharts.com
KEY TAKEAWAYS
* Carvana stock is back on top of the Top 10 Large-Cap SCTR Report.
* If you have a long position in Carvana, monitor your positions carefully.
* The stock has the potential to rise much higher, so enjoy the ride while you can.
Apologies for revisiting Carvana (CVNA), but it...
READ MORE
MEMBERS ONLY

DP Trading Room: A Case for a Market Top
by Erin Swenlin,
Vice President, DecisionPoint.com
During today's market analysis Carl laid out his reasons why we believe we are at a market top. He discusses the current market price action combined with exclusive DecisionPoint indicators to substantiate his position. Don't miss his analysis.
Carl also goes though the Magnificent Seven by...
READ MORE
MEMBERS ONLY

Week Ahead: Putting Market Moves in Perspective; Watch Nifty From This Angle
by Milan Vaishnav,
Founder and Technical Analyst, EquityResearch.asia and ChartWizard.ae
On the back of one of the major FII selloffs seen in recent times, the markets succumbed to strong corrective pressure through the week and ended on a very weak note. The Nifty 50 remained under selling pressure; at no point in time did it show any intention to stage...
READ MORE
MEMBERS ONLY

Stocks Soar, Energy Prices Spike: Are Geopolitical Tensions to Blame?
by Jayanthi Gopalakrishnan,
Director of Site Content, StockCharts.com
KEY TAKEAWAYS
* The macro picture of the US economy remains strong with the broader equity indexes in an uptrend.
* There has been some rotation in the sectors with Energy taking the lead as a result of rising crude oil prices.
* Use the StockCharts MarketCarpet to select stocks for your ChartLists....
READ MORE
MEMBERS ONLY

SCTR Report: Vistra Energy Soars, Reaches New All-Time High
by Jayanthi Gopalakrishnan,
Director of Site Content, StockCharts.com
KEY TAKEAWAYS
* Vistra Energy can be a big player in providing nuclear power to AI companies.
* Vistra Energy's stock price has hit an all-time high.
* There are support levels on the daily price chart that could present buying opportunities in VST.
Utility stocks are now becoming cool. Going...
READ MORE
MEMBERS ONLY

DP Trading Room: Uncovering Stocks from DP Scan Alerts
by Erin Swenlin,
Vice President, DecisionPoint.com
In today's free DecisionPoint Trading Room, Erin pulls out her exclusive DecisionPoint Diamond Scans and finds us some new and interesting stock symbols to explore further. These scans are very powerful and bring the best charts to your attention. DecisionPoint has a new Scan Alert System for purchase...
READ MORE
MEMBERS ONLY

Stock Market Regains Bullish Edge: Can Geopolitical Tensions Change Its Direction?
by Jayanthi Gopalakrishnan,
Director of Site Content, StockCharts.com
KEY TAKEAWAYS
* The stock market got an influx of positive news, bringing bullish momentum.
* The Dow Jones Industrial Average closed at a record high on Friday.
* Investors are rotating out of mega-cap tech stocks and into other areas such as precious metals, as well as China-related stocks and ETFs.
There&...
READ MORE
MEMBERS ONLY

Top Ten Charts to Watch for October 2024
by David Keller,
President and Chief Strategist, Sierra Alpha Research
As we near the end of what has been a fairly solid Q3 for the equity markets, we are left with the eternal question for investors: "What's next?"
We now have the Fed's first rate cut in the rearview mirror, with multiple rate cuts...
READ MORE
MEMBERS ONLY

This Week's "Sector to Watch" and "Industry Group to Watch"
by Erin Swenlin,
Vice President, DecisionPoint.com
On Friday mornings in our DP Diamonds subscriber-only trading room, the DecisionPoint Diamond Mine, I like to look for a "Sector to Watch" and an "Industry Group to Watch" within. These are for your watchlist and not necessarily ready for immediate investment. In the case of...
READ MORE
MEMBERS ONLY

Opportunities in Industrials and Materials
by Julius de Kempenaer,
Senior Technical Analyst, StockCharts.com
KEY TAKEAWAYS
* Negative divergence remains a distracting factor
* Defensive rotation still present
* Industrials and Materials on positive track toward leading RRG quadrant
Despite a backdrop of conflicting market signals, there are still sectors within the S&P 500 that are showing promising movements and potential opportunities for investors. Today,...
READ MORE
MEMBERS ONLY

China Stimulus Energizes Stocks, Commodities; Will The Energy Sink?
by Jayanthi Gopalakrishnan,
Director of Site Content, StockCharts.com
KEY TAKEAWAYS
* Stocks, commodities, and crypto prices soared after China announced its stimulus package, but pulled back slightly after the news.
* Metal prices are still holding strong while oil prices pulled back.
* Escalating geopolitical tensions don't seem to be impacting the stock market much at the moment.
Tuesday&...
READ MORE
MEMBERS ONLY

DP Trading Room: Analyzing Two New Stocks in SP500 (DELL, PLTR)
by Erin Swenlin,
Vice President, DecisionPoint.com
In today's free DP Trading Room Carl reviews the charts of two new members to the SP500, Dell (DELL) and Palantir (PLTR). Are they poised to break out on this news?
Carl also discussed the inflation on housing prices to open the show. Before going over the signal...
READ MORE
MEMBERS ONLY

Strategy After Rate Cuts: Best Areas to BUY!

by Mary Ellen McGonagle,
President, MEM Investment Research
In this StockCharts TV video, Mary Ellen reviews the broader markets after last week's rate-cut induced rally. She also shares stocks that are breaking out of bases and poised to trade higher. The "nuclear renaissance" is also discussed, as well as stocks that will benefit the...
READ MORE
MEMBERS ONLY

Dow Jones in the Spotlight, Bonds Stabilize, Tech Plays Catch-Up
by Jayanthi Gopalakrishnan,
Director of Site Content, StockCharts.com
KEY TAKEAWAYS
* The Dow Jones Industrial Average closed at a new all-time high.
* Stock market indexes still have bullish momentum in spite of up and down movement.
* Bond prices could stabilize after digesting the interest rate cut.
The Federal Reserve's interest rate cut decision on Wednesdaywas like receiving...
READ MORE
MEMBERS ONLY

A Sector Rotation Dilemma ...
by Julius de Kempenaer,
Senior Technical Analyst, StockCharts.com
KEY TAKEAWAYS
* Sector Rotation remains defensive
* S&P chart showing resemblence to late 2021
* Negative divergences still in play
First of all, I apologize for my absence this week. I caught something that looked like Covid, and felt like Covid, but it did not identify (pun intended) as Covid....
READ MORE
MEMBERS ONLY
The SCTR Report: Carvana's Gain Makes It Worth a Revisit
by Jayanthi Gopalakrishnan,
Director of Site Content, StockCharts.com
KEY TAKEAWAYS
* Carvana stock fell behind in its ranking during its August–September pullback, but it's now gaining momentum.
* From a weekly perspective, the uptrend in Carvana looks solid.
* Watch the Fibonacci retracement levels on the weekly chart to identify your entry and exit points.
On August 5,...
READ MORE
MEMBERS ONLY

Stock Market Today: Fed Cuts Rates and Market Makes Last Minute U-Turn
by Jayanthi Gopalakrishnan,
Director of Site Content, StockCharts.com
KEY TAKEAWAYS
* The Fed cut interest rates by 50 basis points and shifts focus to the economy.
* Stock market rallied after the Fed's interest rate cut decision but closed lower.
* Treasury yields rose while bond prices fell.
The stock market received what it expected from the Federal Reserve—...
READ MORE
MEMBERS ONLY

DP Trading Room: Tracking Gold Sentiment
by Erin Swenlin,
Vice President, DecisionPoint.com
As part of Carl's review of Gold charts, he explained how we use the close-ended fund, Sprott Physical Gold Trust (PHYS) to measure sentiment for Gold. Depending on how PHYS trades, it trades at a discount or premium based on the physical Gold that it holds. These discounts...
READ MORE
MEMBERS ONLY

A Half Point Fed Rate Cut? The Stock Market Thinks So
by Jayanthi Gopalakrishnan,
Director of Site Content, StockCharts.com
KEY TAKEAWAYS
* Stocks make a strong recovery after last week's selloff.
* Large-, mid-, and small-cap stocks closed higher, with small caps the clear leader.
* Gold and silver prices surged on interest rate cut expectations.
This week's stock market action may have caught many investors by surprise....
READ MORE
MEMBERS ONLY

A Déjà Vu in The Consumer Staples Sector Sends a Strong Warning Signal
by Julius de Kempenaer,
Senior Technical Analyst, StockCharts.com
KEY TAKEAWAYS
* Tech bounce is judged as recovery within downtrend.
* XLP, XLF, and XLV are positioned for outperformance in coming weeks.
* The XLP chart is showing interesting characteristics which we have seen before
Tech Rallies, But Remains Inside the Lagging Quadrant
A quick look at the Relative Rotation Graph for...
READ MORE
MEMBERS ONLY
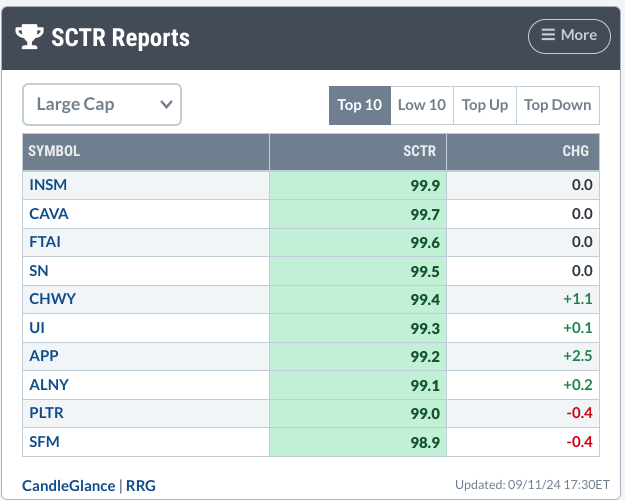
The SCTR Report: Insmed's Stock Hangs in the Balance—Here's What You Need to Know
by Karl Montevirgen,
The StockCharts Insider
KEY TAKEAWAYS
* Insmed (INSM) has been near the top of the StockCharts SCTR report for weeks.
* Insmed's stock price has pulled back, but maintained its high SCTR score.
* Insmed could be posed for an upside move.
Numerous companies are making strides within their respective sectors, but, unless you...
READ MORE
MEMBERS ONLY

DP Trading Room: AI Bubble Deflating
by Erin Swenlin,
Vice President, DecisionPoint.com
The recent decline last week revealed that the artificial intelligence bubble is deflating. Magnificent Seven stocks are unwinding in response to investors losing confidence in the AI trade in general. Carl gives us a complete picture of the Magnificent Seven in the short and intermediate terms. It doesn't...
READ MORE
MEMBERS ONLY
Week Ahead: NIFTY Shows Early Signs of a Likely Disruption of Uptrend; Tread Cautiously
by Milan Vaishnav,
Founder and Technical Analyst, EquityResearch.asia and ChartWizard.ae
After initially forming a fresh incremental lifetime high, the markets succumbed to selling pressure from higher levels after spending some indecisive sessions during the week. The week that went by saw some early signs of the Nifty entering into broad corrective consolidation while ending near its low point of the...
READ MORE
MEMBERS ONLY
Broad-Based Stock Market Selloff: How to Position Your Portfolio?
by Jayanthi Gopalakrishnan,
Director of Site Content, StockCharts.com
KEY TAKEAWAYS
* Broader stock market indexes sell off as investors fear rate cuts may be too late.
* Treasury yields fell to their lowest yearly levels.
* Big Tech stocks got hammered, with semiconductor stocks getting hit the hardest.
After a week of wavering action, the stock market made a directional move—...
READ MORE
MEMBERS ONLY

The SCTR Report: Why TSLA Stock Sees Tremendous Strength
by Jayanthi Gopalakrishnan,
Director of Site Content, StockCharts.com
KEY TAKEAWAYS
* Tesla's stock price has been gaining technical strength, evident from its daily and weekly price charts.
* An analysis of Tesla's stock price shows a potential intermediate-term trading opportunity.
* Before entering a buy position, be sure to identify your entry and exit positions.
When the...
READ MORE
MEMBERS ONLY

How to Spot a Hedge Fund Trap: MicroStrategy's Dramatic Plunge
by Karl Montevirgen,
The StockCharts Insider
KEY TAKEAWAYS
* In March 2024, certain hedge funds began heavily shorting MicroStrategy stock.
* Microstrategy was a meme stock that surged 300% from February to March.
* While many investors got burned when Microstrategy's price tanked, there were clues that short sellers were taking over the stock.
In early 2024,...
READ MORE
MEMBERS ONLY
Week Ahead: Uptrend Stays Intact for NIFTY; RRG Shows Distinctly Defensive Setup
by Milan Vaishnav,
Founder and Technical Analyst, EquityResearch.asia and ChartWizard.ae
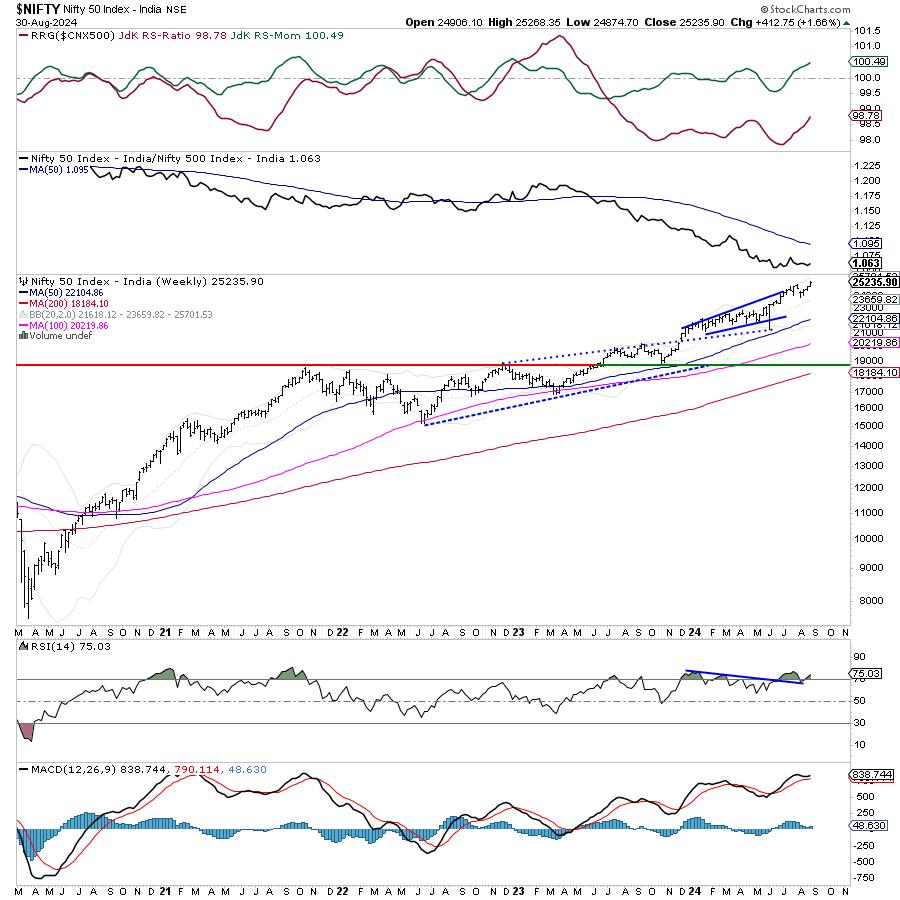
The past session for the markets stayed quite trending, as the headline index continued with its upward move. While extending its gains, the Nifty 50 Index ended the week on a very strong note. Witnessing a strong momentum on the upside, the market expanded its trading range as well. The...
READ MORE