MEMBERS ONLY
NVDA SCREAMS BULL With Earnings Breakout

by David Keller,
President and Chief Strategist, Sierra Alpha Research
In this edition of StockCharts TV'sThe Final Bar, Dave identifies key resistance levels for QQQ and HYG, along with a technical analysis downtrend checklist for charts in confirmed bear phases. Guest Larry Tentarelli of Blue Chip Daily Trend Report shares two stocks he's tracking along with...
READ MORE
MEMBERS ONLY
3 Unique RSI Techniques to Maximize Your Investments

by Joe Rabil,
President, Rabil Stock Research
On this week's edition of Stock Talk with Joe Rabil, Joe dives into the world of technical analysis by sharing three unique ways to utilize the RSI indicator alongside MACD and ADX -- the Pullback Trade, Confirming a Breakout and 2nd Chance Entry. He then covers the symbol...
READ MORE
MEMBERS ONLY

Emerging Markets Getting Closer to a Breakout

by Martin Pring,
President, Pring Research
Last November I asked the question "Are emerging markets about to emerge?"Using the iShares MSCI Emerging Markets ETF (EEM) as our benchmark, I concluded that more strength was needed in order to push the indicators into a bullish mode. In the intervening period, things have improved, but...
READ MORE
MEMBERS ONLY
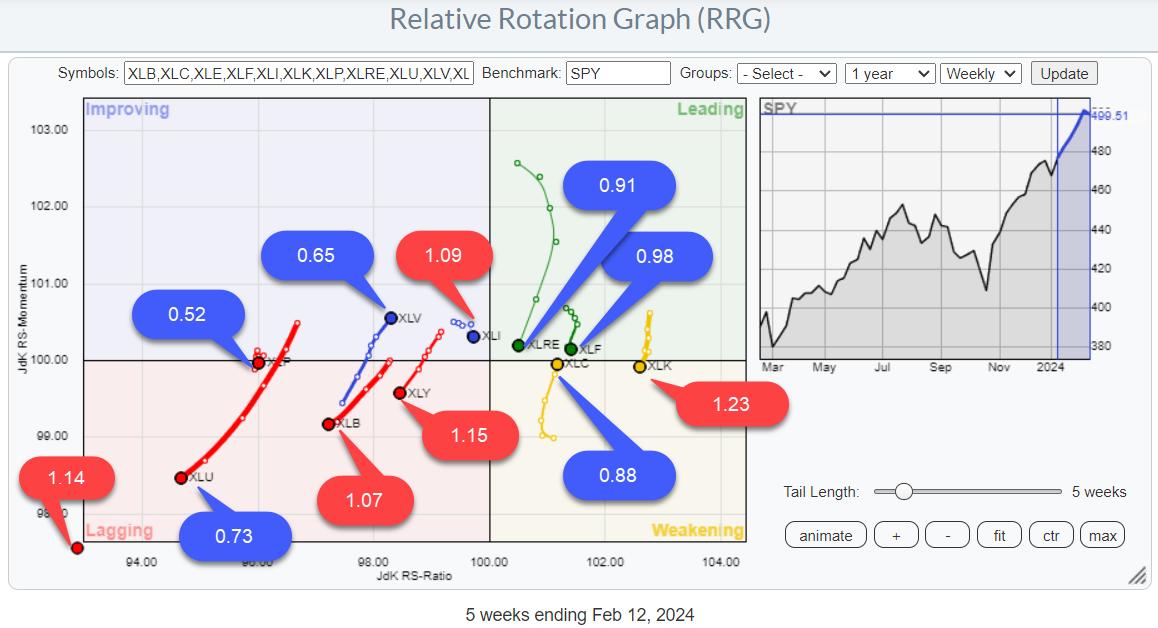
SPY Uptrend Intact, But Mixed Sector Rotation Signals Hesitation

by Julius de Kempenaer,
Senior Technical Analyst, StockCharts.com
KEY TAKEAWAYS
* Looking at Risk ON / OFF through BETA
* RRG shows mixed rotations
* SPY Uptrend intact with limited downside risk
BETA
One of the Risk ON/OFF metrics I like to keep an eye on is BETA.
From Investopedia:
—systematic risk—
I have updated my spreadsheet with last year'...
READ MORE
MEMBERS ONLY
MEM TV: Risk-On Trades Emerge Amid Big Tech Selloff

by Mary Ellen McGonagle,
President, MEM Investment Research
In this episode of StockCharts TV'sThe MEM Edge, Mary Ellen reviews the sloppy week for the markets, driven by the key economic data that was released. We saw interest rates rise, which had some other carry-on impact. While the S&P 500 saw a bit of a...
READ MORE
MEMBERS ONLY

The Halftime Show: Inflation Back in the Driver's Seat

by Pete Carmasino,
Chief Market Strategist, Chaikin Analytics
Yesterday, the market saw a massive selloff of over 2% at market lows for the SPY and the NDX. However, the rebound at the end of the day was promising, though not enough to change sentiment. What this means is that the selloff came from the hot CPI print, so...
READ MORE
MEMBERS ONLY
S&P 500 Plunges Below 5K!
by David Keller,
President and Chief Strategist, Sierra Alpha Research
In this edition of StockCharts TV'sThe Final Bar, Dave shows how the S&P 500 is just barely holding trendline support as his short-term Market Trend Model threatens to turn bearish this week. Guest Sean McLaughlin of All Star Charts talks through how he's playing...
READ MORE
MEMBERS ONLY

Catch BIGGER GAINS by Fishing for Alpha
by David Keller,
President and Chief Strategist, Sierra Alpha Research
In this edition of StockCharts TV'sThe Final Bar, Dave highlights breakouts in home builders and Bitcoin and reviews key names reporting earnings including ABNB, SHOP, and MAR. He also shares an equity scan he uses every week to identify the next potential breakout candidates. Stay tuned until the...
READ MORE
MEMBERS ONLY
MEM TV: Best Way To Participate in Stronger Areas of The Market
by Mary Ellen McGonagle,
President, MEM Investment Research
In this episode of StockCharts TV'sThe MEM Edge, Mary Ellen reviews why the markets continue to hit new highs while also highlighting which areas are driving this strength. She then shares a low-risk, simple way to participate in the uptrend among these stronger areas.
This video originally premiered...
READ MORE
MEMBERS ONLY
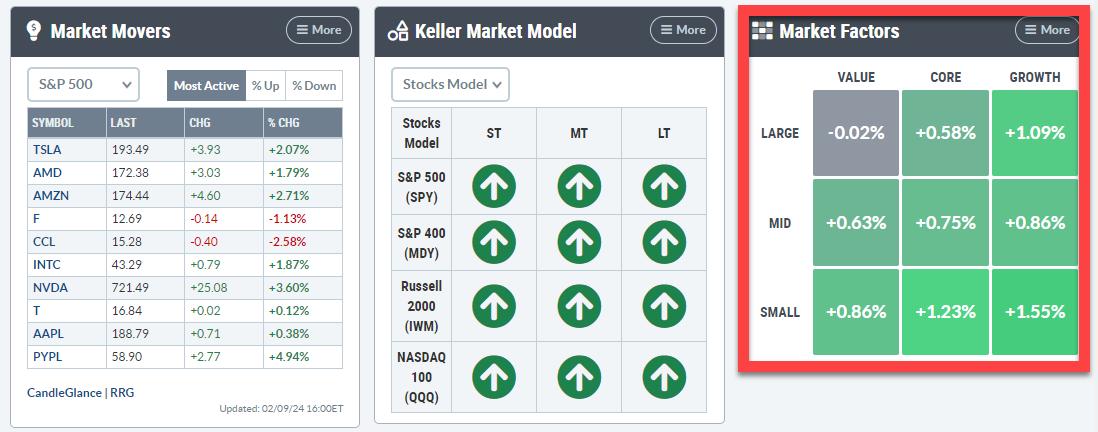
Visualizing the Market Factors Panel on RRG
by Julius de Kempenaer,
Senior Technical Analyst, StockCharts.com
KEY TAKEAWAYS
* Bring the New Market Factors Panel to a Relative Rotation Graph
* Same approach using different index family shows a different image
With the release of the new Panels feature on the StockCharts dashboard, there are a lot of ways that users of RRG charts can take advantage! Let&...
READ MORE
MEMBERS ONLY

Your Questions, Answered! Price Gaps, Bull Flags, Inverse Patterns, and MORE
by David Keller,
President and Chief Strategist, Sierra Alpha Research
In this edition of StockCharts TV'sThe Final Bar, Dave digs into The Final Bar Mailbag and answers questions on price patterns like bull flags, what price gaps actually represent on the chart, and why analyzing earnings trends could help you anticipate subsequent moves for stocks like META.
This...
READ MORE
MEMBERS ONLY
Master Momentum Using Price Swings and Fibonacci Grids
by Joe Rabil,
President, Rabil Stock Research
On this week's edition of Stock Talk with Joe Rabil, Joe discusses how he uses the price swings and Fibonacci grid to determine the momentum of a trend without the use of indicators. He explains how indicators can lag at reversal points and why we need to lean...
READ MORE
MEMBERS ONLY
Market Breadth Divergence Says NO BULL!
by David Keller,
President and Chief Strategist, Sierra Alpha Research
In this edition of StockCharts TV'sThe Final Bar, Dave demonstrates how the market's recent upswing has left mid-caps and small-caps in the dust, with deteriorating breadth conditions suggesting an increased risk of downside for the S&P 500. He also unveils the latest enhancements to...
READ MORE
MEMBERS ONLY

Only a Fool Would Try to Call a Correction in a Bull Market, So Here Goes!
by Martin Pring,
President, Pring Research
The vast majority of the primary trend indicators are pointing to a bull market and have been doing so for the better part of a year. Chart 1, for instance, shows that NYSE Margin Debt, or rather its long-term KST, has only recently gone bullish. The vertical lines point out...
READ MORE
MEMBERS ONLY
MEM TV: Here's How to Trade Gaps Up After Earnings!
by Mary Ellen McGonagle,
President, MEM Investment Research
In this episode of StockCharts TV'sThe MEM Edge, Mary Ellen reviews the market's recovery from Fed Chair Powell's comments on Wednesday, sharing exactly what drove the S&P 500 to new highs. She also reviews the sector rotation that's taking place,...
READ MORE
MEMBERS ONLY

Deciphering Gold's (GLD) Signals: Is Now the Time to Go Long on Gold?

by Karl Montevirgen,
The StockCharts Insider
KEY TAKEAWAYS
* The robust jobs data triggered a sell-off in the gold market, hampering expectations of an imminent rate cut
* Price projections for GLD in 2024 span a wide spectrum, below and above current prices because of fluctuating macroeconomic and geopolitical dynamics
* The Volume-by-Price indicator is especially useful in recognizing...
READ MORE
MEMBERS ONLY
The Halftime Show: Fed Stays Put, Bond Markets Rally!
by Pete Carmasino,
Chief Market Strategist, Chaikin Analytics
Uncertainty needs attention in order for it to make you second guess yourself. Instead, wait for trends to change, and then make changes. On this week's edition ofStockCharts TV'sHalftime, Pete Carmasino goes over some thoughts on interest rates and when the Fed will finally cut. He...
READ MORE
MEMBERS ONLY

Mastering MACD: The Fly-By Pattern
by Joe Rabil,
President, Rabil Stock Research
On this week's edition of Stock Talk with Joe Rabil, Joe discusses key aspects to MACD when viewed as an oscillator rather than a momentum indicator. He also explains how to use MACD combination signals as well as combining with the ADX indicator. He then covers the symbol...
READ MORE
MEMBERS ONLY
Will Catalysts Push Markets HIGHER or Drag Them LOWER?
by David Keller,
President and Chief Strategist, Sierra Alpha Research
In this edition of StockCharts TV'sThe Final Bar, Dave tracks the S&P 500 as it pushes to a new high above 4900, while the McClellan Oscillator rotates to a bullish reading. He breaks down earnings plays this week, including XOM, MSFT, and more.
This video originally...
READ MORE
MEMBERS ONLY
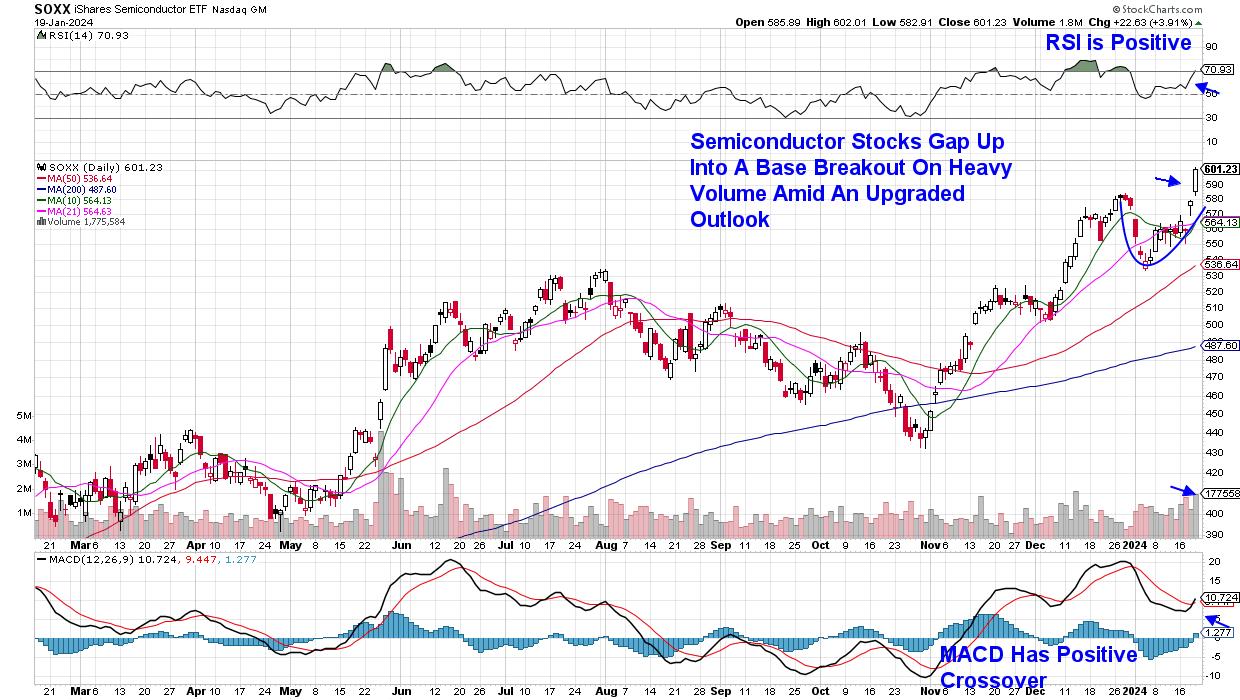
MEM TV: Market Uptrend Endures Ahead of BIG Earnings Next Week!
by Mary Ellen McGonagle,
President, MEM Investment Research
In this episode of StockCharts TV'sThe MEM Edge, Mary Ellen reviews where the markets stand as we head into earnings from MSFT, GOOGL, AAPL and META. She also discusses how ETFs can help you refine your trading strategies and stock selection, then shares base breakouts and downtrend reversal...
READ MORE
MEMBERS ONLY

Is This a Breakout or a Pullback?

by TG Watkins,
Director of Stocks, Simpler Trading
On this week's edition of Moxie Indicator Minutes, TG points out that the IWM is right in the middle of a range and he wants to hear from you as to which way you think it will go first. Beyond that, the overall picture of the market is...
READ MORE
MEMBERS ONLY

Inflation Fell to the Fed's Target -- Or is That a Moving Target?
On Friday, the market woke up to great news. Mission accomplished on inflation.
Yahoo Finance reported: "The Fed's preferred inflation measure — a 'core' Personal Consumption Expenditures index that excludes volatile food and energy prices — clocked in at 2.9% for the month of December, beating...
READ MORE
MEMBERS ONLY

Macro Model Gives Mixed Signals as NFLX LIGHTS UP!
by David Keller,
President and Chief Strategist, Sierra Alpha Research
In this edition of StockCharts TV'sThe Final Bar, guest John Kosar, CMT of Asbury Research shares his proprietary Asbury Six macro model, which suggests caution based on weak fund flows and breadth conditions. Dave focuses in on crude oil and gold charts, and also reviews key earnings plays...
READ MORE
MEMBERS ONLY

Economic Modern Family Has Divisive Weekly Charts
Over the weekend, I covered the daily charts on the Economic Modern Family, featuring the Russell 2000 (IWM) and Retail (XRT). Both are lagging the benchmark and in the middle of their January trend calendar ranges.
As Semiconductors, NASDAQ, the Dow, and S&P 500 continue to post new...
READ MORE
MEMBERS ONLY

Small Caps Surge Higher As S&P 500 Stalls
by David Keller,
President and Chief Strategist, Sierra Alpha Research
In this edition of StockCharts TV'sThe Final Bar, Dave observes the S&P 500 index pressing higher after achieving new all-time highs on Friday. While large caps have dominated small caps so far in January, days like today suggest small-cap strength as a potential emerging trend. He...
READ MORE
MEMBERS ONLY
Don't Ignore This Unusual Event on the Market's March to New Highs
by Mary Ellen McGonagle,
President, MEM Investment Research
The S&P 500 gained 1.1% last week in a move that puts this Index at a record high. While this is exciting news for investors, those that owned some of last week's top performers are in even better spirits, as the average gain for the...
READ MORE
MEMBERS ONLY

Tech and Semis Leading from the Dip
by TG Watkins,
Director of Stocks, Simpler Trading
The market was severely overbought going into the new year, so some steam was left off, which, as TG Watkins notes, we can see in the breadth readings. Now with notable names in the tech space leading and taking off, its time to get back in and see if the...
READ MORE
MEMBERS ONLY
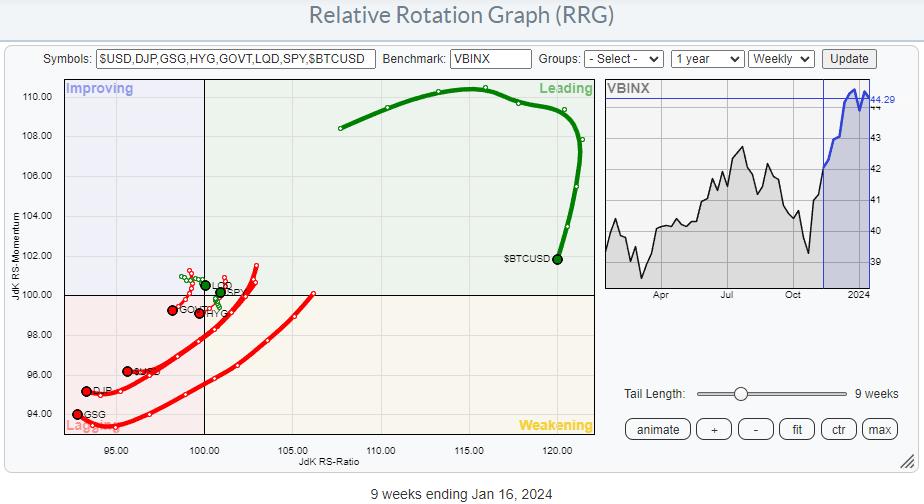
Watch Stocks Triumph in Latest Asset Allocation Battle
by Julius de Kempenaer,
Senior Technical Analyst, StockCharts.com
KEY TAKEAWAYS
* Commodities and USD rotating deep inside the lagging quadrant, indicating weak relative strength
* Bitcoin is in a strong relative uptrend vs all other asset classes, but going through a corrective phase
* Stocks are the clear winner in this asset allocation battle
The RRG above shows the rotation of...
READ MORE
MEMBERS ONLY

GNG TV: Active vs. Passive Investing

by Alex Cole,
Co-founder, GoNoGo Charts®

by Tyler Wood,
Co-founder, GoNoGo Charts®
As the S&P 500 digests the rally to all time highs, Alex and Tyler take a look at GoNoGo Trend® conditions of several areas of the market on this edition of the GoNoGo Charts show. Amongst US equity indices, the Nasdaq and S&P offer more constructive...
READ MORE
MEMBERS ONLY

Utilities' Unique Seasonal Powers: The Best Months to Invest
by Karl Montevirgen,
The StockCharts Insider
KEY TAKEAWAYS
* The Utilities sector has periods of cyclical outperformance
* Seasonality charts in StockCharts can identify which months Utilities are likely to outperform
* Analyzing a price chart of the XLU ETF can help time your entries so they coincide with seasonal patterns
The Utilities sector is known as a defensive...
READ MORE
MEMBERS ONLY

The Biggest Mistake Traders Make!
by Joe Rabil,
President, Rabil Stock Research
On this week's edition of Stock Talk with Joe Rabil, Joe explains the number one mistake he sees traders make. He shows how both day traders and swing traders can get so laser-focused that they miss key components necessary for a successful trade; he then discusses why he...
READ MORE
MEMBERS ONLY

View The Large Cap - Small Cap Debate in a Direct Comparison on RRG
by Julius de Kempenaer,
Senior Technical Analyst, StockCharts.com
KEY TAKEAWAYS
* Using RRG to see Large-Cap vs Small-Cap sector rotation
* The current strength for Small-Cap stocks vs Large-Caps is evident
At the end of last year, I wrote a blog article about the relationship between Large-Cap and Equal-Weight sectors. It involved plotting the ratios of the large-cap sector ETFs...
READ MORE
MEMBERS ONLY

Sector Spotlight: RRG Showing Strong Rotation For Stocks in All Time Frames
by Julius de Kempenaer,
Senior Technical Analyst, StockCharts.com
KEY TAKEAWAYS
* Stocks Showing Relative Strength in All Time Frames on RRG
On this episode of StockCharts TV's Sector Spotlight, 2024's first episode, I dive into both Asset Class and Sector Rotation to set the stage for 2024. Today, I focus on a synchronized rotation of...
READ MORE
MEMBERS ONLY

MEM TV: The Easy Way to Uncover Stocks Poised to Outperform
by Mary Ellen McGonagle,
President, MEM Investment Research
In this episode of StockCharts TV'sThe MEM Edge, Mary Ellen takes a look at some of the items that drove price action last week. Growth stocks came roaring back for week two of 2024, which is great news for those that were believers last year. They can renew...
READ MORE
MEMBERS ONLY

Is the Market Ready for Another Dip?
by TG Watkins,
Director of Stocks, Simpler Trading
On this week's edition of Moxie Indicator Minutes, TG points out how the market is still digesting the big move from the November/December run. It ran a huge sprint, and now needs to cycle down in order to create room for the next leg up. The internals...
READ MORE
MEMBERS ONLY

Drilling Down Into Gold and Silver
With the news on geopolitical escalation, soft versus hard landing, disinflation versus reinflation, growth versus value, and credit default versus available disposable income, gold and silver are even more interesting now.
Gold's behavior has been more of sell strength and buy weakness for some time. What has changed...
READ MORE
MEMBERS ONLY

GNG TV: Nothing "CRYPTIC" About These Go Trends!
by Alex Cole,
Co-founder, GoNoGo Charts®
by Tyler Wood,
Co-founder, GoNoGo Charts®
As the SEC approved spot Bitcoin ETFs Wednesday, investors in a broad basket of cryptocurrencies witnessed strengthening Go trends and substantial advances in trends which took hold in October 2023. In this edition of the GoNoGo Charts show, Alex and Tyler review current trends across asset classes and sector groups....
READ MORE
MEMBERS ONLY

XLV's Record Rally: The Must-Know Investment Move of the Year
by Karl Montevirgen,
The StockCharts Insider
KEY TAKEAWAYS
* The Healthcare Select SPDR ETF XLV has seen a 16% rise from its October low and is showing upside momentum
* Seasonal patterns in XLV show that July and November are the strongest months in terms of returns and higher close rates
* Combining seasonality patterns and technical indicators shows...
READ MORE
MEMBERS ONLY

From Selloff to Surge: Growth Stocks Rebound After CPI
by David Keller,
President and Chief Strategist, Sierra Alpha Research
In this edition of StockCharts TV'sThe Final Bar, Dave highlights three leading growth stocks continuing to push to new swing highs. He also breaks down key market sentiment indicators, including the VIX, AAII survey, NAAIM Exposure Index, Rydex fund flows, and put/call ratios.
This video originally premiered...
READ MORE
MEMBERS ONLY

Markets: Recap of This Week's Market Dailies
I began the week focused on bank earnings, which we will wake up to tomorrow. In that Daily, I wrote, "one can assume that bank stocks, which already started off the year extremely well, have potential to shine.
"However, we know that assumptions can be tricky. There are...
READ MORE
