MEMBERS ONLY

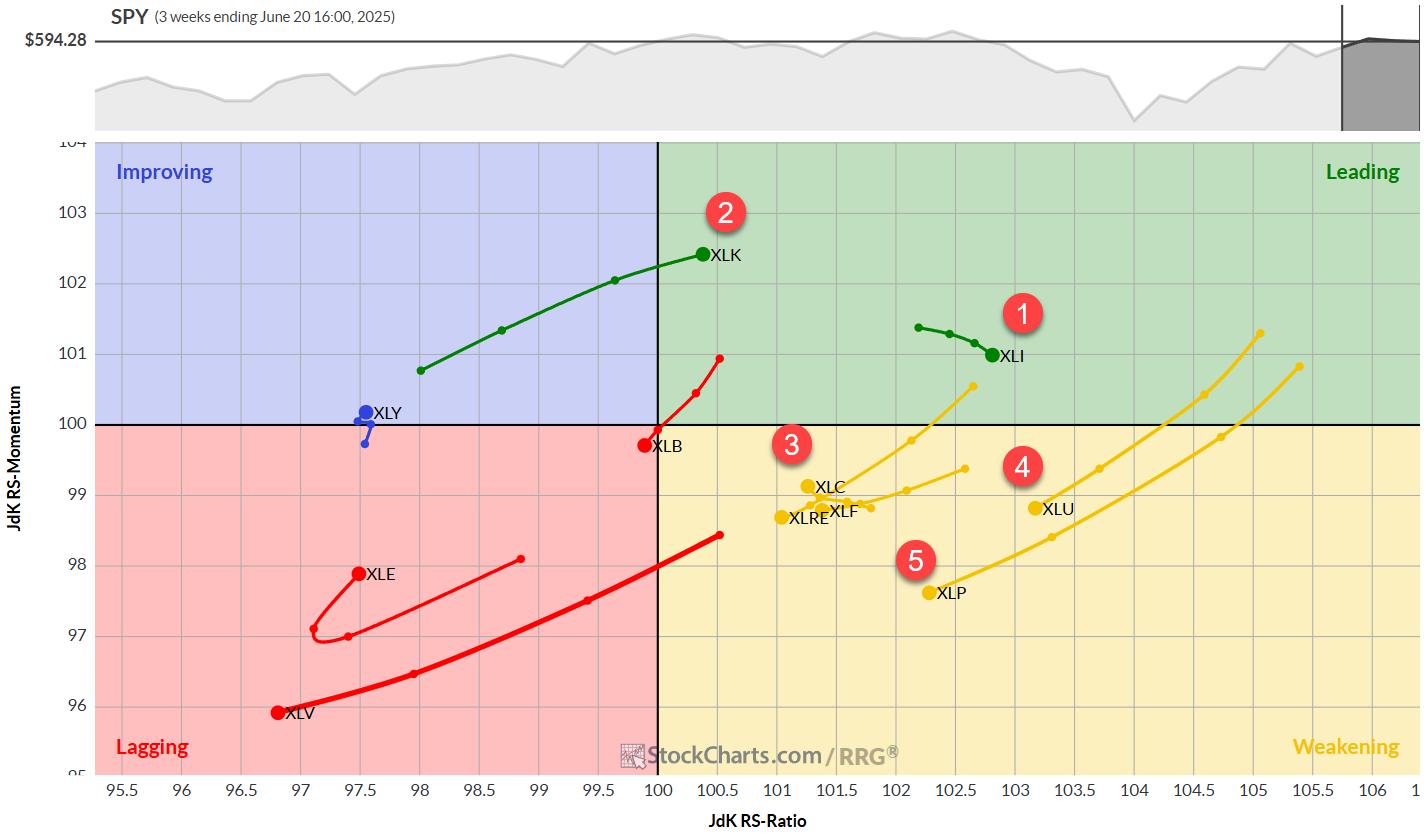
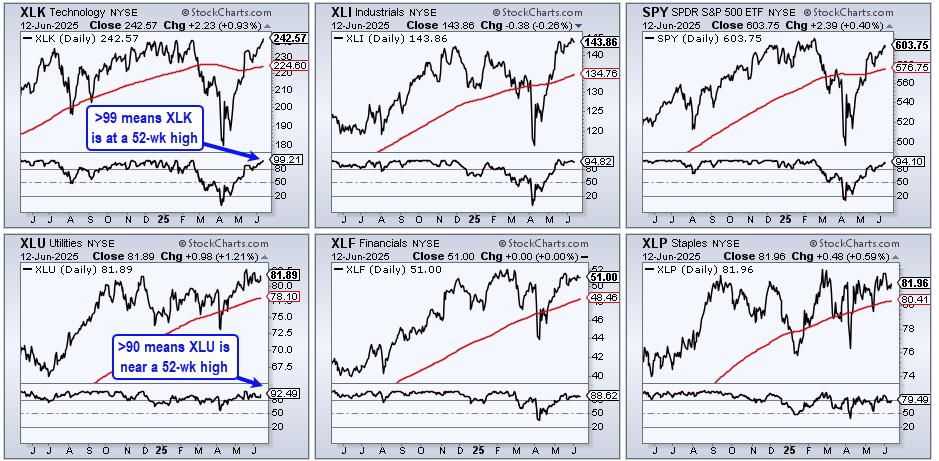
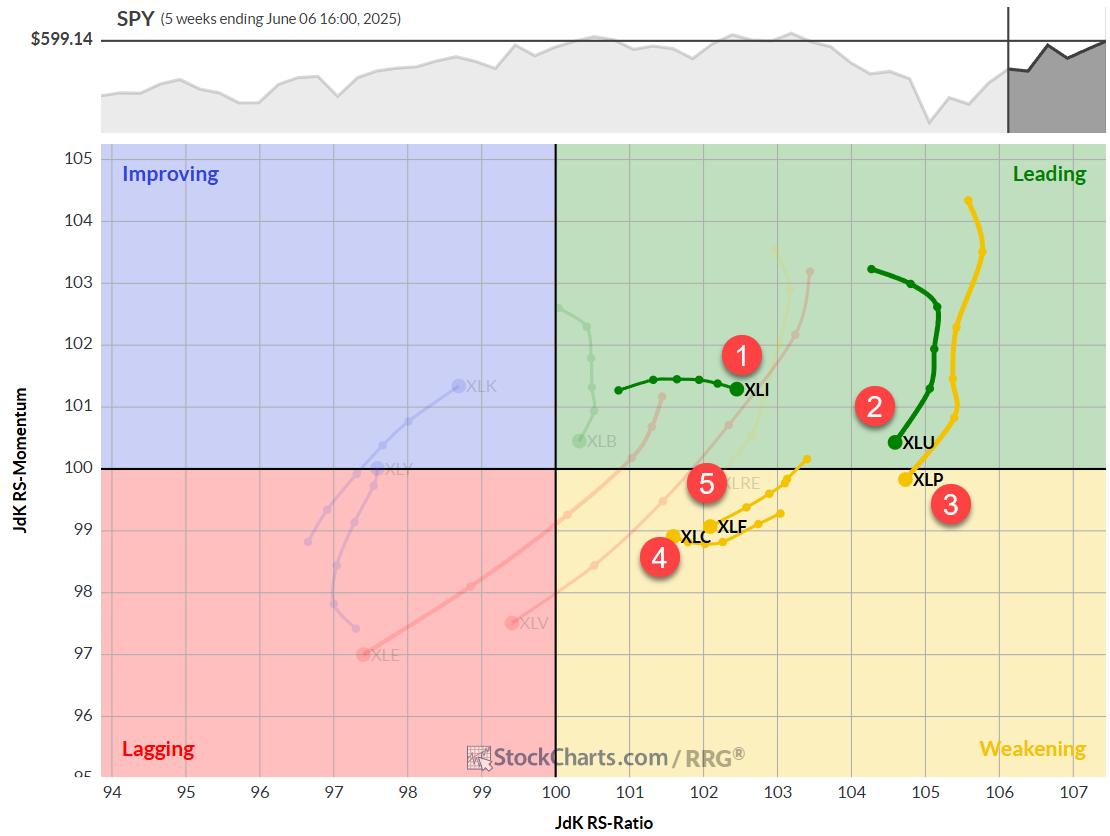
The Best Five Sectors, #26

by Julius de Kempenaer,
Senior Technical Analyst, StockCharts.com
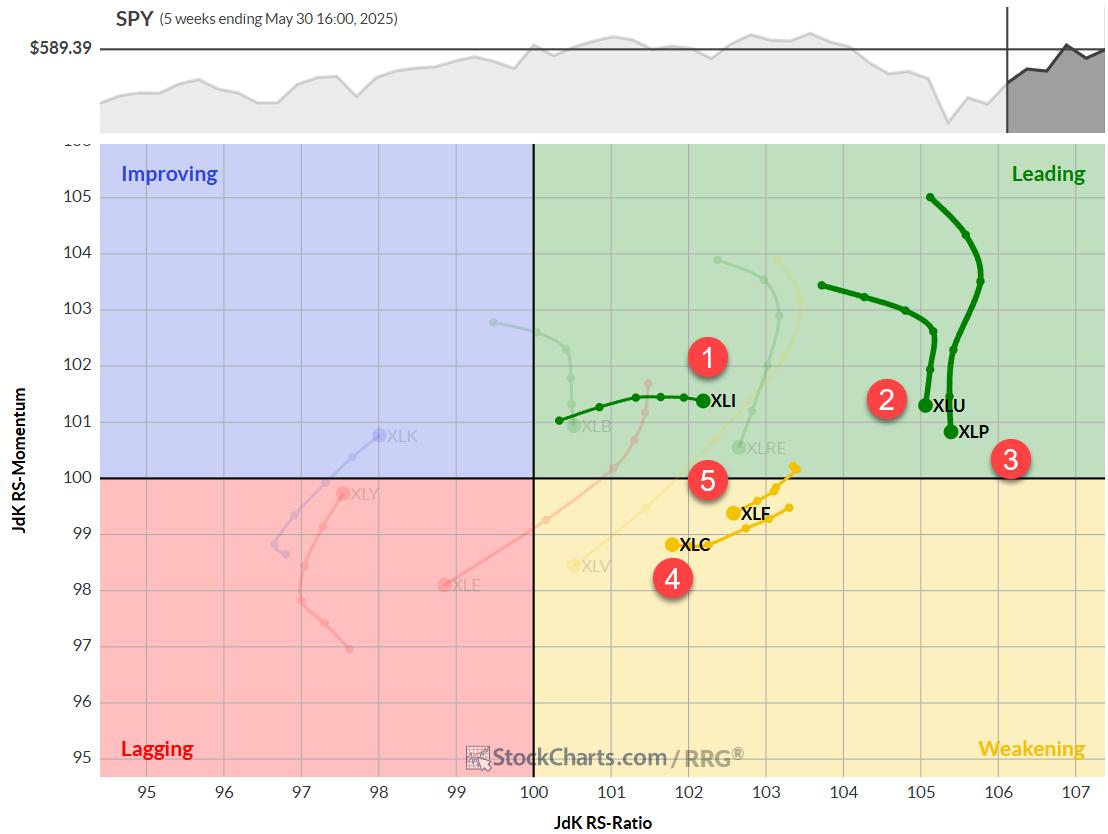
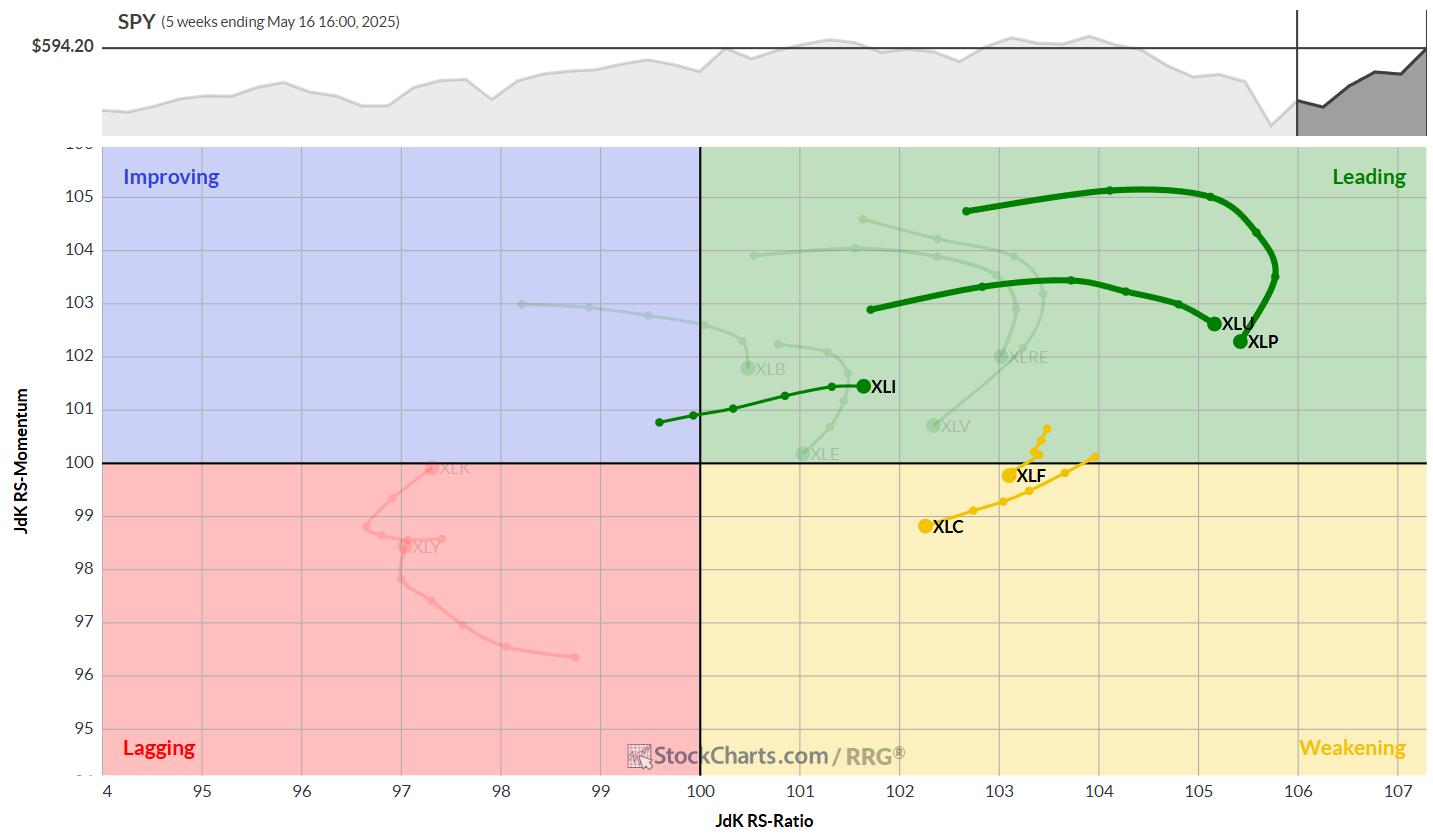
The past week has been relatively stable in terms of sector rankings, with no new entrants or exits from the top five. However, we're seeing some interesting shifts within the rankings that warrant closer examination. Let's dive into the details and see what the Relative Rotation...
READ MORE
MEMBERS ONLY

MACD Crossovers: Why Most Traders Get It Wrong

by Joe Rabil,
President, Rabil Stock Research
Joe presents a deep dive into MACD crossovers, demonstrating how to use them effectively across multiple timeframes, establish directional bias, and improve trade timing. He explains why price action should confirm indicator signals, sharing how to identify "pinch plays" and zero-line reversals for higher-quality setups. Joe then analyzes...
READ MORE
MEMBERS ONLY

The Dollar Index Just Gave a Major Sell Signal - Does That Mean It's About to Implode?

by Martin Pring,
President, Pring Research
Last month, the Dollar Index triggered a number of sell signals confirming that it is in a bear market. Chart 1, for instance, shows that the red up trendline emanating in 2011 has been decisively ruptured, thereby pushing the Index further below its moving average. The Coppock Curve, seen in...
READ MORE
MEMBERS ONLY

Pullbacks & Reversals: Stocks Setting Up for Big Moves!

by Mary Ellen McGonagle,
President, MEM Investment Research
In this video, Mary Ellen spotlights key pullback opportunities and reversal setups in the wake of a strong market week, one which saw all-time highs in the S&P 500 and Nasdaq. She breaks down the semiconductor surge and explores the bullish momentum in economically-sensitive sectors, including software, regional...
READ MORE
MEMBERS ONLY

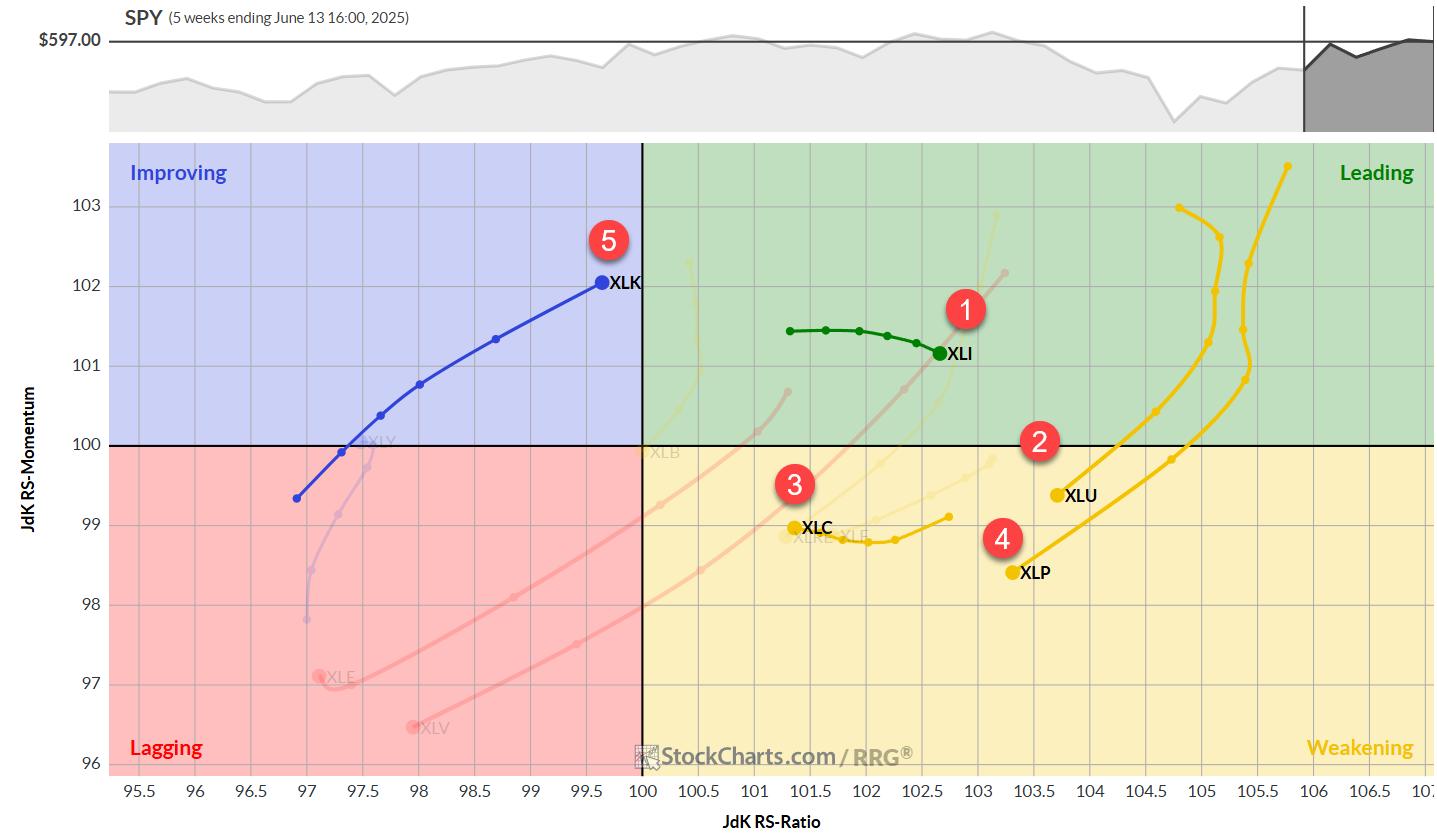
The Best Five Sectors, #25
by Julius de Kempenaer,
Senior Technical Analyst, StockCharts.com
A Greek Odyssey
First of all, I apologize for any potential delays or inconsistencies this week. I'm currently writing this from a hotel room in Greece, surrounded by what I can only describe as the usual Greek chaos. Our flight back home was first delayed, then canceled, then...
READ MORE
MEMBERS ONLY
How to Improve your Trading Odds and Increase Opportunities

by Arthur Hill,
Chief Technical Strategist, TrendInvestorPro.com
Chartists can improve their odds and increase the number of opportunities by trading short-term bullish setups within bigger uptrends. The first order of business is to identify the long-term trend using a trend-following indicator. Second, chartist can turn to more granular analysis to find short-term bullish setups. Today's...
READ MORE
MEMBERS ONLY

From Drift to Lift: Spotting Breakouts Before Momentum Hits
by Joe Rabil,
President, Rabil Stock Research
MACD, ADX and S&P 500 action frame Joe Rabil's latest show, where a drifting index push him toward single-stock breakouts. Joe spotlights the daily and weekly charts of American Express, Fortinet, Parker-Hannifin, Pentair, and ServiceNow as showing strong ADX/MACD characteristics. He outlines how the patterns...
READ MORE
MEMBERS ONLY

Find Highest Probability Counter-Trend Setups

by Tony Zhang,
Chief Strategist, OptionsPlay
Think trading against the trend is risky? You may want to reconsider. When a stock or ETF is trending lower, the smart money watches for signs of a reversal; those early signals can get you into a trend before everyone else and lead to favorable risk-to-reward ratios.
In this video,...
READ MORE
MEMBERS ONLY

Shifting Tides in the Stock Market: A New Era for Bulls?

by Jayanthi Gopalakrishnan,
Director of Site Content, StockCharts.com
The stock market has been on quite the rollercoaster of late, thanks to news headlines. But investors seem to have shrugged off the past weekend's geopolitical tensions, at least for now.
On Tuesday, we saw a surge of enthusiasm. Investors were diving back into stocks and selling off...
READ MORE
MEMBERS ONLY

AI Stocks Ignite Again—Where Smart Money is Heading Next
by Mary Ellen McGonagle,
President, MEM Investment Research
In this video, Mary Ellen opens with a look at the S&P 500, noting that the index remains above its 10-day average despite a brief pullback—a sign of healthy market breadth. She points to ongoing sector leadership in technology, while observing that energy and defense stocks are...
READ MORE
MEMBERS ONLY
The Best Five Sectors, #24
by Julius de Kempenaer,
Senior Technical Analyst, StockCharts.com
Some Sector Reshuffling, But No New Entries/Exits
Despite a backdrop of significant geopolitical events over the weekend, the market's reaction appears muted -- at least, in European trading. As we assess the RRG best five sectors model based on last Friday's close, we're...
READ MORE
MEMBERS ONLY

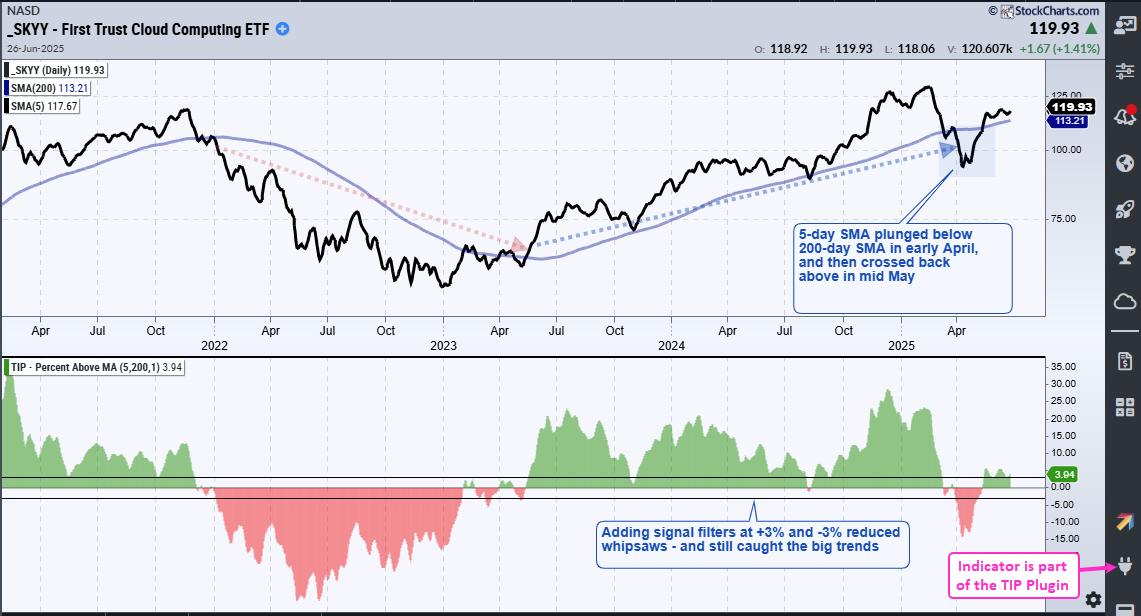
Lagging Mid-cap ETF Hits Moment of Truth
by Arthur Hill,
Chief Technical Strategist, TrendInvestorPro.com
The S&P MidCap 400 SPDR (MDY) is trading at a moment of truth as its 5-day SMA returns to the 200-day SMA. A bearish trend signal triggered in early March. Despite a strong bounce from early April to mid May, this signal remains in force because it has...
READ MORE
MEMBERS ONLY

Joe Rabil's Undercut & Rally Pattern: From DROP to POP
by Joe Rabil,
President, Rabil Stock Research
Joe presents his game-changing "undercut and rally" trading pattern, which can be found in high volatility conditions and observed via RSI, MACD and ADX signals. Joe uses the S&P 500 ETF as a live case study, with its fast shake-out below support followed by an equally...
READ MORE
MEMBERS ONLY
3 S&P 500 Charts That Point to the Next Big Move

by Frank Cappelleri,
Founder & President, CappThesis, LLC
Follow along with Frank as he presents the outlook for the S&P 500, using three key charts to spot bullish breakouts, pullback zones, and MACD signals. Frank compares bearish and bullish setups using his pattern grid, analyzing which of the two is on top, and explains why he&...
READ MORE
MEMBERS ONLY

G7 Meeting in Canada Could Be Opportune Time for Accumulating Canadian Dollar and Canadian Equities
by Martin Pring,
President, Pring Research
The Canadian dollar peaked in 2007 and 2011 at around $1.05, and it has been zig-zagging downwards ever since. Now at a lowly 73 cents USD, the currency looks as if it may be in the process of bottoming, or at the very least entering a multi-year trading range....
READ MORE
MEMBERS ONLY

Diving into Energy Investments: Uncover Hidden Gems Today!

by Jay Woods,
Chief Global Strategist, Freedom Capital Markets
With oil prices surging and geopolitical unrest stirring in the Middle East, it's no surprise that energy stocks are drawing renewed attention. And, quite frankly, this week didn't have many market-moving earnings. So this week, we skate to where the puck is, or, in this case,...
READ MORE
MEMBERS ONLY

Major Shift in the Markets! Here's Where the New Strength Is
by Mary Ellen McGonagle,
President, MEM Investment Research
In this video, Mary Ellen spotlights breakouts in Energy and Defense, Technology sector leadership, S&P 500 resilience, and more. She then unpacks the stablecoin fallout hitting Visa and Mastercard, highlights Oracle's earnings breakout, and shares some pullback opportunities.
This video originally premiered June 13, 2025. You...
READ MORE
MEMBERS ONLY
The Best Five Sectors, #23
by Julius de Kempenaer,
Senior Technical Analyst, StockCharts.com
This Time Technology Beats Financials
After a week of no changes, we're back with renewed sector movements, and it's another round of leapfrogging.
This week, technology has muscled its way back into the top five sectors at the expense of financials, highlighting the ongoing volatility in...
READ MORE
MEMBERS ONLY

Is a Bold Rotation Brewing in Healthcare and Biotech? Here's What to Watch Now

by Karl Montevirgen,
The StockCharts Insider
Catching a sector early as it rotates out of a slump is one of the more reliable ways to get ahead of an emerging trend. You just have to make sure the rotation has enough strength to follow through.
On Thursday morning, as the markets maintained a cautiously bullish tone,...
READ MORE
MEMBERS ONLY
Three Sectors Stand Out and One Sports a Bullish Breakout
by Arthur Hill,
Chief Technical Strategist, TrendInvestorPro.com
Three sectors stand out, with one sporting a recent breakout that argues for higher prices. Today's report will highlight three criteria to define a leading uptrend. First, price should be above the rising 200-day SMA. Second, the price-relative should be above its rising 200-day SMA. And finally, leaders...
READ MORE
MEMBERS ONLY

What the S&P 500, VIX, and ARKK are Telling Us Now
by Frank Cappelleri,
Founder & President, CappThesis, LLC
While the S&P 500 ($SPX) logged a negative reversal on Wednesday, the Cboe Volatility Index ($VIX), Wall Street's fear gauge, logged a positive reversal. This is pretty typical: when the S&P 500 falls, the VIX rises.
Here's what makes it interesting: the...
READ MORE
MEMBERS ONLY

Unlocking Stock Market Insights: Identify Global Opportunities with StockCharts' Market Summary
by Jayanthi Gopalakrishnan,
Director of Site Content, StockCharts.com
The U.S. stock market has been painting a subtle picture recently. While the broader indexes, such as the S&P 500 ($SPX), Nasdaq Composite ($COMPQ), and Dow Jones Industrial Average ($INDU), are indeed grinding higher, the daily movements have been relatively subdued. This is a noticeable shift from...
READ MORE
MEMBERS ONLY
Is the S&P 500 Flashing a Bearish Divergence?

by David Keller,
President and Chief Strategist, Sierra Alpha Research
Unlock the power of divergence analysis! Join Dave as he breaks down what a bearish momentum divergence is and why it matters. Throughout this video, Dave illustrates how to confirm (or invalidate) the signal on the S&P500, Nasdaq100, equal‑weighted indexes, semiconductors, and even defensive names like AT&...
READ MORE
MEMBERS ONLY
The Best Five Sectors, #22
by Julius de Kempenaer,
Senior Technical Analyst, StockCharts.com
Sector Rotation: A Week of Stability Amidst Market Dynamics
Last week presented an intriguing scenario in our sector rotation portfolio.
For the first time in recent memory, we witnessed complete stability across all sector positions -- no changes whatsoever in the rankings.
1. (1) Industrials - (XLI)
2. (2) Utilities...
READ MORE
MEMBERS ONLY

Tech ETFs are Leading Since April, but Another Group is Leading YTD
by Arthur Hill,
Chief Technical Strategist, TrendInvestorPro.com
QQQ and tech ETFs are leading the surge off the April low, but there is another group leading year-to-date. Year-to-date performance is important because it includes two big events: the stock market decline from mid February to early April and the steep surge into early June. We need to combine...
READ MORE
MEMBERS ONLY
From Tariffs to Tech: Where Smart Money's Moving Right Now
by Mary Ellen McGonagle,
President, MEM Investment Research
Stay ahead of the market in under 30 minutes! In this video, Mary Ellen breaks down why the S&P 500 just broke out, which sectors are truly leading (industrials, technology & materials), and what next week's inflation data could mean for your portfolio.
This video originally...
READ MORE
MEMBERS ONLY

Silver's Surge is No Fluke—Here's the Strange Ratio Driving It
by Karl Montevirgen,
The StockCharts Insider
Silver just hit a 13-year high, breaking above a key resistance level that could ignite a major bull run. Some metals analysts now say a rally to $40 isn't a long shot, but a matter of time. So, are the odds finally shifting in favor of the bulls?...
READ MORE
MEMBERS ONLY

Strategic Chaos or Tactical Goldmine? What QQQ's Chart is Whispering Right Now
by Karl Montevirgen,
The StockCharts Insider
Despite the uncertainty prevailing in the markets, the Nasdaq 100 Index ($NDX) has proven resilient, perhaps more so than its peer benchmarks. The 90-day trade truce between the U.S. and China, initiated in May, boosted investor confidence. Yet that's now at risk amid mutual accusations of violations....
READ MORE
MEMBERS ONLY
S&P 500 Bullish Patterns: Are Higher Highs Ahead?
by Frank Cappelleri,
Founder & President, CappThesis, LLC
In this market update, Frank breaks down recent developments across the S&P 500, crypto markets, commodities, and international ETFs. He analyzes bullish and bearish chart patterns, identifies key RSI signals, and demonstrates how "Go No Go Charts" can support your technical analysis. You'll also...
READ MORE
MEMBERS ONLY

This Important Metal Could Be on the Verge of a Mega-Breakout
by Martin Pring,
President, Pring Research
Gold has been on a tear since 2022, leaving other metals in the dust. Nevertheless, it's important to remember that the yellow metal has a strong tendency to lead commodities in general, which implies the likelihood of inflationary pressures in the commodity pits going forward. The leads and...
READ MORE
MEMBERS ONLY
Hedge Market Volatility with These Dividend Aristocrats & Sector Leaders
by Mary Ellen McGonagle,
President, MEM Investment Research
In this video, Mary Ellen highlights key areas of the stock market that gained strength last week, including Staples and Aerospace stocks. She also shares several Dividend Aristocrat stocks that can help stabilize your portfolio in times of market volatility.Whether you're seeking defensive plays or looking to...
READ MORE
MEMBERS ONLY
The Best Five Sectors, #21
by Julius de Kempenaer,
Senior Technical Analyst, StockCharts.com
Staples and Tech Swap Positions Again
The weekly sector rotation continues to paint a picture of a market in flux, with defensive sectors gaining ground while cyclicals take a step back. This week's shifts underscore the ongoing volatility and lack of clear directional trade that's been...
READ MORE
MEMBERS ONLY
Leadership Rotation Could Confirm Corrective Phase
by David Keller,
President and Chief Strategist, Sierra Alpha Research
There's no denying that the equity markets have taken on a decisively different look and feel in recent weeks.
We've compared the charts of the S&P 500 and Nasdaq 100, as well as leading growth stocks like Nvidia, to an airplane experiencing a "...
READ MORE
MEMBERS ONLY
Analyzing SIL, USO, and NVDA: Could These Bullish Patterns Trigger?
by Frank Cappelleri,
Founder & President, CappThesis, LLC
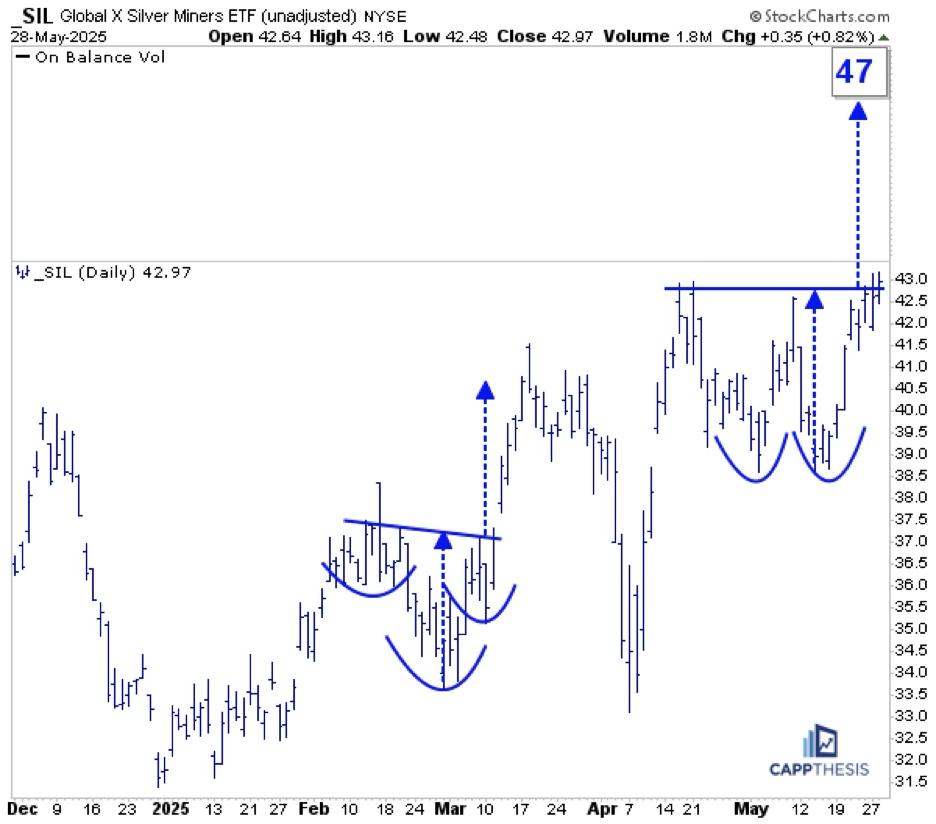
SIL Silver Miners
SIL was among the leaders yesterday and now is close to triggering this double-bottom bullish pattern. Staying above the 43-mark would target 47. That's not a big move, but let's remember that SIL is sporting bullish formations on its longer-term charts, too.
SIL...
READ MORE
MEMBERS ONLY
Is It A Pullback? Or is More Downside Ahead?
by Mary Ellen McGonagle,
President, MEM Investment Research
Get the latest stock market update with Mary Ellen McGonagle. Learn key downside signals, how to manage pullbacks, and which earnings reports could impact the market next week.
In this week's episode, Mary Ellen reviews where the markets currently stand and what to watch for to signal further...
READ MORE
MEMBERS ONLY

Five Charts I Am Watching Closely
by Martin Pring,
President, Pring Research
Each week, I monitor numerous charts to see if they have the potential for an important breakout. I tend to look at longer-term ones, because they set the scene as to whether the primary trend is bullish or bearish. That's important information to have, as the magnitude and...
READ MORE
MEMBERS ONLY

The Best Five Sectors, #20
by Julius de Kempenaer,
Senior Technical Analyst, StockCharts.com
Technology Back in Top-5
Last week's market decline of 2-2.5% (depending on the index) has led to some notable shifts in sector performance and rankings.
This pullback, coming after a strong rally, is changing the order of highs and lows on the weekly chart -- a particularly...
READ MORE
MEMBERS ONLY

MACD + ADX: Spot the Pullbacks Worth Trading
by Joe Rabil,
President, Rabil Stock Research
In this video, Joe shares how to use MACD and ADX indicators to analyze stock pullbacks, focusing on the good while avoiding the weak setups. He explains how these indicators can complement one another. Joe then shows the Summary Page in ACP and how he uses it on a regular...
READ MORE
MEMBERS ONLY

S&P 500, Bitcoin & XLK: What the Charts Are Saying Now
by Frank Cappelleri,
Founder & President, CappThesis, LLC
In this video, Frank dives into some of his favorite features on StockCharts.com. He then dissects the S&P 500 and Bitcoin price action, before exploring the the XLK Technology ETF's explosive move off the lows. He also highlights a few recent trade ideas and setups...
READ MORE
MEMBERS ONLY
The Best Five Sectors, #19
by Julius de Kempenaer,
Senior Technical Analyst, StockCharts.com
KEY TAKEAWAYS
* Industrials surge to #1 in sector ranking, replacing Real Estate in top 5
* Communication Services showing vulnerability, moving into weakening quadrant
* Utilities and Consumer Staples losing momentum but maintaining leading positions
* Portfolio maintains defensive positioning despite underperformance vs SPY
Sector Rotation Shakeup: Industrials Take the Lead
Another week...
READ MORE