MEMBERS ONLY

StockCharts Insider: The Hidden Risks of Learning Trading on Social Media

by Karl Montevirgen,
The StockCharts Insider
Before We Dive In…
Scroll through YouTube or TikTok and you’ll find that trading looks easy. Clean charts, fast profits, flashy lifestyles…it’s everywhere! Even my 12-year-old son, after a few weeks of studying candlestick patterns (without telling me), has become an “expert” who asked if he can...
READ MORE
MEMBERS ONLY

StockCharts Insider: Market Breadth 101 — What Index Price Doesn’t Tell You
by Karl Montevirgen,
The StockCharts Insider
Before We Dive In…
When the S&P 500 makes a 1% move up, it feels like the market is exhibiting strength. But is it? Sometimes an index will rise because a handful of mega-caps are doing the heavy lifting. What you don’t see are the other stocks...
READ MORE
MEMBERS ONLY

StockCharts Insider: The Missing Step in Ichimoku Cloud Breakout Strategies
by Karl Montevirgen,
The StockCharts Insider
Before We Dive In…
Ichimoku Cloud breakouts can be an incredibly effective way to jump into a trend but only if you follow the right steps when pulling the trigger. You can easily find these breakouts while fine-tuning your criteria using StockCharts’ Updated Scan Filters. However, if you simply focus...
READ MORE
MEMBERS ONLY

StockCharts Insider: Turning Sector Drill-Down into an Actionable Workflow
by Karl Montevirgen,
The StockCharts Insider
Before We Dive In…
The Sector Drill-Down is a popular and incredibly useful tool for observing relative sector rankings at a glance. But the data itself doesn’t give you a workflow, let alone a strategy. While many traders glance at the rankings and click a few charts, hoping something...
READ MORE
MEMBERS ONLY
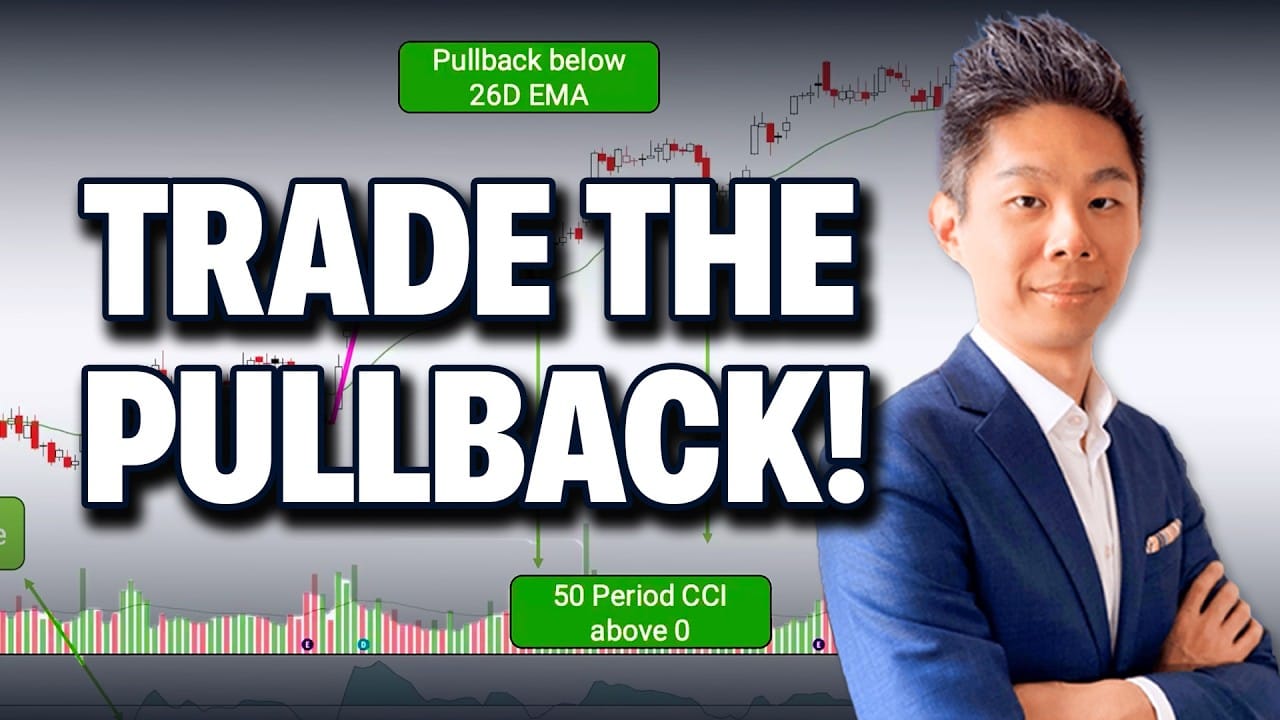
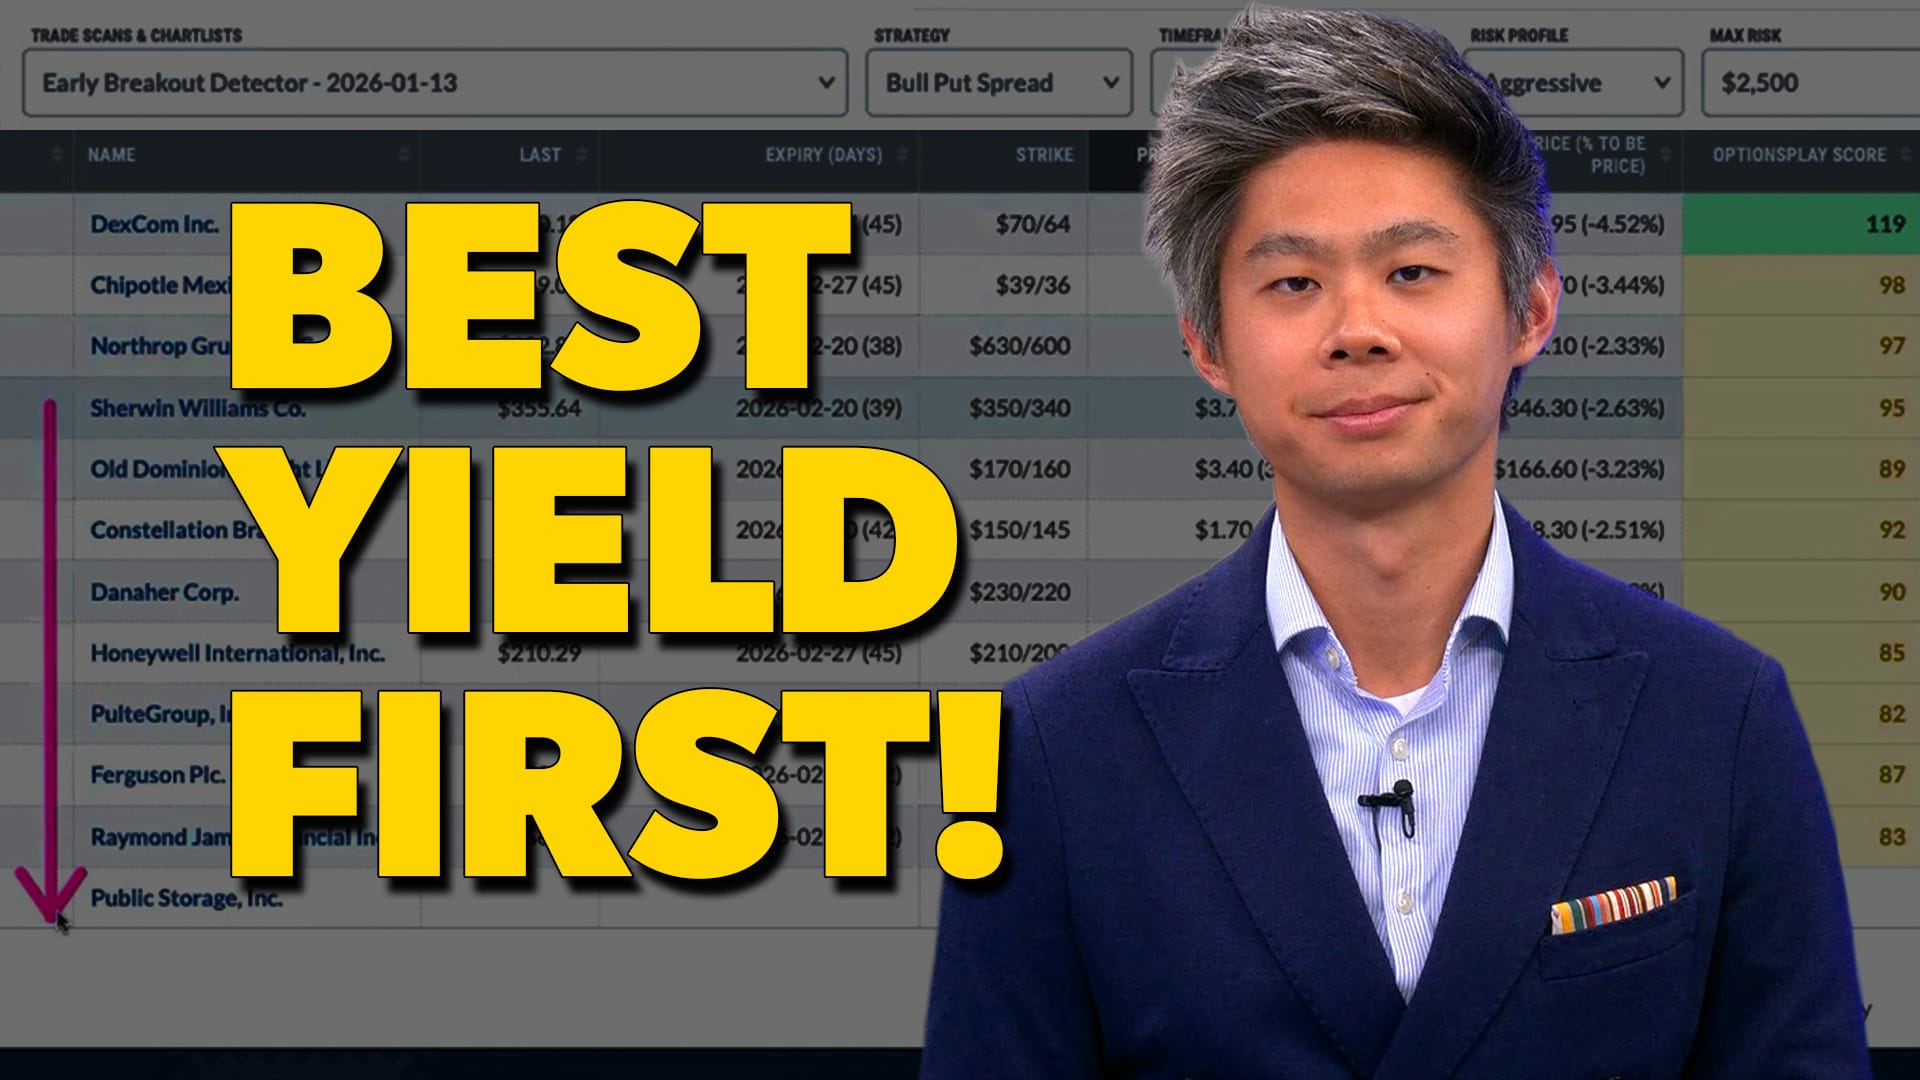
How to Trade Trend Pullbacks with OptionsPlay

by Tony Zhang,
Chief Strategist, OptionsPlay
Tony Zhang shares his battle-tested trend following options strategy! Discover how the OptionsPlay Strategy Center automatically ranks call options, spreads, and credit trades to help you find the best risk-reward opportunities in minutes....
READ MORE
MEMBERS ONLY

StockCharts Insider: Ichimoku’s Forgotten Line - The Chikou Span (and How It Can Help You)
by Karl Montevirgen,
The StockCharts Insider
Before We Dive In…
The Chikou Span is arguably the most overlooked, most underestimated, and most underutilized part of the Ichimoku Cloud.
At first glance, it doesn’t look like much. It simply takes today’s closing price and plots it 26 periods back. If you’re focused on what’...
READ MORE
MEMBERS ONLY
NEW StockCharts Scan Engine Update — Build Powerful Stock Scans Without Writing Code!

by Grayson Roze,
Chief Strategist, StockCharts.com
Grayson Roze reveals a powerful Scan Engine update that makes building advanced stock scans easier than ever. See how the new Scan Components panel lets you create custom scans and alerts using pre-built criteria—no code required....
READ MORE
MEMBERS ONLY
Failed Breakouts: How to Spot Them, Manage Risk, and Stay with Strong Charts

by David Keller,
President and Chief Strategist, Sierra Alpha Research
Markets are feeling uncertain as earnings season unfolds and the Fed meeting approaches, yet overall trends remain surprisingly strong. This week, Dave Keller explores the concept of failed breakouts and why managing risk is just as important as identifying new opportunities....
READ MORE
MEMBERS ONLY

StockCharts Insider: How to Read Wall Street’s Risk-On Playbook
by Karl Montevirgen,
The StockCharts Insider
Before We Dive In…
The Street says it’s risk-on. Sector charts back that up. But, at the time of writing, the stocks that usually lead real bull runs are only doing… okay. So, where’s all the money going? Which corner of risk is capital flowing into? Here’s...
READ MORE
MEMBERS ONLY
Find the Best Options Trades Without Wasting Hours!
by Tony Zhang,
Chief Strategist, OptionsPlay
Tony Zhang explains how to find the best-yielding options strategies with StockCharts’ OptionsPlay Strategy Center. Learn how to rank cover calls, cash-secured puts, and spreads in real time to trade more efficiently and with greater confidence....
READ MORE
MEMBERS ONLY

StockCharts Insider: The Untapped Edge Hiding in Your Moving Averages
by Karl Montevirgen,
The StockCharts Insider
Before We Dive In…
Markets don’t always trend. They coil, surge, and then launch in one direction or another. The trick is being able to spot each phase and to use that information to act. A lone moving average can hint at direction, but it won’t tell you...
READ MORE
MEMBERS ONLY
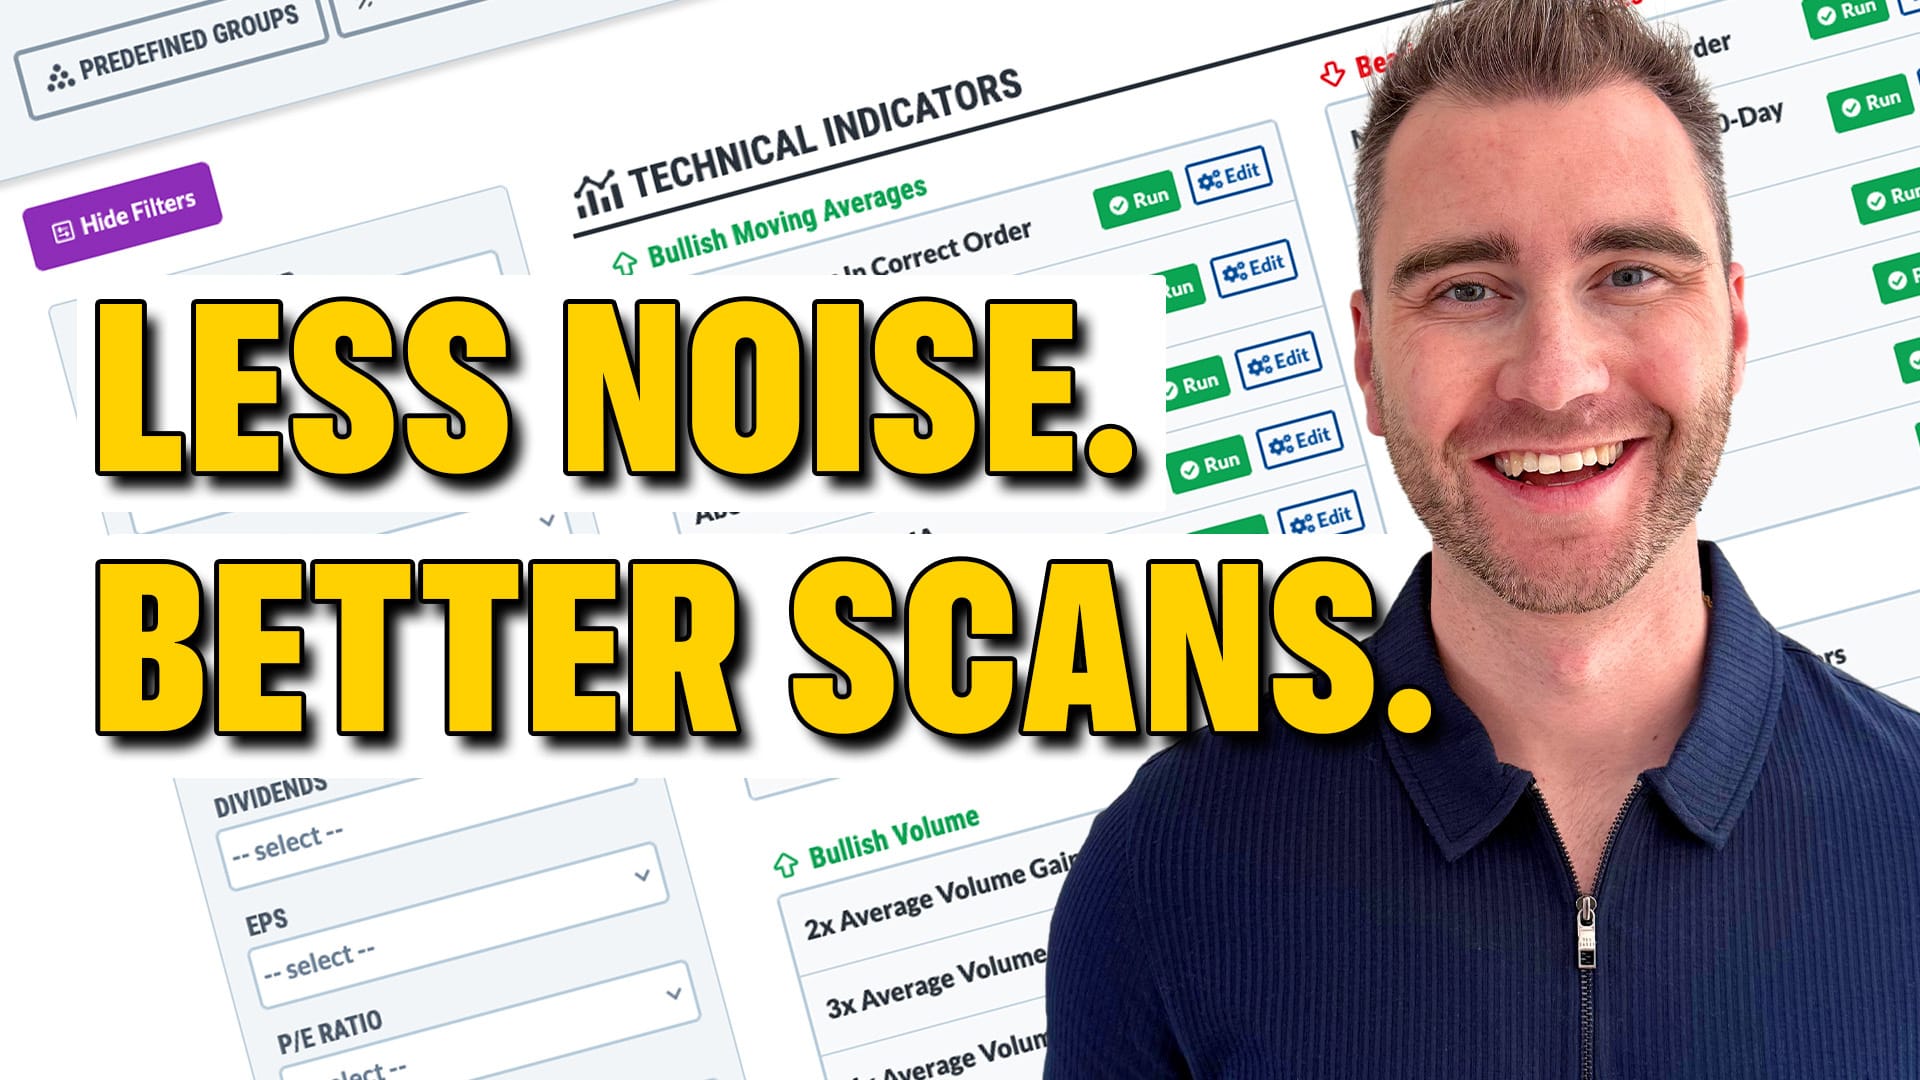
New Scan Filters — A Faster Way to Find the Right Stocks!
by Grayson Roze,
Chief Strategist, StockCharts.com
Grayson Roze introduces new filtering tools for the Sample Scan Library that make scanning faster and more focused. See how this update can help you narrow results and find stronger stock ideas with less effort....
READ MORE
MEMBERS ONLY

StockCharts Insider: How to Spot a Stock That’s Wound Tight and Ready to Break (Part 2 - TTM Squeeze)
by Karl Montevirgen,
The StockCharts Insider
Before We Dive In…
Every strong move begins with tension, a buildup of energy (sometimes hidden) before the next move. While most traders only notice the explosion, those who pay close attention to volatility are generally able to anticipate the big move before it happens. We covered this in part...
READ MORE
MEMBERS ONLY

StockCharts Insider: How To Spot a Stock That’s Wound Tight and Ready to Break (Part 1)
by Karl Montevirgen,
The StockCharts Insider
Before We Dive In…
Every trader knows that strong breakouts tend to make money as long as you’re on the right side of the move. The tricky part? Knowing when that breakout is likely to happen. What I’m about to give you is a framework for measuring volatility,...
READ MORE
MEMBERS ONLY

Why Financials May Matter More Than Tech in Early 2026
by David Keller,
President and Chief Strategist, Sierra Alpha Research
As we head into 2026, signs of rotating market leadership are already emerging, and the Financial sector is starting to attract attention. In this video, David Keller, CMT, takes a deep dive into the Financial sector, the yield curve, and the shifting interest rate dynamics.
Dave breaks down what the...
READ MORE
MEMBERS ONLY

StockCharts Insider: A Renko Technique to Fine-Tune Your Dollar-Cost Averaging
by Karl Montevirgen,
The StockCharts Insider
Who This Article is For: This article is for the long-term investor who isn’t a full-on expert chartist but wants to know enough to use it to fine-tune their dollar cost averaging strategy. If this is you, read on.
Before We Dive In…
Not every long-term investor wants to...
READ MORE
MEMBERS ONLY

StockCharts Insider: The Hack to Hunting Early Leaders with New-Highs Scans
by Karl Montevirgen,
The StockCharts Insider
Before We Dive In…
Ever watch a stock take off and think, “I wish I had gotten in earlier”? You probably could have. It’s just that early leaders rarely look like leaders at first. The good news is that there are ways to spot and measure emerging strength before...
READ MORE
MEMBERS ONLY

StockCharts Insider: The Five Questions That Bring the 10 Laws Together
by Karl Montevirgen,
The StockCharts Insider
Before We Dive In…
After John Murphy’s 10 Laws, a nagging question remains: where do you actually begin once you’ve loaded your chart? Maybe you weren’t expecting it, but the answer isn’t an indicator or setup. Instead, it begins with a sequence of questions.
You see,...
READ MORE
MEMBERS ONLY

Change of Character: Spotting the Shift From Downtrend to Uptrend
by David Keller,
President and Chief Strategist, Sierra Alpha Research
David Keller explains how to spot when a stock transitions from distribution to accumulation, and how you can use scanning, alerts, and scheduled scans to find the next breakout....
READ MORE
MEMBERS ONLY
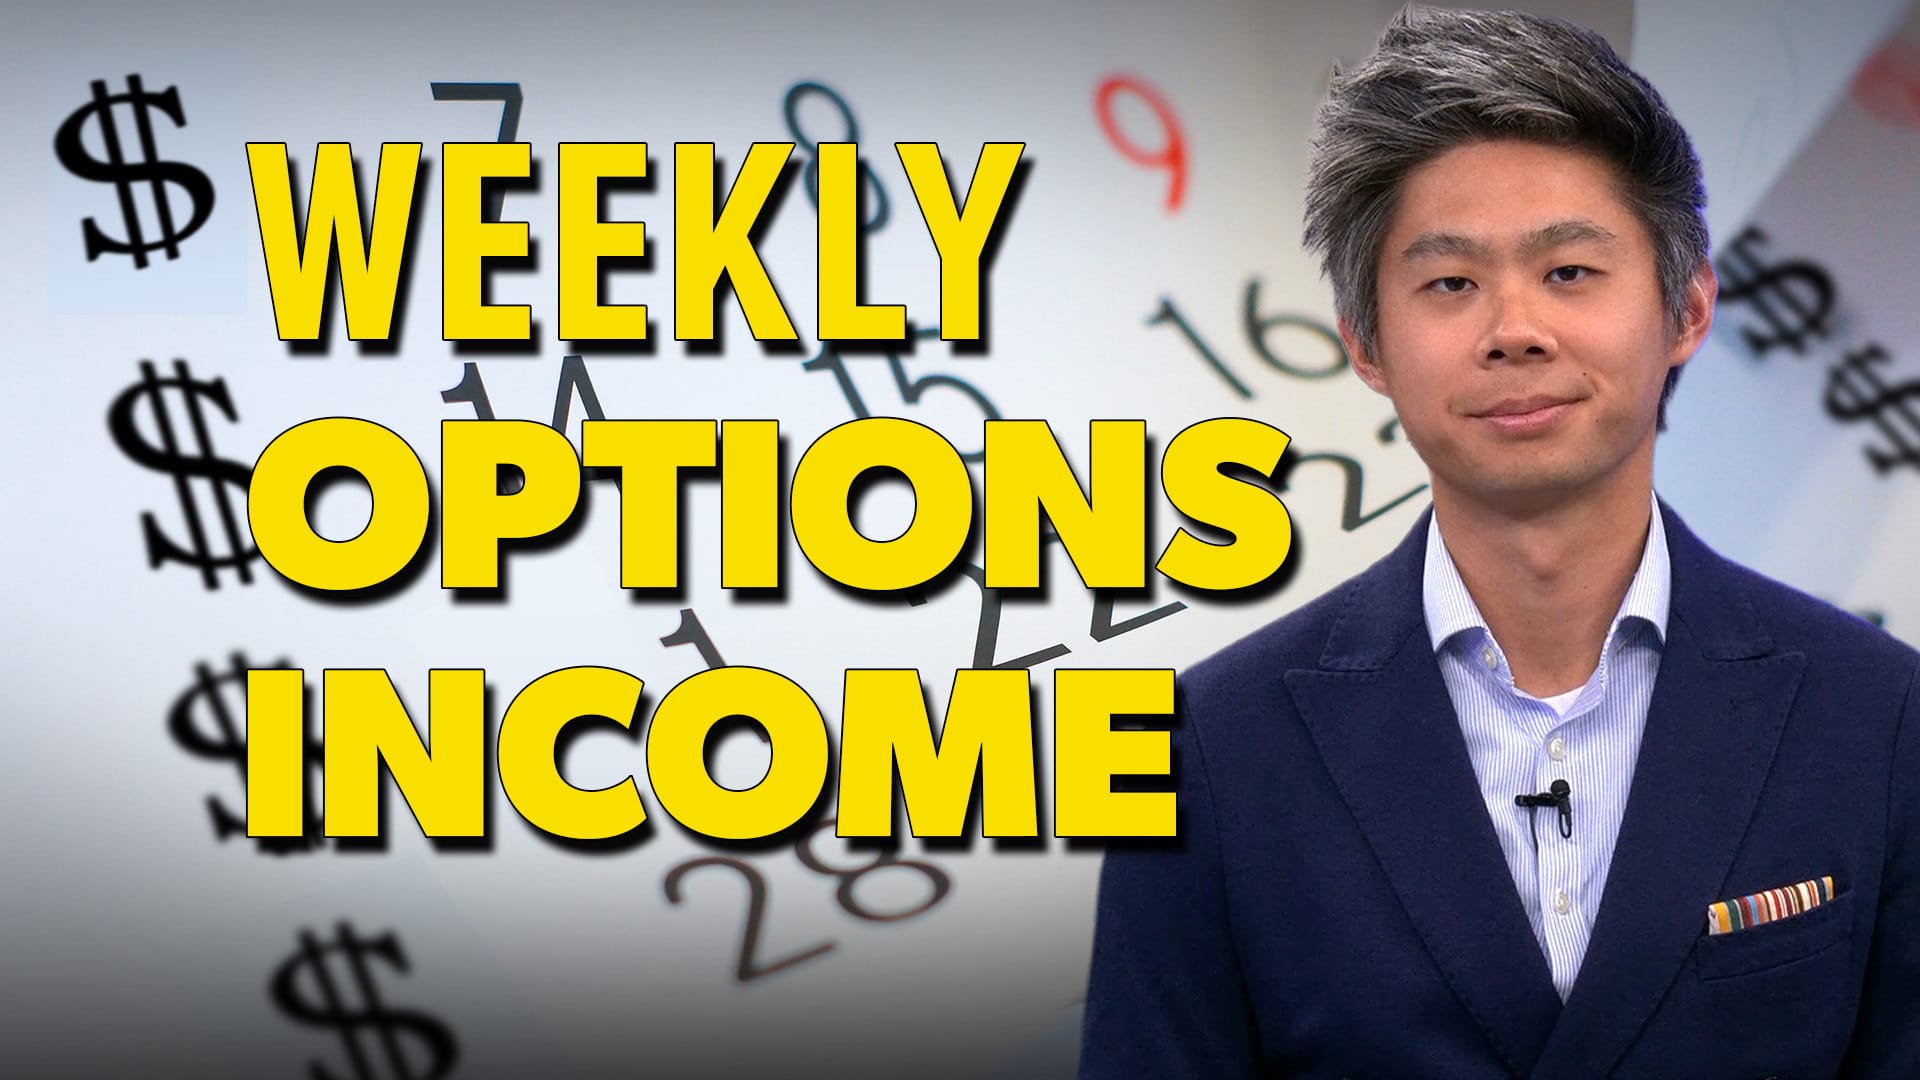
How to Generate Weekly Income with Options — Fast and Smart!
by Tony Zhang,
Chief Strategist, OptionsPlay
Tony Zhang reveals how to generate consistent weekly income with smart options strategies. Learn how to scan for the highest-yielding cover calls, cash-secured puts, and spreads using StockCharts’ OptionsPlay Strategy Center....
READ MORE
MEMBERS ONLY
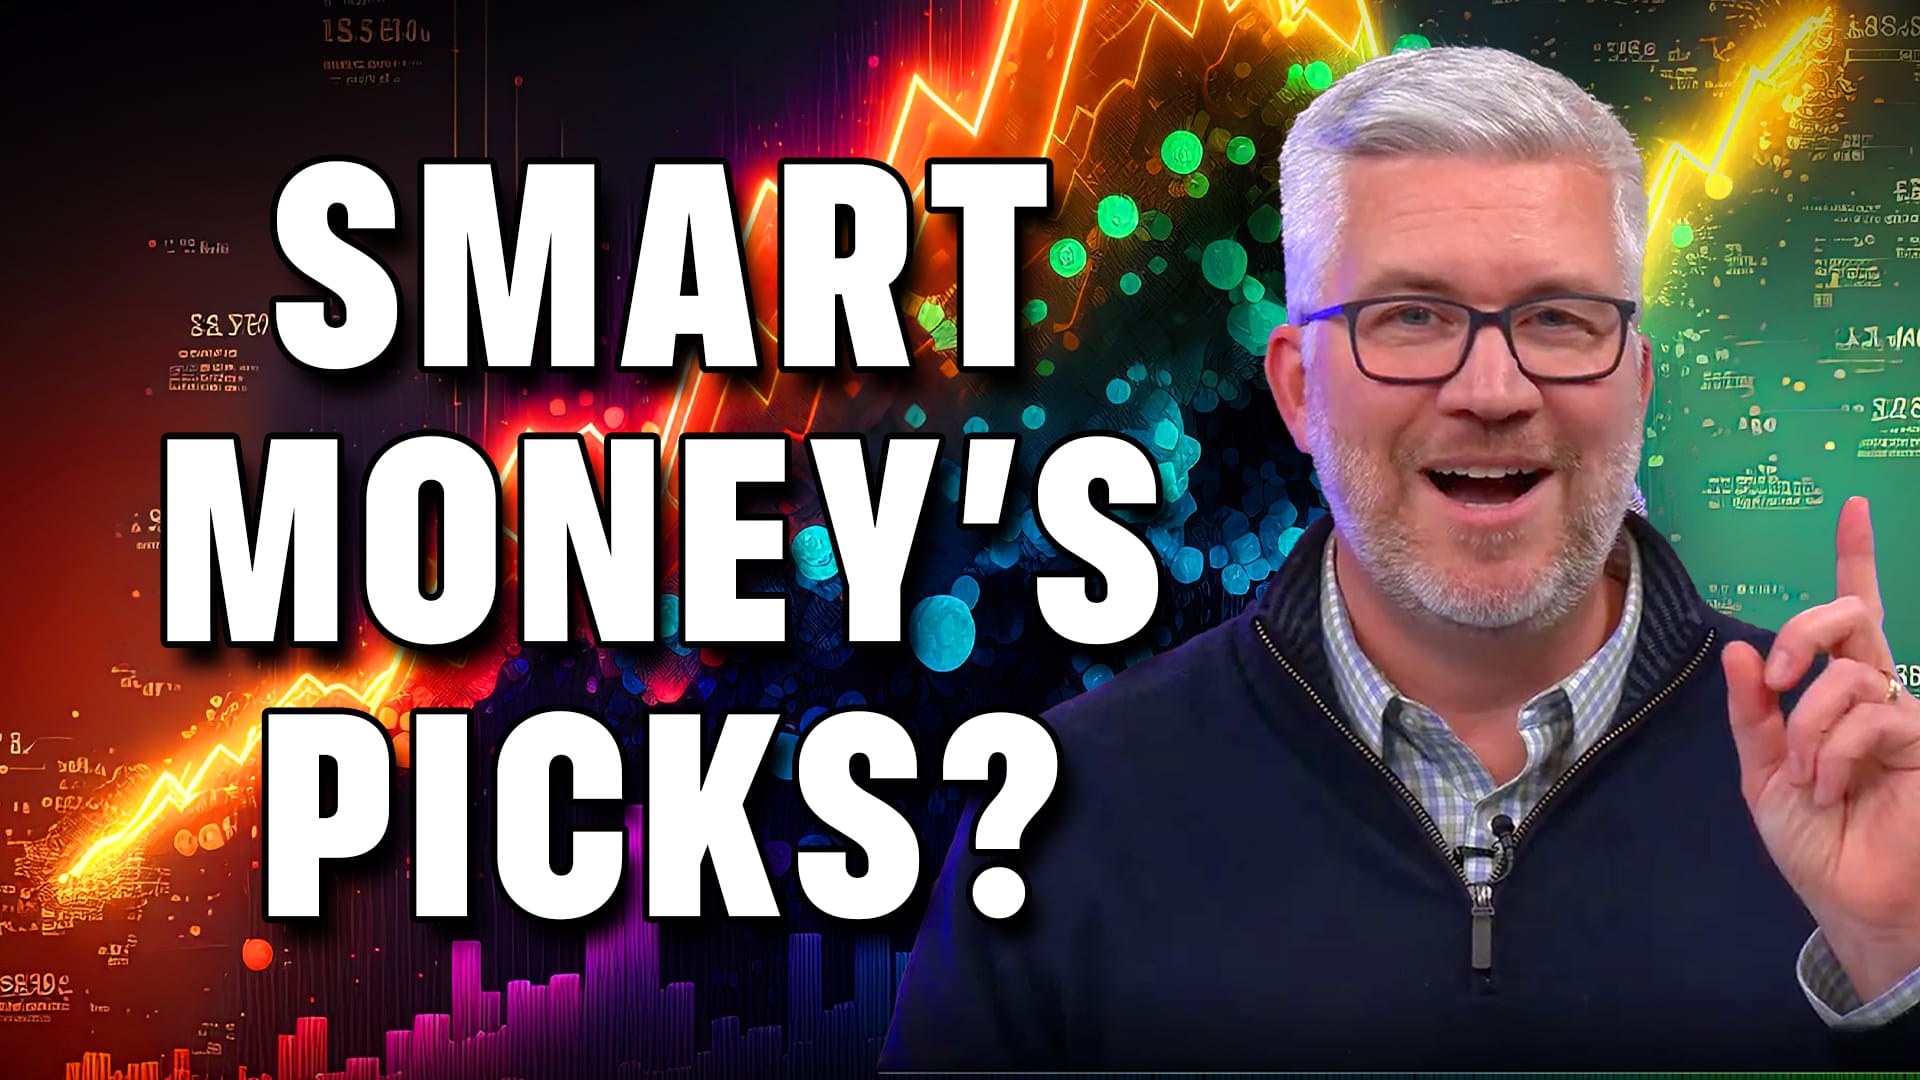
Hedge Funds AND Mutual Funds Picked These 6 Stocks — Should You?
by David Keller,
President and Chief Strategist, Sierra Alpha Research
Dave Keller, CMT reviews six stocks that appeared on both hedge fund and mutual fund “shared favorites” lists in a recent Goldman Sachs study. He evaluates each using StockCharts tools, revealing which setups still show strength and which may be flashing warning signs....
READ MORE
MEMBERS ONLY

StockCharts Insider: John Murphy’s Law #5 - Draw the Line (Trendlines)
by Karl Montevirgen,
The StockCharts Insider
Before We Dive In…
Every chart tells some kind of a story. Without structure, however, that story can feel like noise. Trendlines help you sense the rhythm underneath the often volatile surface, showing where buyers and sellers may draw their invisible battle lines and how long those lines can hold....
READ MORE
MEMBERS ONLY
3 Major Breakdown Signals - Is a Market Top Forming?
by David Keller,
President and Chief Strategist, Sierra Alpha Research
David Keller, CMT uses the modern Dow Theory, sector rotation, and Bitcoin’s decline to illustrate what might be a developing market top. With StockCharts’ tools, Dave tracks weakening momentum, defensive shifts, and the S&P 500’s crucial 6550 support level....
READ MORE
MEMBERS ONLY

StockCharts Insider: John Murphy’s Law #2 — Spot the Trend and Go With It
by Karl Montevirgen,
The StockCharts Insider
Before We Dive In…
Hopefully, you’ve read our first article on mapping the trends (John Murphy’s Law #1). Once you’ve figured out how to do this, the next question is simple: What do you do with it? Welcome to our article on Law #2. This principle is...
READ MORE
MEMBERS ONLY
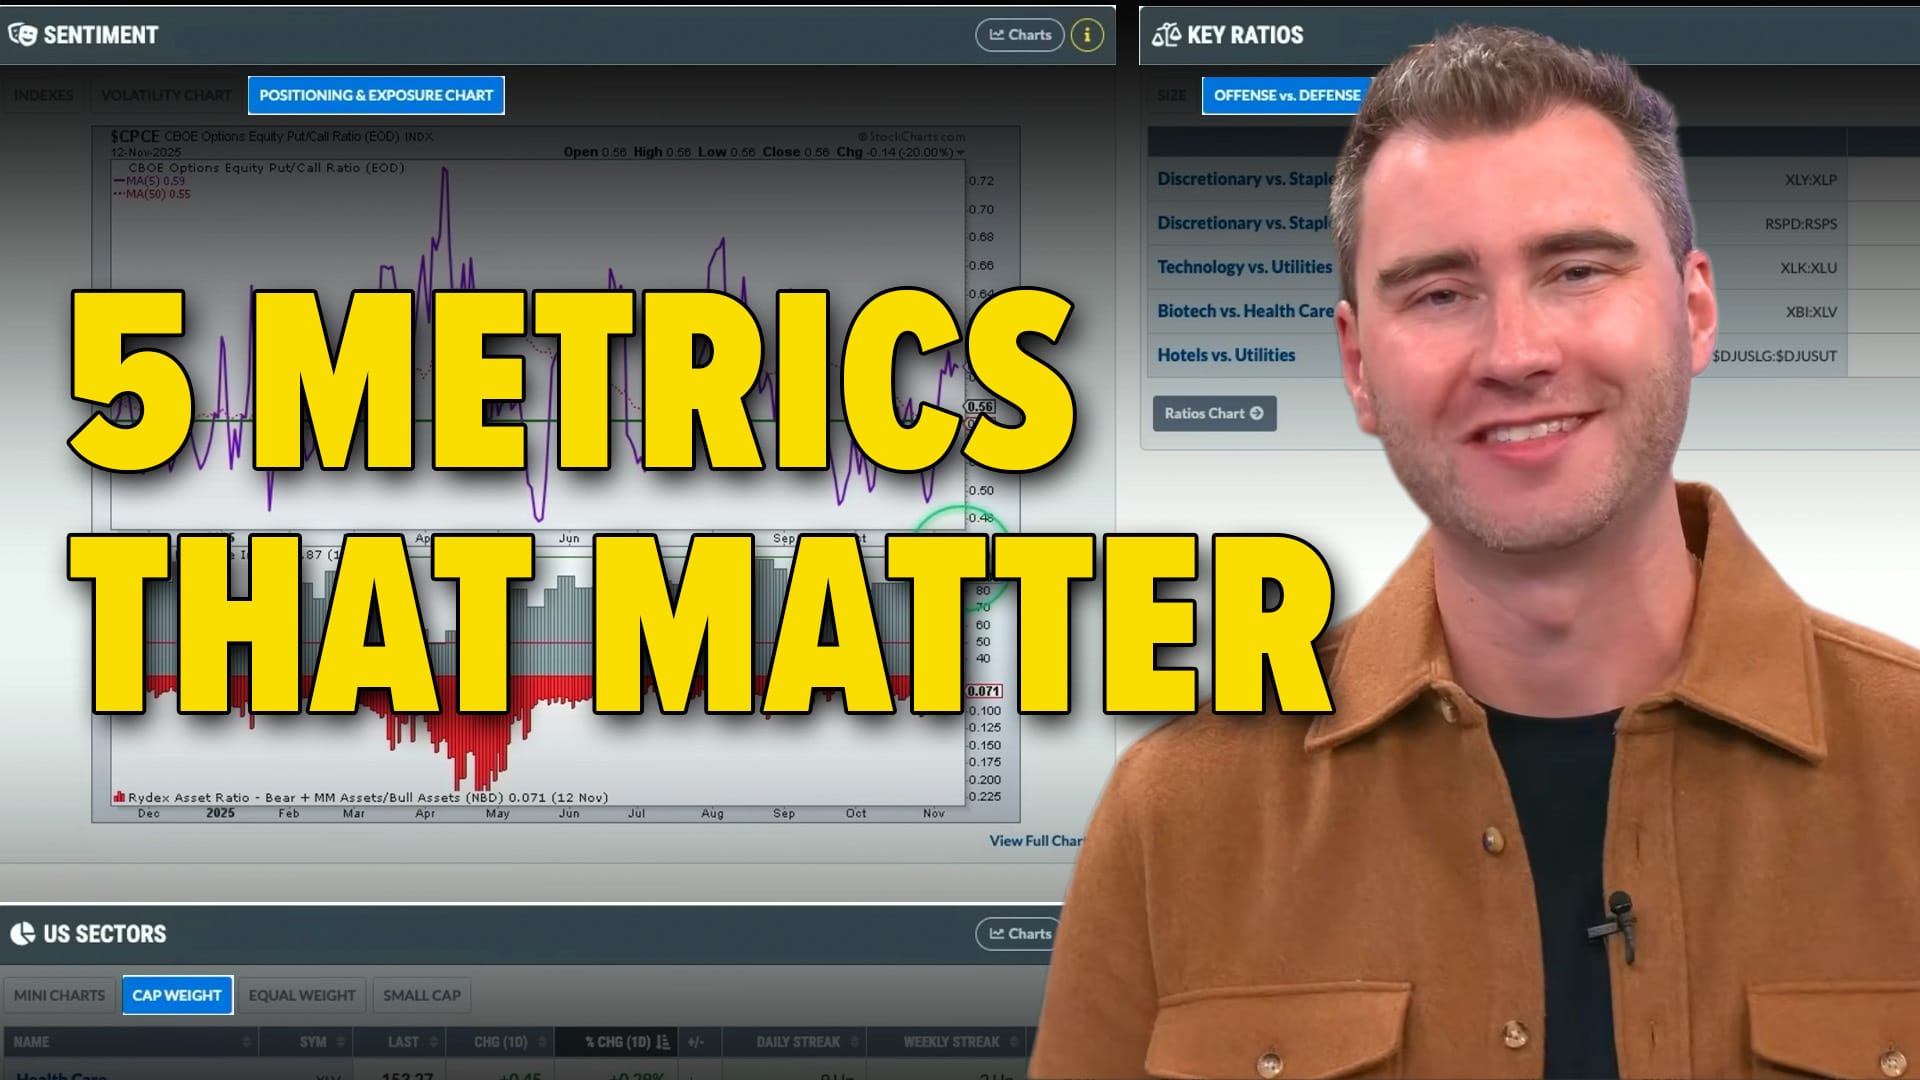
Market Top or Bullish Bounce? Watch These Top 5 Crucial Market Metrics to Decide!
by Grayson Roze,
Chief Strategist, StockCharts.com
With the market just a shout away from its all-time highs, Grayson Roze shares five market metrics every trader should watch using StockCharts’ Market Summary Dashboard. Learn how he tracks trends, breadth, sentiment, and sector strength to uncover what’s really driving the market....
READ MORE
MEMBERS ONLY
The Lazy Trader’s Guide to StockCharts — Tools That Do the Work for You
by Grayson Roze,
Chief Strategist, StockCharts.com
Grayson Roze shows how to become the laziest chartist possible—without losing performance. Learn how StockCharts’ sample charts, chart packs, and scans can instantly build a pro-level setup in your account....
READ MORE
MEMBERS ONLY

StockCharts Insider: How to Find a Seasonal Edge in Stocks by Cracking the Market’s Hidden Calendar
by Karl Montevirgen,
The StockCharts Insider
Before We Dive In…
For every story a chart tells, there are stories hidden from plain view. One story tends to repeat itself almost like clockwork, though it also comes with variations. That’s what seasonality is all about: odd months where stocks tend to shine, stumble, or stall. In...
READ MORE
MEMBERS ONLY

StockCharts Insider: GMMA—Your Market X-Ray
by Karl Montevirgen,
The StockCharts Insider
Before We Dive In…
You’re about to learn something unique: how to gauge trend strength and seize market opportunities using two sets of eyes. The GMMA splits price action into short-term and long-term views, giving you two perspectives on the same market. With one eye on fast-money moves and...
READ MORE
MEMBERS ONLY

StockCharts Insider: The Cloud Hack Many Traders Overlook (But Shouldn’t)
by Karl Montevirgen,
The StockCharts Insider
Before We Dive In…
Here’s today’s play: you’ll run the Entered Ichimoku Cloud scan to spot buy-the-dip candidates, use the SCTR to find the strongest stocks, and then you’ll flip to the charts to see which candidates may be worth pursuing. Plus, you’ll learn how...
READ MORE
MEMBERS ONLY

The StockCharts Game Show: Can You Beat These StockCharts Pros?

by Tom Bowley,
Chief Market Strategist, EarningsBeats.com

by Julius de Kempenaer,
Senior Technical Analyst, StockCharts.com
by Grayson Roze,
Chief Strategist, StockCharts.com
Grayson Roze hosts Tom Bowley and Julius de Kempenaer in a fast-paced StockCharts Game Show showdown! See who dominates in this fun, competitive battle of charting tools, trading terms, and quick wit....
READ MORE
MEMBERS ONLY

StockCharts Insider: ZigZag—The Secret Behind the Most Underrated Non-Indicator in Your Toolbox
by Karl Montevirgen,
The StockCharts Insider
Before We Dive In…
Finding an “edge” in the markets can mean looking at tools that most overlook, or using a seemingly “common” tool from an uncommon angle. The ZigZag is a perfect example. It’s not the most popular tool. It’s not even an indicator. Yet it has...
READ MORE
MEMBERS ONLY

The Secret to Better Investing: Watch Fewer Stocks
by Grayson Roze,
Chief Strategist, StockCharts.com
Grayson Roze reveals how narrowing your invest able universe can make you a better trader. See how to use StockCharts tools to focus your strategy, simplify analysis, and make smarter trading decisions....
READ MORE
MEMBERS ONLY

StockCharts Insider: How to Use PerfCharts to Decode Investor Sentiment in One Minute or Less
by Karl Montevirgen,
The StockCharts Insider
There are countless tools and strategies for gauging market sentiment. When combined, sure, they give you a full picture. But they also take time.
But what if you just need a quick vibe check? You plan to dig deeper later, but right now, you need a fast read to keep...
READ MORE