MEMBERS ONLY

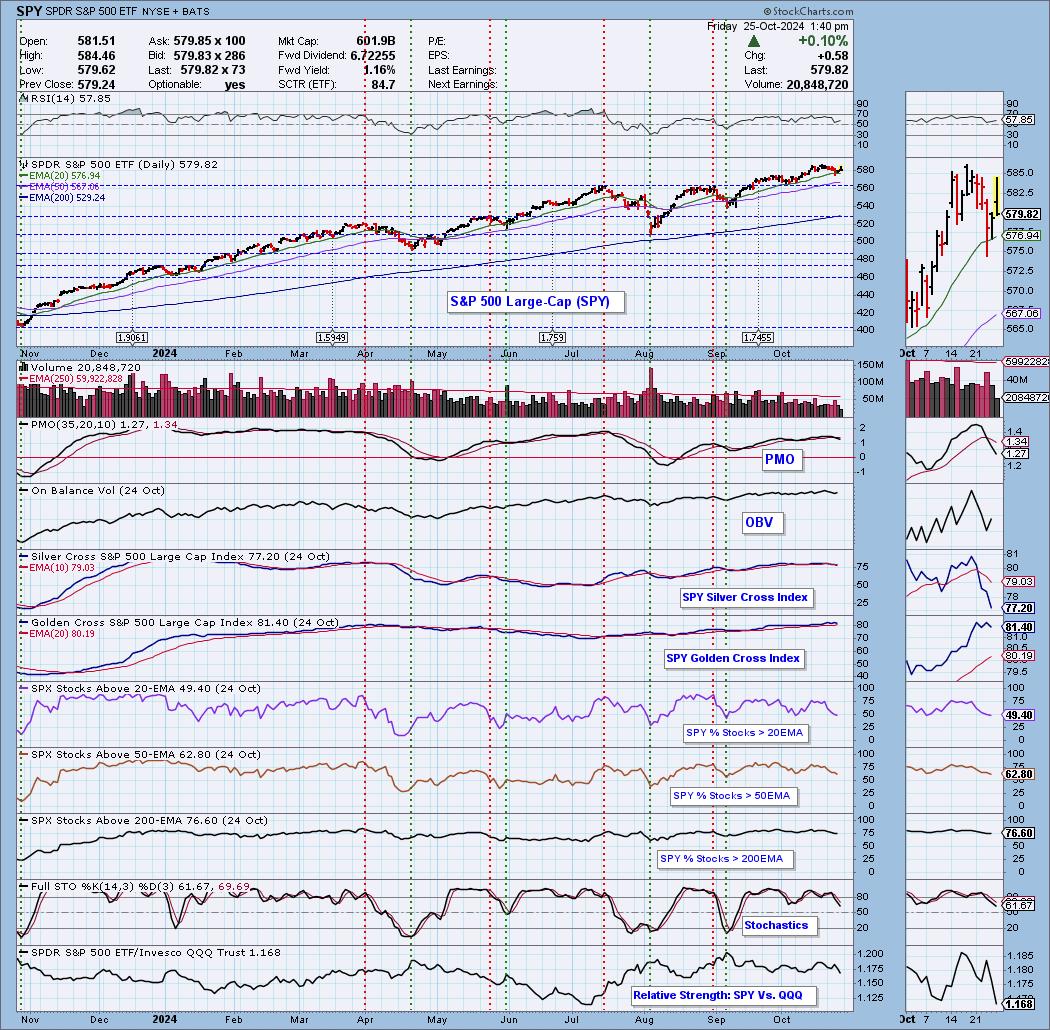
Price Momentum Oscillator (PMO) Internals Still a Problem

by Erin Swenlin,
Vice President, DecisionPoint.com
We noticed on Thursday evening how poor the internals were for the SPY, based on Price Momentum Oscillator (PMO) internals. These internals are the percent of stocks with rising PMOs and the percent of stocks with PMO Crossover BUY Signals. The accompanying short-term Swenlin Trading Oscillators (STOs), along with IT...
READ MORE
MEMBERS ONLY

Market Rotation Fueled by Large-Cap Growth (Again)

by Julius de Kempenaer,
Senior Technical Analyst, StockCharts.com
KEY TAKEAWAYS
* Large-cap stocks are pushing the market higher.
* Large-cap growth is the only segment driving the market.
* AAPL, TSLA, NVDA, and AMD are having trouble pushing higher.
Following the recent market fluctuations, with a sharp decline and a subsequent rally, it's crucial to examine these movements'...
READ MORE
MEMBERS ONLY

Will Breadth Divergences Signal the End of the Bull?

by David Keller,
President and Chief Strategist, Sierra Alpha Research
KEY TAKEAWAYS
* A negative McClellan Oscillator suggests short-term weakness in breadth conditions.
* About 30% of the S&P 500 members have already broken down below their 50-day moving average.
* The Bullish Percent Index has broken a key bearish threshold, indicating that many stocks have already begun bearish trends.
As...
READ MORE
MEMBERS ONLY

The SCTR Report: Learn How to Scan and Identify Winning Stocks

by Jayanthi Gopalakrishnan,
Director of Site Content, StockCharts.com
KEY TAKEAWAYS
* Use the SCTR scan to help you find technically strong stocks.
* Filter scan results further using additional criteria such as trends and momentum indicators.
* Narrow your analysis further with additional criteria and add the most likely candidates to a watchlist.
When the stock market hesitates to move in...
READ MORE
MEMBERS ONLY

Cruise Or Soar? Carnival, Delta, and United Hit New Highs—Which One's Your Best Bet?

by Karl Montevirgen,
The StockCharts Insider
KEY TAKEAWAYS
* Carnival Corp occupies the top spot for new highs across different timeframes.
* Delta Air Lines and United Airlines, two other transportation companies, have also gained new highs.
* Compare Carnival Corp, Delta, and United stock price action and determine which might present a strong opportunity in the coming weeks....
READ MORE
MEMBERS ONLY
Four Sectors That Have Just Experienced Bearish Weekly Action

by Martin Pring,
President, Pring Research
Most weekends, I flip through a chartlist featuring weekly bars and candles for sectors, country ETFs, currencies, bonds and some commodities. The idea is to see whether any of these entities are showing signs of bullish or bearish reversals. Most of the time, this fishing exercise does not uncover a...
READ MORE
MEMBERS ONLY
Top 5 Breadth Indicators You Can't Afford to Ignore!
by David Keller,
President and Chief Strategist, Sierra Alpha Research
In this video, Dave digs into five market breadth indicators every investor should track as we navigate a volatile period including Q3 earnings, the US elections, and the November Fed meeting. He breaks down key insights on each of the five charts, talks about why breadth indicators are equal-weighted, and...
READ MORE
MEMBERS ONLY
DP Trading Room: Magnificent Seven Earnings Preview
by Erin Swenlin,
Vice President, DecisionPoint.com
As part of today's coverage of the Magnificent Seven we remind you when the big mega-caps are reporting and give you are current perspective of each. We also cover all of the Magnificent Seven in the short and intermediate terms with daily and weekly charts.
Carl gives us...
READ MORE
MEMBERS ONLY

Two Indicators to Improve Your Edge

by Arthur Hill,
Chief Technical Strategist, TrendInvestorPro.com
KEY TAKEAWAYS
* Trend and momentum are proven concepts we can use to improve our edge.
* Longer timeframes are better for trend-momentum
* CandleGlance charts make it easy to rank and sort for momentum.
There are no magic bullets, but we can improve our trading edge by starting our selection process with...
READ MORE
MEMBERS ONLY
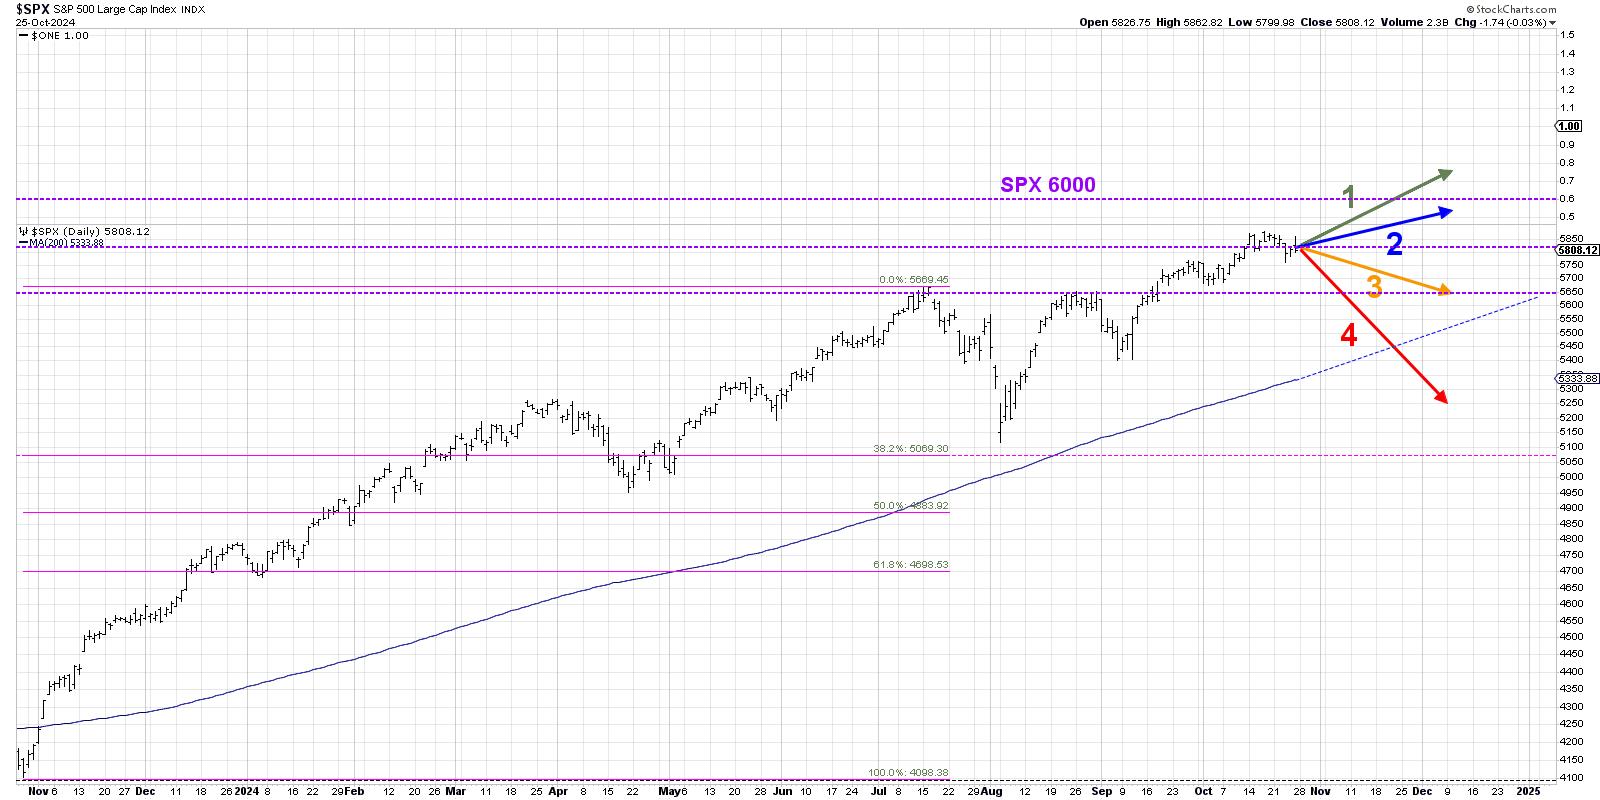
Why the S&P 500 Won't Break 6000 (Yet)
by David Keller,
President and Chief Strategist, Sierra Alpha Research
When I was growing up, I loved Choose Your Own Adventure books. I see the world in shades of gray instead of black-and-white, so I was immediately drawn to the seemingly endless scenarios that the main characters could experience as I made different choices for them.
As investors, we often...
READ MORE
MEMBERS ONLY
PMO SELL Signals on All Indexes But One
by Erin Swenlin,
Vice President, DecisionPoint.com
In today's article and video, we'll discuss the weakness that pervades nearly all index charts.
Over the past few days, many of the indexes have lost their PMO BUY Signals. Nearly all have crossed beneath their signal lines, with the exception of the Nasdaq which is...
READ MORE
MEMBERS ONLY

SCTR Report: Unlocking TSLA's Potential—What Every Investor Needs to Know Now
by Jayanthi Gopalakrishnan,
Director of Site Content, StockCharts.com
KEY TAKEAWAYS
* TSLA stock soared on upbeat Q3 earnings report.
* TSLA's stock price has broken above the upper Keltner Channel, indicating strength and the early stages of an uptrend.
* Adding a momentum indicator like the StochRSI to Tesla's stock analysis can help make smart trading decisions....
READ MORE
MEMBERS ONLY

Forex Secrets: How to Profit When EUR/USD Goes Nowhere
by Karl Montevirgen,
The StockCharts Insider
KEY TAKEAWAYS
* The Euro has been trading sideways against the US dollar for the past two years.
* If you switch to a mean-reversion mindset, this may present quite a few attractive opportunities.
* You could trade ETFs such as FXE and UUP as an alternative to trading forex currency pairs.
For...
READ MORE
MEMBERS ONLY
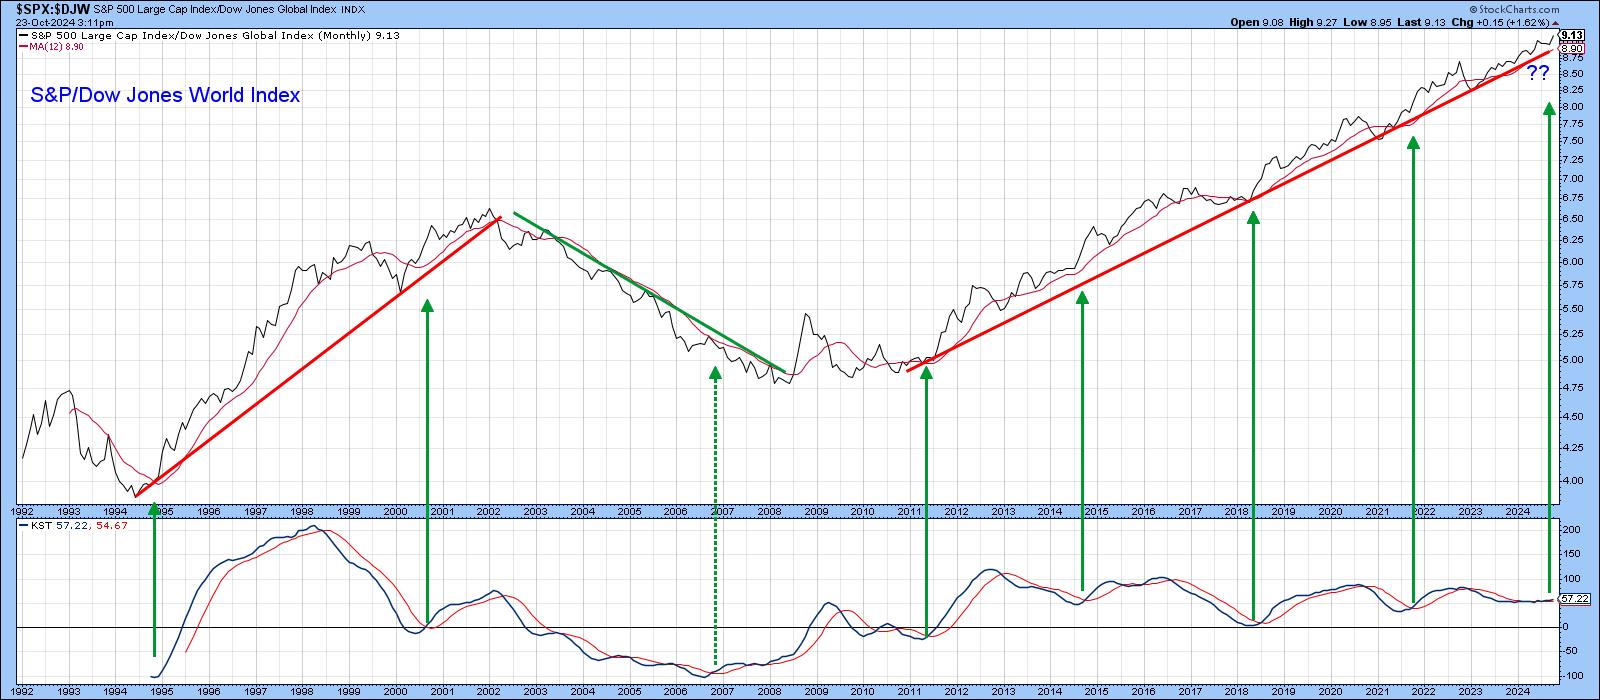
This Stock Market Will Likely Outperform the World Index, But Could Be Outshone by Something Completely Different
by Martin Pring,
President, Pring Research
Since 2011, the US stock market, represented by the S&P Composite, has outperformed the world. In the last couple of weeks or so, it has managed to break out from a trading range in its relationship with the rest of the world and looks headed even higher on...
READ MORE
MEMBERS ONLY

My Favorite RSI Signal

by Joe Rabil,
President, Rabil Stock Research
In this exclusive StockCharts video, Joe shows how he sets up the RSI 20 and 5 in ACP to save space and improve analysis. He explains how he uses RSI for both reading the trend and for fine-tuning entry in a strong trend. He gives examples using weekly, daily, and...
READ MORE
MEMBERS ONLY

Three Ways to Visualize the Start of a Potential Distribution Phase
by David Keller,
President and Chief Strategist, Sierra Alpha Research
KEY TAKEAWAYS
* The S&P 500 is nearing trendline support, which could provide a crucial signal of downside rotation.
* Market breadth indicators are beginning to diverge from the index, trending lower in the month of October.
* The MarketCarpet visualization shows a concerning drop in the mega-cap growth names which...
READ MORE
MEMBERS ONLY
Unlock the Secret To Finding Strong Stocks in Weak Markets
by Karl Montevirgen,
The StockCharts Insider
KEY TAKEAWAYS
* Predefined Scans is a tool you can use to find tradable opportunities in up and down markets.
* Coordinating your scans with the SCTR Report can increase your chances of finding strong stocks to trade.
* Applovin Corp has been on the radar for months, and its chart displays the...
READ MORE
MEMBERS ONLY

DP Trading Room: Which is Better? SP600 (IJR) or Russell 2000 (IWM)
by Erin Swenlin,
Vice President, DecisionPoint.com
Carl explores which index is best...the SP600 (IJR) or Russell 2000 (IWM). He makes a comparison over time and reveals which tends to be the better performer. Which one should you use to analyze what is happening in small-caps?
Carl gives us his market outlook as prices pullback today....
READ MORE
MEMBERS ONLY
Does the MACD Histogram Hold the Secret to Anticipating Trend Changes?
by David Keller,
President and Chief Strategist, Sierra Alpha Research
KEY TAKEAWAYS
* The MACD and PPO indicators are trend-following devices designed to confirm a trend reversal has occurred.
* The histogram shows when the MACD indicator is showing signs of a potential reversal, providing more of a leading indicator.
* Investors can use other indicators, such as the Chandelier Exit system, on...
READ MORE
MEMBERS ONLY
Using RRG To Find Best Three Stocks inside the DJ Industrials Index
by Julius de Kempenaer,
Senior Technical Analyst, StockCharts.com
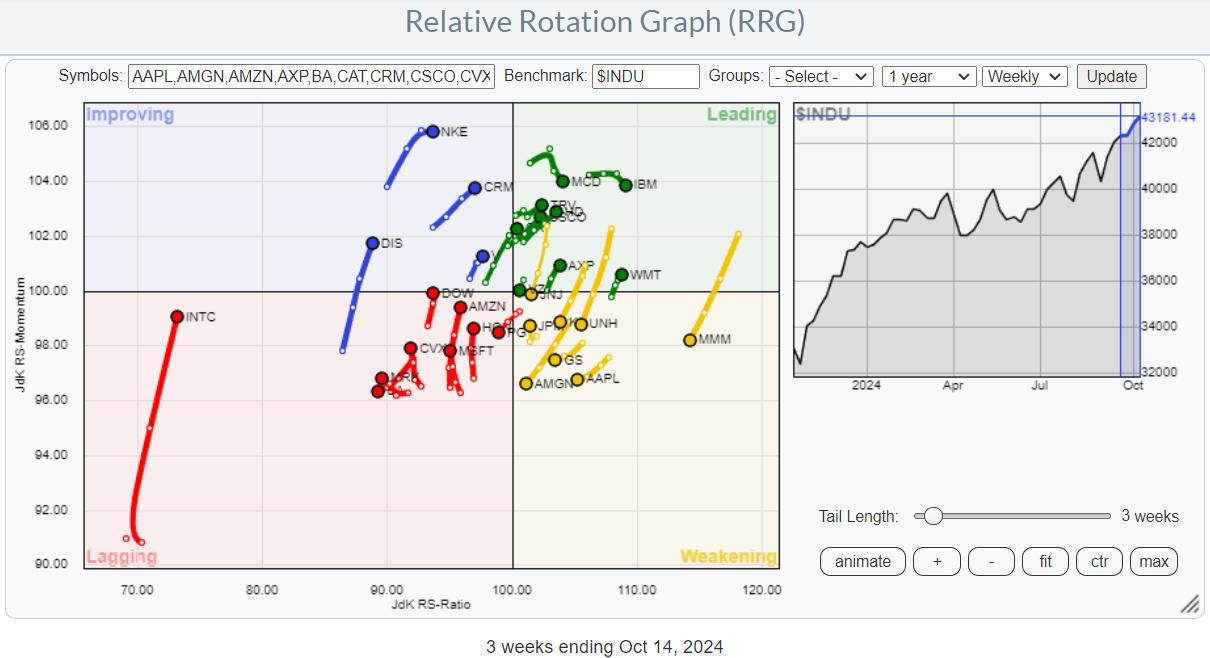
KEY TAKEAWAYS
* Sector Rotation Model and current sector rotation are not supporting broad market strength.
* Plotting the members of $INDU on a Relative Rotation Graph helps find the best names in that universe.
* TRV, WMT, and AXP are still strong, but now have too much risk for new positions.
* CAT,...
READ MORE
MEMBERS ONLY
Dell's Bullish Climb: Should You Get In Now?
by Karl Montevirgen,
The StockCharts Insider
KEY TAKEAWAYS
* Dell's stock price continues its near-term uptrend after bottoming in August.
* A cross above 70 in the SCTR line will signal increasing technical strength for Dell stock.
* Set price alerts for Dell stock so you're notified when the stock price hits a specific threshold....
READ MORE
MEMBERS ONLY
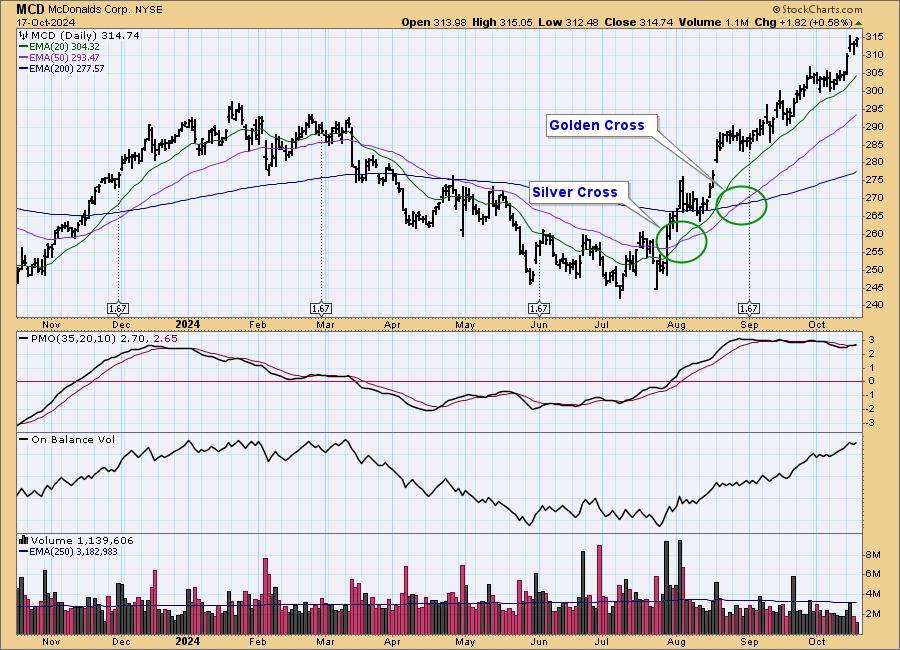
Signal Scoreboard As Good As It Gets

by Carl Swenlin,
President and Founder, DecisionPoint.com
At DecisionPoint, we track intermediate-term and long-term BUY/SELL signals on twenty-six market, sector, and industry group indexes. The long-term BUY signals are based upon the famous Golden Cross, which is when the 50-day moving average crosses up through the 200-day moving average. (We use exponential moving averages -- EMAs....
READ MORE
MEMBERS ONLY

Why the MACD Crossover Signal is SO Important
by Joe Rabil,
President, Rabil Stock Research
In this exclusive StockCharts TV video, Joe shares the MACD downside crossover signal and explains the different ways it can play out when it takes place above the MACD zero line. These downside crossovers can lead to opportunities depending on other criteria, including the ADX action. He then shows how...
READ MORE
MEMBERS ONLY

Sector Rotation is Giving Conflicting Stories!
by Julius de Kempenaer,
Senior Technical Analyst, StockCharts.com
In this video from StockCharts TV,Julius dives in to the sector rotation model, trying to find any alignment between theoretical and real-life rotations of sectors in combination with the economic cycle. The positions of the various sectors and the economic indicators that are part of this model are not...
READ MORE
MEMBERS ONLY

The Master Sentiment Chart You Need to Follow
by David Keller,
President and Chief Strategist, Sierra Alpha Research
KEY TAKEAWAYS
* The put/call ratio measures volumes in the options market to compare bullish vs. bearish positioning.
* The AAII Survey is close to the 50% bullish level, which often coincides with major market tops.
* The NAAIM Exposure Index, currently just above 90%, tells us that money managers are not...
READ MORE
MEMBERS ONLY

SCTR Report: American Tower is Breaking Out Now; Don't Miss It!
by Jayanthi Gopalakrishnan,
Director of Site Content, StockCharts.com
KEY TAKEAWAYS
* American Tower is a Real Estate Investment Trust (REIT) stock that's on the verge of an upside breakout.
* The weekly chart of American Tower shows clear resistance and support levels that can help identify entry points.
* Look for American Tower's stock price to reach...
READ MORE
MEMBERS ONLY

The Next Big Move in Yields May Be Different Than You Think
by Martin Pring,
President, Pring Research
Below, Chart 1 shows a weekly plot for the 30-year yield, where we can see a perfectly formed top whose completion was followed by a negative 65-week EMA crossover. At the time of the breakdown, there were few grounds for suspecting a false break. However, in the last couple of...
READ MORE
MEMBERS ONLY
Stay Ahead: Key Sentiment Indicators to Track in October 2024!
by David Keller,
President and Chief Strategist, Sierra Alpha Research
Which market sentiment indicators should we follow to validate the current bull market phase and anticipate a potential market top? David Keller, CMT breaks down three sentiment indicators he's watching in October 2024, explains their calculations and methodology, reviews their signals during previous bull market cycles, and describes...
READ MORE
MEMBERS ONLY
DP Trading Room: NVDA Lifts Semiconductors Higher
by Erin Swenlin,
Vice President, DecisionPoint.com
It's time to put Semiconductors in the spotlight. NVDA is starting to trade at all-time highs again and that is likely to bring the Semiconductor industry group up to its own all-time highs. Erin discusses Semiconductors "under the hood" and highlights the NVDA chart.
Carl brings...
READ MORE
MEMBERS ONLY
Cybersecurity ETF Comes to Life with New Trending Phase
by Arthur Hill,
Chief Technical Strategist, TrendInvestorPro.com
KEY TAKEAWAYS
* Stocks go through trending and non-trending phases.
* Non-trending phases often last longer than trending phases.
* CIBR recently broke out and started a new trending phase.
The Cybersecurity ETF (CIBR) is resuming the lead as it surged to new highs this past week. It is important to note that...
READ MORE
MEMBERS ONLY

The One Volume Indicator You Should Follow
by David Keller,
President and Chief Strategist, Sierra Alpha Research
KEY TAKEAWAYS
* While the daily volume reading can give us limited insight on the balance of buyers and sellers, Chaikin Money Flow gives a much clearer picture of trends in volume.
* Major tops in the last 12-18 months have been marked with a particular pattern in the S&P...
READ MORE
MEMBERS ONLY

Small-Caps Get on Board!
by Erin Swenlin,
Vice President, DecisionPoint.com
Yesterday, we posted a short video about the lack of participation within the mid-and small-cap universes. Here, we had a rally to new all-time highs, yet we weren't seeing much of anything out of the broad market. Today was a reversal of fortune for these indexes, which rallied...
READ MORE
MEMBERS ONLY
It's Large-Cap Growth Stocks (Mag 7) Once Again
by Julius de Kempenaer,
Senior Technical Analyst, StockCharts.com
KEY TAKEAWAYS
* SPY is starting to resolve its negative divergence with RSI.
* Large-cap growth is coming back into favor.
* Magnificent 7 stocks provided 2.9% of the S&P 50's 6.8% performance over the past five weeks.
Where is the Recent Performance in the S&...
READ MORE
MEMBERS ONLY
Alert: Small-Caps Not Participating in New All-Time Highs
by Erin Swenlin,
Vice President, DecisionPoint.com
DecisionPoint has started posting short video alerts on our YouTube Channel. These videos are less than four minutes and give you the scoop on news you need to know about the market right now. Subscribe to the DecisionPoint.com YouTube Channel HERE so you'll be notified when these...
READ MORE
MEMBERS ONLY

What's Wrong With This SPX Breakout?
by Joe Rabil,
President, Rabil Stock Research
In this exclusive StockCharts TV video, Joe presents the price pattern to follow the recent breakout in the S&P 500. He discusses narrow range bars, wide range bars and when they are important. Joe then explains what needs to take place now to either confirm a breakout or...
READ MORE
MEMBERS ONLY

Three Thoughts on Risk Management for October 2024
by David Keller,
President and Chief Strategist, Sierra Alpha Research
KEY TAKEAWAYS
* Watch the S&P 500's "line in the sand" for a signs of a breakdown in the major averages.
* Market breadth indicators could provide an early warning of a potential breakdown for the benchmarks.
* By being thoughtful about your position sizing for each...
READ MORE
MEMBERS ONLY

SCTR Report: Carvana Stock Skyrockets, Hits a New 52-Week High -- What This Means for Investors
by Jayanthi Gopalakrishnan,
Director of Site Content, StockCharts.com
KEY TAKEAWAYS
* Carvana stock is back on top of the Top 10 Large-Cap SCTR Report.
* If you have a long position in Carvana, monitor your positions carefully.
* The stock has the potential to rise much higher, so enjoy the ride while you can.
Apologies for revisiting Carvana (CVNA), but it...
READ MORE
MEMBERS ONLY

Why This S&P Support Level is SO IMPORTANT
by Julius de Kempenaer,
Senior Technical Analyst, StockCharts.com
In this video from StockCharts TV,Julius presents a few conflicting rotations and signals that continue to warrant caution while the S&P 500 keeps hovering just above support. With the negative divergences between price and MACD/RSI remaining intact, SPY should not break 565. Julius looks at rotations...
READ MORE
MEMBERS ONLY

Oil Prices Soar Amid Middle East Tensions – What's Next for Gas Prices?
by Karl Montevirgen,
The StockCharts Insider
KEY TAKEAWAYS
* Crude oil prices spiked, largely due to tensions in the Middle East.
* Gasoline prices are following crude oil prices.
* An analysis of the charts of crude oil and gasoline prices show potential trading opportunities.
Monday saw something of a bloodbath on Wall Street, with the Dow ($INDU) plunging...
READ MORE
MEMBERS ONLY

Market Top in October? 2007 vs. 2024
by David Keller,
President and Chief Strategist, Sierra Alpha Research
Will we see a major market top during the month of October? Dave breaks down three market breadth indicators and compares their current configuration to what we observed at the 2007 market top. He then goes through the charts and reviews market topping conditions from a breadth perspective using the...
READ MORE