MEMBERS ONLY

Did We Just See a False Breakdown in Crude Oil?

by Martin Pring,
President, Pring Research
Using West Texas Crude, Chart 1 features one of my favorite techniques for identifying changes in long-term trends, which is simply a PPO using the 6- and 15-month parameters. When it is above zero, it's bullish, and when below, bearish. The pink shading indicates bearish periods, and the...
READ MORE
MEMBERS ONLY

DP Trading Room: A Case for a Market Top

by Erin Swenlin,
Vice President, DecisionPoint.com
During today's market analysis Carl laid out his reasons why we believe we are at a market top. He discusses the current market price action combined with exclusive DecisionPoint indicators to substantiate his position. Don't miss his analysis.
Carl also goes though the Magnificent Seven by...
READ MORE
MEMBERS ONLY
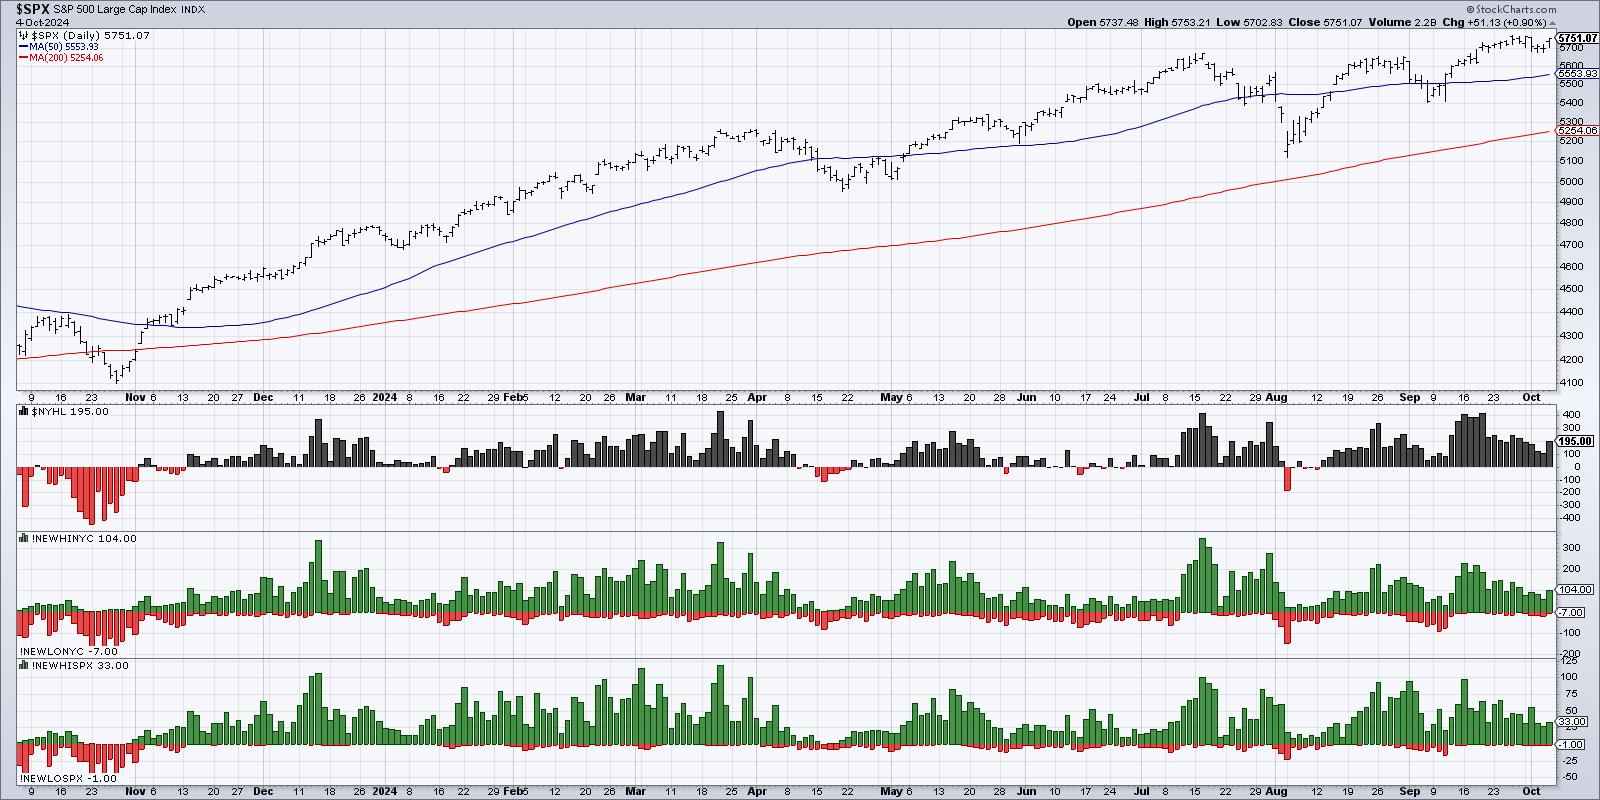
Does the Market Have Bad Breadth?

by David Keller,
President and Chief Strategist, Sierra Alpha Research
KEY TAKEAWAYS
* There have been less new 52-week highs since mid-September, suggesting leaders are falling off.
* The percent of S&P 500 members above their 50-day moving average is below 75%, which often serves as a threshold for a downturn.
* The S&P 500 Bullish Percent Index remains...
READ MORE
MEMBERS ONLY
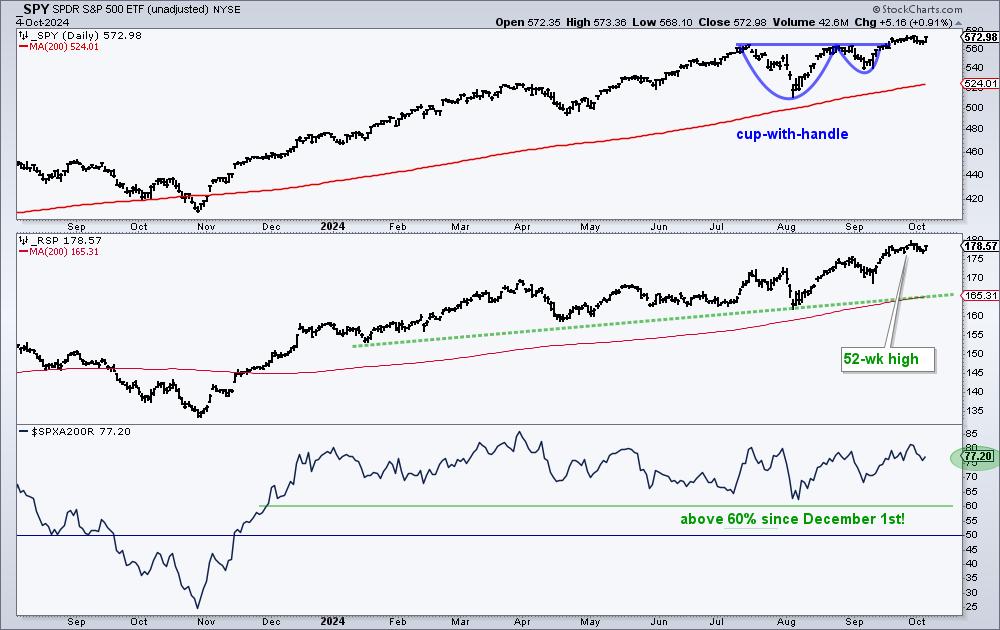
What More do the Bulls Want?

by Arthur Hill,
Chief Technical Strategist, TrendInvestorPro.com
KEY TAKEAWAYS
* Over 70% of S&P 500 stocks are above their 200-day SMAs.
* SPY and RSP are trading near new highs.
* We see a bullish continuation pattern in a key AI stock.
It is a bull market for stocks. On the chart below, the S&P 500...
READ MORE
MEMBERS ONLY

Will Technology Drive S&P Higher in October?

by Julius de Kempenaer,
Senior Technical Analyst, StockCharts.com
In this video from StockCharts TV,Julius explores the October seasonal outlook for the S&P 500 and various sectors. Seasonality suggests a potential rise in the S&P 500, fueled by strength in technology, but there are still concerns about the ongoing negative divergence between price and...
READ MORE
MEMBERS ONLY

Gold Price Surge: What Goldman Sachs' $2,900 Forecast Means for Investors

by Karl Montevirgen,
The StockCharts Insider
KEY TAKEAWAYS
* Goldman Sachs just raised their price target for gold to $2,900 an ounce.
* Goldman Sachs' price target roughly equals $280 in SPDR Gold Shares ETF (GLD).
* GLD could have more room to run.
Here's the issue with gold: it's difficult to find...
READ MORE
MEMBERS ONLY

China Stocks May Be On to Something
by Martin Pring,
President, Pring Research
China's stock market exploded last week in an amazing rally, so formidable that it raises the question of whether it could be the start of a new bull market, or just a short-covering rally which will quickly fizzle out. In that respect, it's important to note...
READ MORE
MEMBERS ONLY

SCTR Report: Vistra Energy Soars, Reaches New All-Time High

by Jayanthi Gopalakrishnan,
Director of Site Content, StockCharts.com
KEY TAKEAWAYS
* Vistra Energy can be a big player in providing nuclear power to AI companies.
* Vistra Energy's stock price has hit an all-time high.
* There are support levels on the daily price chart that could present buying opportunities in VST.
Utility stocks are now becoming cool. Going...
READ MORE
MEMBERS ONLY

With 2024 Q2 Earnings In, Market Remains Very Overvalued

by Carl Swenlin,
President and Founder, DecisionPoint.com
S&P 500 earnings are in for 2024 Q2, and here is our valuation analysis.
The following chart shows the normal value range of the S&P 500 Index, indicating where the S&P 500 would have to be in order to have an overvalued P/E...
READ MORE
MEMBERS ONLY

Traders are Eyeing These Metals After China's Big Economic Shift: Here's What You Need to Know
by Karl Montevirgen,
The StockCharts Insider
KEY TAKEAWAYS
* Metals appear to be reacting bullishly after China injected more stimulus into its economy.
* Gold, silver, and copper are displaying unique patterns and structures.
* Keep an eye on momentum for clues as to each metal's likely move within the context of its current pattern.
China'...
READ MORE
MEMBERS ONLY
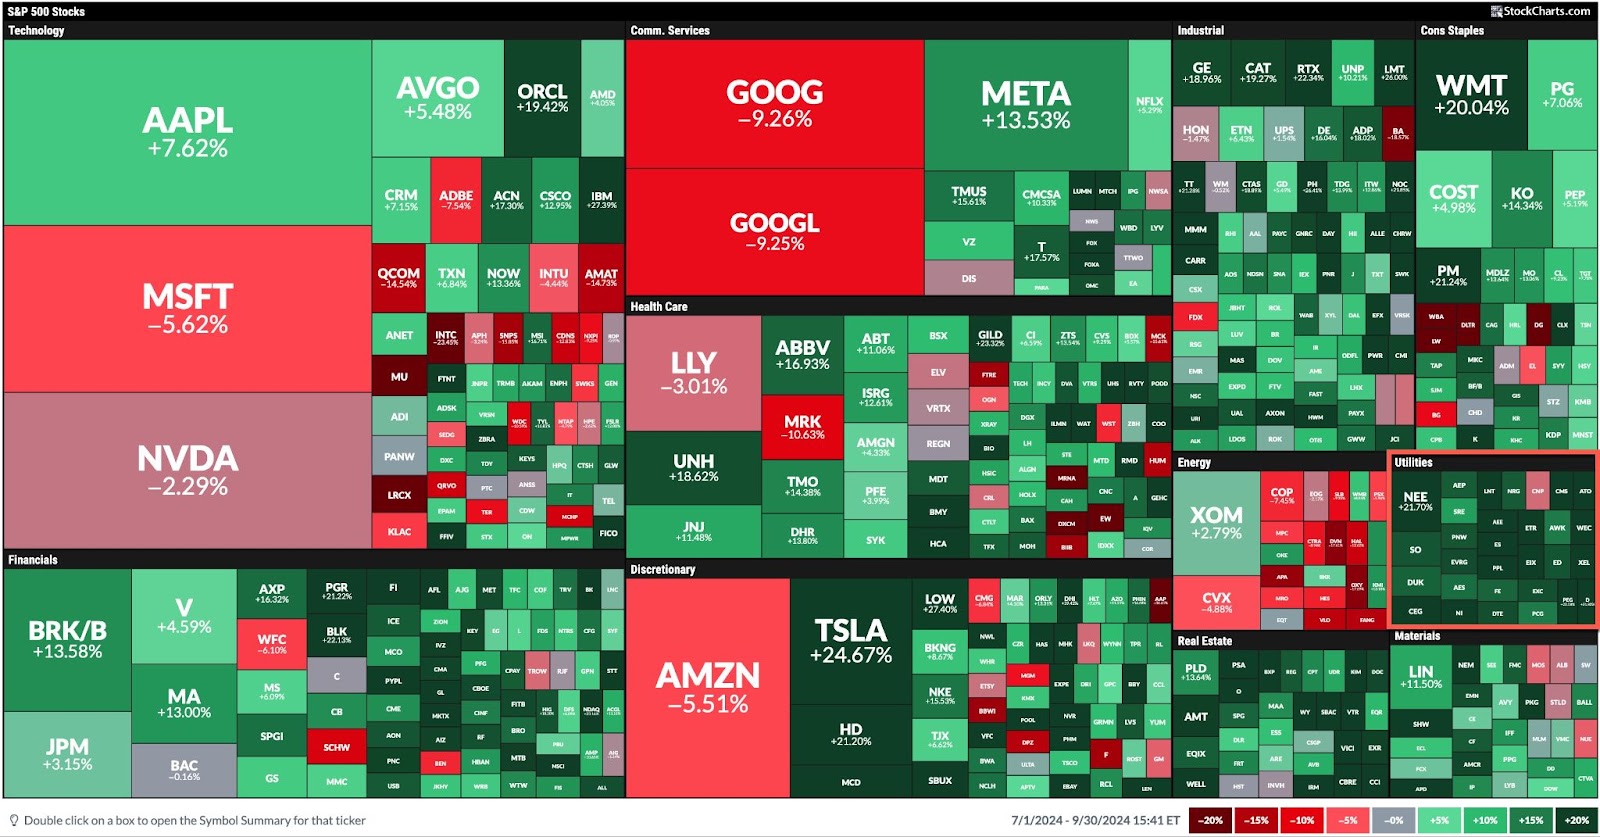
Stock Market's Spectacular Q3: Highest Sector Performer is Utilities
by Jayanthi Gopalakrishnan,
Director of Site Content, StockCharts.com
KEY TAKEAWAYS
* The leading sector performer in Q3 was Utilities, up by 19.35%.
* Utility stocks are gaining attention because of their ability to power up AI companies.
* Many utility stocks provide dividends, which could add some extra cash to your portfolio.
September, typically considered to be the weakest month...
READ MORE
MEMBERS ONLY

DP Trading Room: Uncovering Stocks from DP Scan Alerts
by Erin Swenlin,
Vice President, DecisionPoint.com
In today's free DecisionPoint Trading Room, Erin pulls out her exclusive DecisionPoint Diamond Scans and finds us some new and interesting stock symbols to explore further. These scans are very powerful and bring the best charts to your attention. DecisionPoint has a new Scan Alert System for purchase...
READ MORE
MEMBERS ONLY

Top Ten Charts to Watch for October 2024
by David Keller,
President and Chief Strategist, Sierra Alpha Research
As we near the end of what has been a fairly solid Q3 for the equity markets, we are left with the eternal question for investors: "What's next?"
We now have the Fed's first rate cut in the rearview mirror, with multiple rate cuts...
READ MORE
MEMBERS ONLY

This Week's "Sector to Watch" and "Industry Group to Watch"
by Erin Swenlin,
Vice President, DecisionPoint.com
On Friday mornings in our DP Diamonds subscriber-only trading room, the DecisionPoint Diamond Mine, I like to look for a "Sector to Watch" and an "Industry Group to Watch" within. These are for your watchlist and not necessarily ready for immediate investment. In the case of...
READ MORE
MEMBERS ONLY

Unlocking GDX's Short-Term Potential: How to Nail the Measured Move Strategy
by Karl Montevirgen,
The StockCharts Insider
KEY TAKEAWAYS
* VanEck Vectors Gold Miners ETF (GDX) broke above its recent highs, confirming a continued uptrend.
* GDX displayed a short-term trading setup that was apparent in its price chart.
* The "measured move" rule can exploit an obvious short-term trading opportunity in GDX.
A few weeks back, two...
READ MORE
MEMBERS ONLY

Opportunities in Industrials and Materials
by Julius de Kempenaer,
Senior Technical Analyst, StockCharts.com
KEY TAKEAWAYS
* Negative divergence remains a distracting factor
* Defensive rotation still present
* Industrials and Materials on positive track toward leading RRG quadrant
Despite a backdrop of conflicting market signals, there are still sectors within the S&P 500 that are showing promising movements and potential opportunities for investors. Today,...
READ MORE
MEMBERS ONLY

SCTR Report: China Adds More Stimulus, FXI in Second Position
by Jayanthi Gopalakrishnan,
Director of Site Content, StockCharts.com
KEY TAKEAWAYS
* iShares China Large-Cap ETF (FXI) gains technical strength and has made it to second position in the StockCharts Technical Rank (SCTR).
* FXI could be in the early stages of a bull rally, so keep an eye on this ETF.
* Set your price target levels for entry and exit...
READ MORE
MEMBERS ONLY

How to Use the ADX Indicator (Trend Strength Explained)

by Joe Rabil,
President, Rabil Stock Research
In this exclusive StockCharts TV video, Joe presents an introduction to the Average Directional Index (ADX), sharing how it is calculated and how to use it. He highlights some of the strengths, and weaknesses, of this powerful indicator. He then analyzes Bitcoin, NVDA, and AVGO, and finishes up the show...
READ MORE
MEMBERS ONLY

How to Spot the Perfect Buying Opportunity in XLRE
by Karl Montevirgen,
The StockCharts Insider
KEY TAKEAWAYS
* Investors began piling into real estate stocks over the last three months.
* XLRE is now just under 1% from its 52-week high, as indicated by the Distance From Highs indicator.
* With a potential dip on the horizon in XLRE, watch these levels to spot zones of opportunity from...
READ MORE
MEMBERS ONLY

The Dollar Index is Down, But Is It Out?
by Martin Pring,
President, Pring Research
The Dollar Index has been selling off sharply in the last few weeks and has now reached critical support in the form of the lower part of its recent trading range. The big question is whether it will break below the range or extend it in any way.
Chart 1...
READ MORE
MEMBERS ONLY

DP Trading Room: Analyzing Two New Stocks in SP500 (DELL, PLTR)
by Erin Swenlin,
Vice President, DecisionPoint.com
In today's free DP Trading Room Carl reviews the charts of two new members to the SP500, Dell (DELL) and Palantir (PLTR). Are they poised to break out on this news?
Carl also discussed the inflation on housing prices to open the show. Before going over the signal...
READ MORE
MEMBERS ONLY

Bullish or Bearish? The Truth About Rate Cuts and Stock Performance
by David Keller,
President and Chief Strategist, Sierra Alpha Research
So the first Fed rate cut is behind us, and we are no longer in a "higher for longer" period, but in a new rate cut cycle which will most likely last well into 2025. So that's good news for stocks, right? Well, not necessarily.
The...
READ MORE
MEMBERS ONLY

Dow Jones in the Spotlight, Bonds Stabilize, Tech Plays Catch-Up
by Jayanthi Gopalakrishnan,
Director of Site Content, StockCharts.com
KEY TAKEAWAYS
* The Dow Jones Industrial Average closed at a new all-time high.
* Stock market indexes still have bullish momentum in spite of up and down movement.
* Bond prices could stabilize after digesting the interest rate cut.
The Federal Reserve's interest rate cut decision on Wednesdaywas like receiving...
READ MORE
MEMBERS ONLY

A Sector Rotation Dilemma ...
by Julius de Kempenaer,
Senior Technical Analyst, StockCharts.com
KEY TAKEAWAYS
* Sector Rotation remains defensive
* S&P chart showing resemblence to late 2021
* Negative divergences still in play
First of all, I apologize for my absence this week. I caught something that looked like Covid, and felt like Covid, but it did not identify (pun intended) as Covid....
READ MORE
MEMBERS ONLY
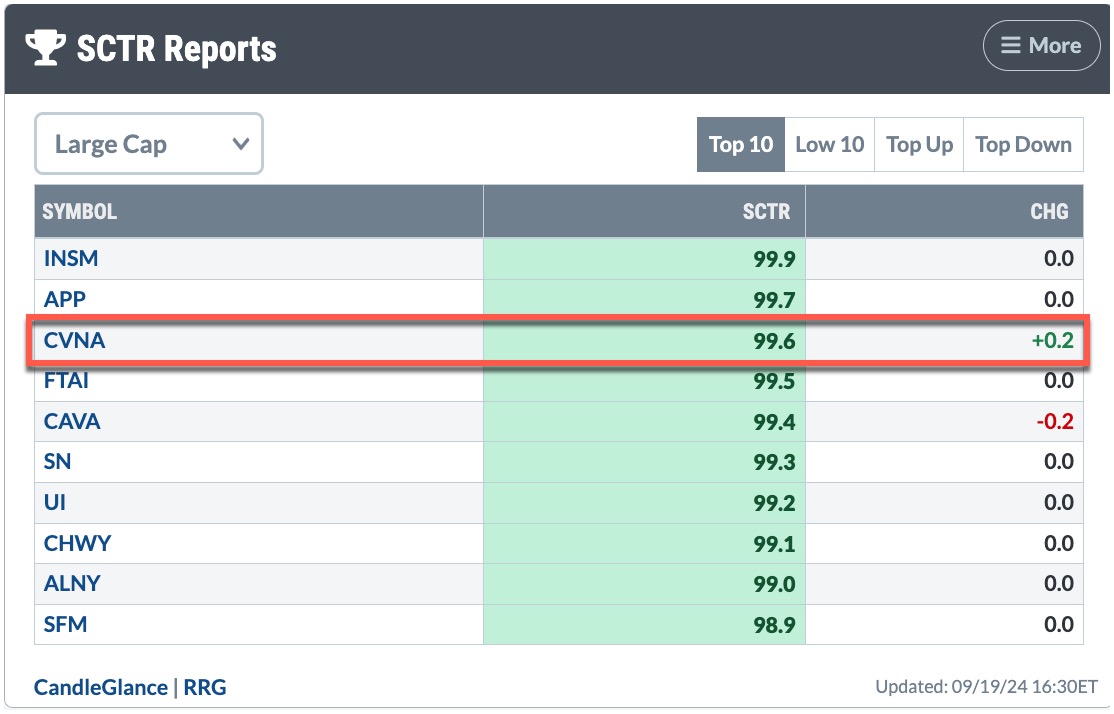
The SCTR Report: Carvana's Gain Makes It Worth a Revisit
by Jayanthi Gopalakrishnan,
Director of Site Content, StockCharts.com
KEY TAKEAWAYS
* Carvana stock fell behind in its ranking during its August–September pullback, but it's now gaining momentum.
* From a weekly perspective, the uptrend in Carvana looks solid.
* Watch the Fibonacci retracement levels on the weekly chart to identify your entry and exit points.
On August 5,...
READ MORE
MEMBERS ONLY

This S&P 500 Rally is Defying the Experts – Here's What You Need to Know
by Karl Montevirgen,
The StockCharts Insider
KEY TAKEAWAYS
* Wells Fargo analysts issued a warning about the current rally.
* Their last warning in November 2023 may have caused many investors to have missed out on a huge move.
* Analysts can be right or wrong, so it's important to watch key technical levels.
If you logged...
READ MORE
MEMBERS ONLY

DP Trading Room: Tracking Gold Sentiment
by Erin Swenlin,
Vice President, DecisionPoint.com
As part of Carl's review of Gold charts, he explained how we use the close-ended fund, Sprott Physical Gold Trust (PHYS) to measure sentiment for Gold. Depending on how PHYS trades, it trades at a discount or premium based on the physical Gold that it holds. These discounts...
READ MORE
MEMBERS ONLY

An Indicator to Reduce Whipsaws and Ride Trends
by Arthur Hill,
Chief Technical Strategist, TrendInvestorPro.com
KEY TAKEAWAYS
* Whipsaws and losing trades are part of the process for trend-following strategies.
* These strategies are profitable because average profits far exceed average losses.
* Chartists can reduce whipsaws by adding signal thresholds to the 5/200 day SMA cross.
Whipsaws and losing trades are part of the process for...
READ MORE
MEMBERS ONLY

A Déjà Vu in The Consumer Staples Sector Sends a Strong Warning Signal
by Julius de Kempenaer,
Senior Technical Analyst, StockCharts.com
KEY TAKEAWAYS
* Tech bounce is judged as recovery within downtrend.
* XLP, XLF, and XLV are positioned for outperformance in coming weeks.
* The XLP chart is showing interesting characteristics which we have seen before
Tech Rallies, But Remains Inside the Lagging Quadrant
A quick look at the Relative Rotation Graph for...
READ MORE
MEMBERS ONLY
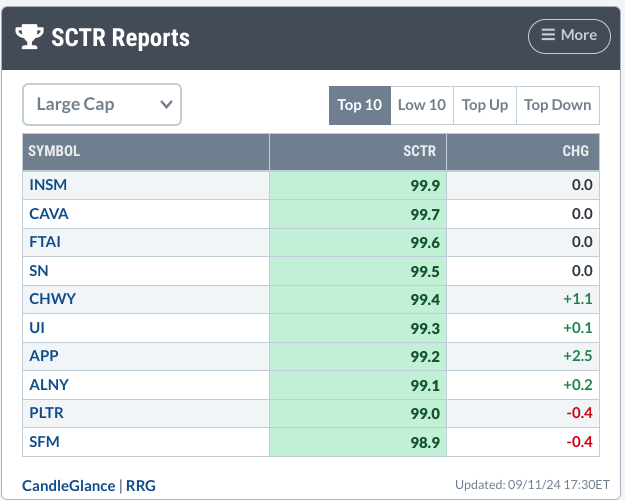
The SCTR Report: Insmed's Stock Hangs in the Balance—Here's What You Need to Know
by Karl Montevirgen,
The StockCharts Insider
KEY TAKEAWAYS
* Insmed (INSM) has been near the top of the StockCharts SCTR report for weeks.
* Insmed's stock price has pulled back, but maintained its high SCTR score.
* Insmed could be posed for an upside move.
Numerous companies are making strides within their respective sectors, but, unless you...
READ MORE
MEMBERS ONLY
Stock Market Today: Are Big Tech Growth Stocks Back in the Spotlight?
by Jayanthi Gopalakrishnan,
Director of Site Content, StockCharts.com
KEY TAKEAWAYS
* Stocks rebounded on Wednesday with wide trading ranges.
* Investors are rotating back into large-cap growth and momentum stocks.
* The Financial sector was hit hard by negative news from banks but made some recovery.
It was a massive turnaround day in the market on Wednesday—stocks sold off after...
READ MORE
MEMBERS ONLY

DP Trading Room: AI Bubble Deflating
by Erin Swenlin,
Vice President, DecisionPoint.com
The recent decline last week revealed that the artificial intelligence bubble is deflating. Magnificent Seven stocks are unwinding in response to investors losing confidence in the AI trade in general. Carl gives us a complete picture of the Magnificent Seven in the short and intermediate terms. It doesn't...
READ MORE
MEMBERS ONLY

Market Timing for a Rules-Based Strategy
by Arthur Hill,
Chief Technical Strategist, TrendInvestorPro.com
KEY TAKEAWAYS
* Chartists need a market timing mechanism to assess risk
* Risk is above average during bear markets (preserve capital)
* Risk levels are acceptable during bull markets (invest capital)
Any strategy that trades stocks needs some sort of market timing mechanism to identify bull and bear markets. Typically, stock strategies...
READ MORE
MEMBERS ONLY

Four Intermarket Confidence Relationships that Aren't Confident
by Martin Pring,
President, Pring Research
Most of the primary trend indicators I follow are in a bullish mode and show few signs of flagging. That said, some intermarket relationships, which help to indicate whether the environment is risk-off or risk-on, have started to move in a risk-off direction. That's usually a bearish omen...
READ MORE
MEMBERS ONLY
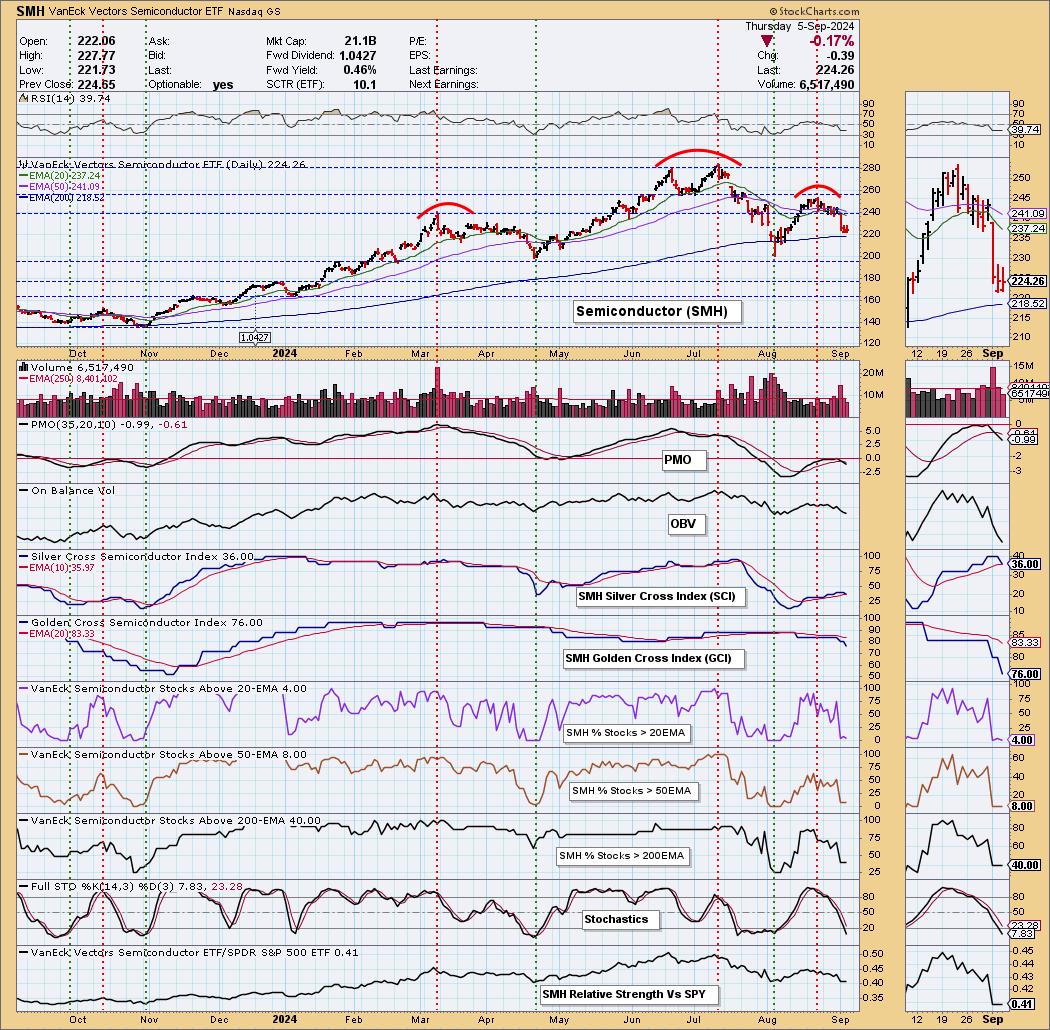
Intermediate-Term Bearish Head & Shoulders on Semiconductors (SMH)
by Erin Swenlin,
Vice President, DecisionPoint.com
We are always on the lookout for chart patterns. Recently, we've found a bearish head-and-shoulders developing on Semiconductors (SMH).
Looking at the daily chart below, we can see the pattern developing. However, we do have to point out participation. Note the very low percentages on %Stocks > 20/...
READ MORE
MEMBERS ONLY
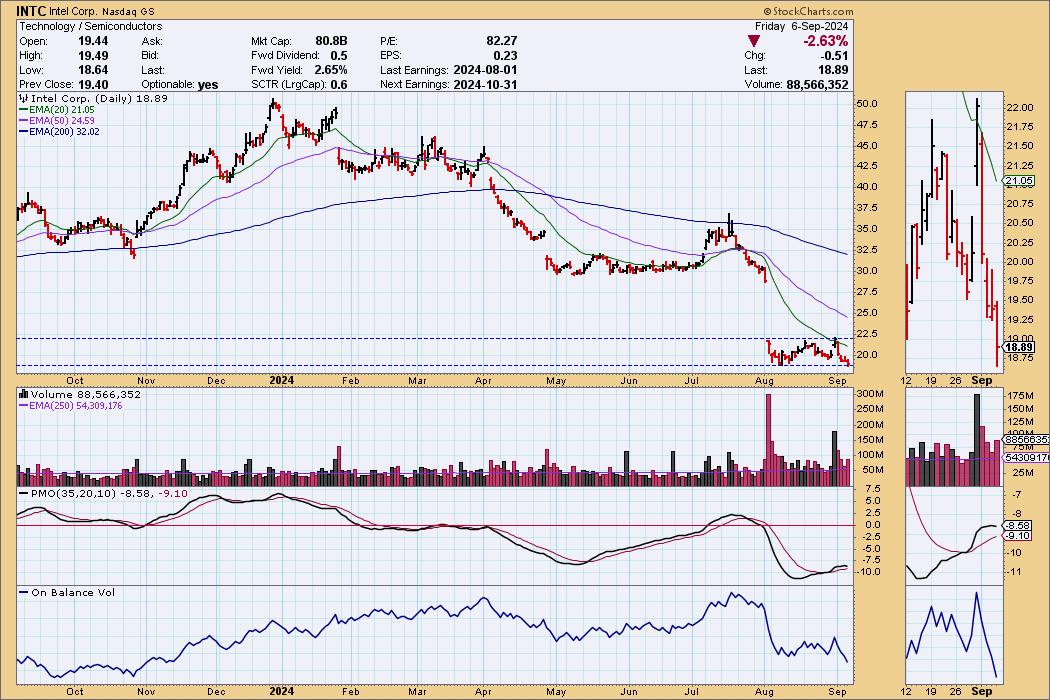
Is It Time to Buy Intel?
by Carl Swenlin,
President and Founder, DecisionPoint.com
I've been around long enough to remember when Intel (INTC) was the NVIDIA of the day. Now, INTC is under severe pressure, having suspended its dividend, and is currently being considered for removal from the Dow 30 Industrial Average. Oh, how the mighty have fallen!
With INTC having...
READ MORE
MEMBERS ONLY

The SCTR Report: Why TSLA Stock Sees Tremendous Strength
by Jayanthi Gopalakrishnan,
Director of Site Content, StockCharts.com
KEY TAKEAWAYS
* Tesla's stock price has been gaining technical strength, evident from its daily and weekly price charts.
* An analysis of Tesla's stock price shows a potential intermediate-term trading opportunity.
* Before entering a buy position, be sure to identify your entry and exit positions.
When the...
READ MORE
MEMBERS ONLY
The Best Reversal Patterns (Trading Strategy Explained)
by Joe Rabil,
President, Rabil Stock Research
In this exclusive StockCharts TV video, Joe shares how he identifies and trades a reversal pattern. Highlighting what causes him to focus in on a stock, he shares the 1-2-3 reversal pattern, along with the keys in MACD and ADX that allow you to improve the risk/reward equation in...
READ MORE
MEMBERS ONLY

How to Spot a Hedge Fund Trap: MicroStrategy's Dramatic Plunge
by Karl Montevirgen,
The StockCharts Insider
KEY TAKEAWAYS
* In March 2024, certain hedge funds began heavily shorting MicroStrategy stock.
* Microstrategy was a meme stock that surged 300% from February to March.
* While many investors got burned when Microstrategy's price tanked, there were clues that short sellers were taking over the stock.
In early 2024,...
READ MORE
MEMBERS ONLY
Stock Market Today: Tech Tumbles as Mega-Cap Stocks Get Hit by Major Profit-Taking
by Jayanthi Gopalakrishnan,
Director of Site Content, StockCharts.com
KEY TAKEAWAYS
* Semiconductor stocks get slammed
* Volatility rises as investors become more fearful of more selling pressure ahead
* Investors should be extremely cautious as Broadcom earnings and Non-Farm Payrolls could impact the stock market
I hope you had a relaxing, restful long weekend, and welcome to September.
It was a...
READ MORE