MEMBERS ONLY
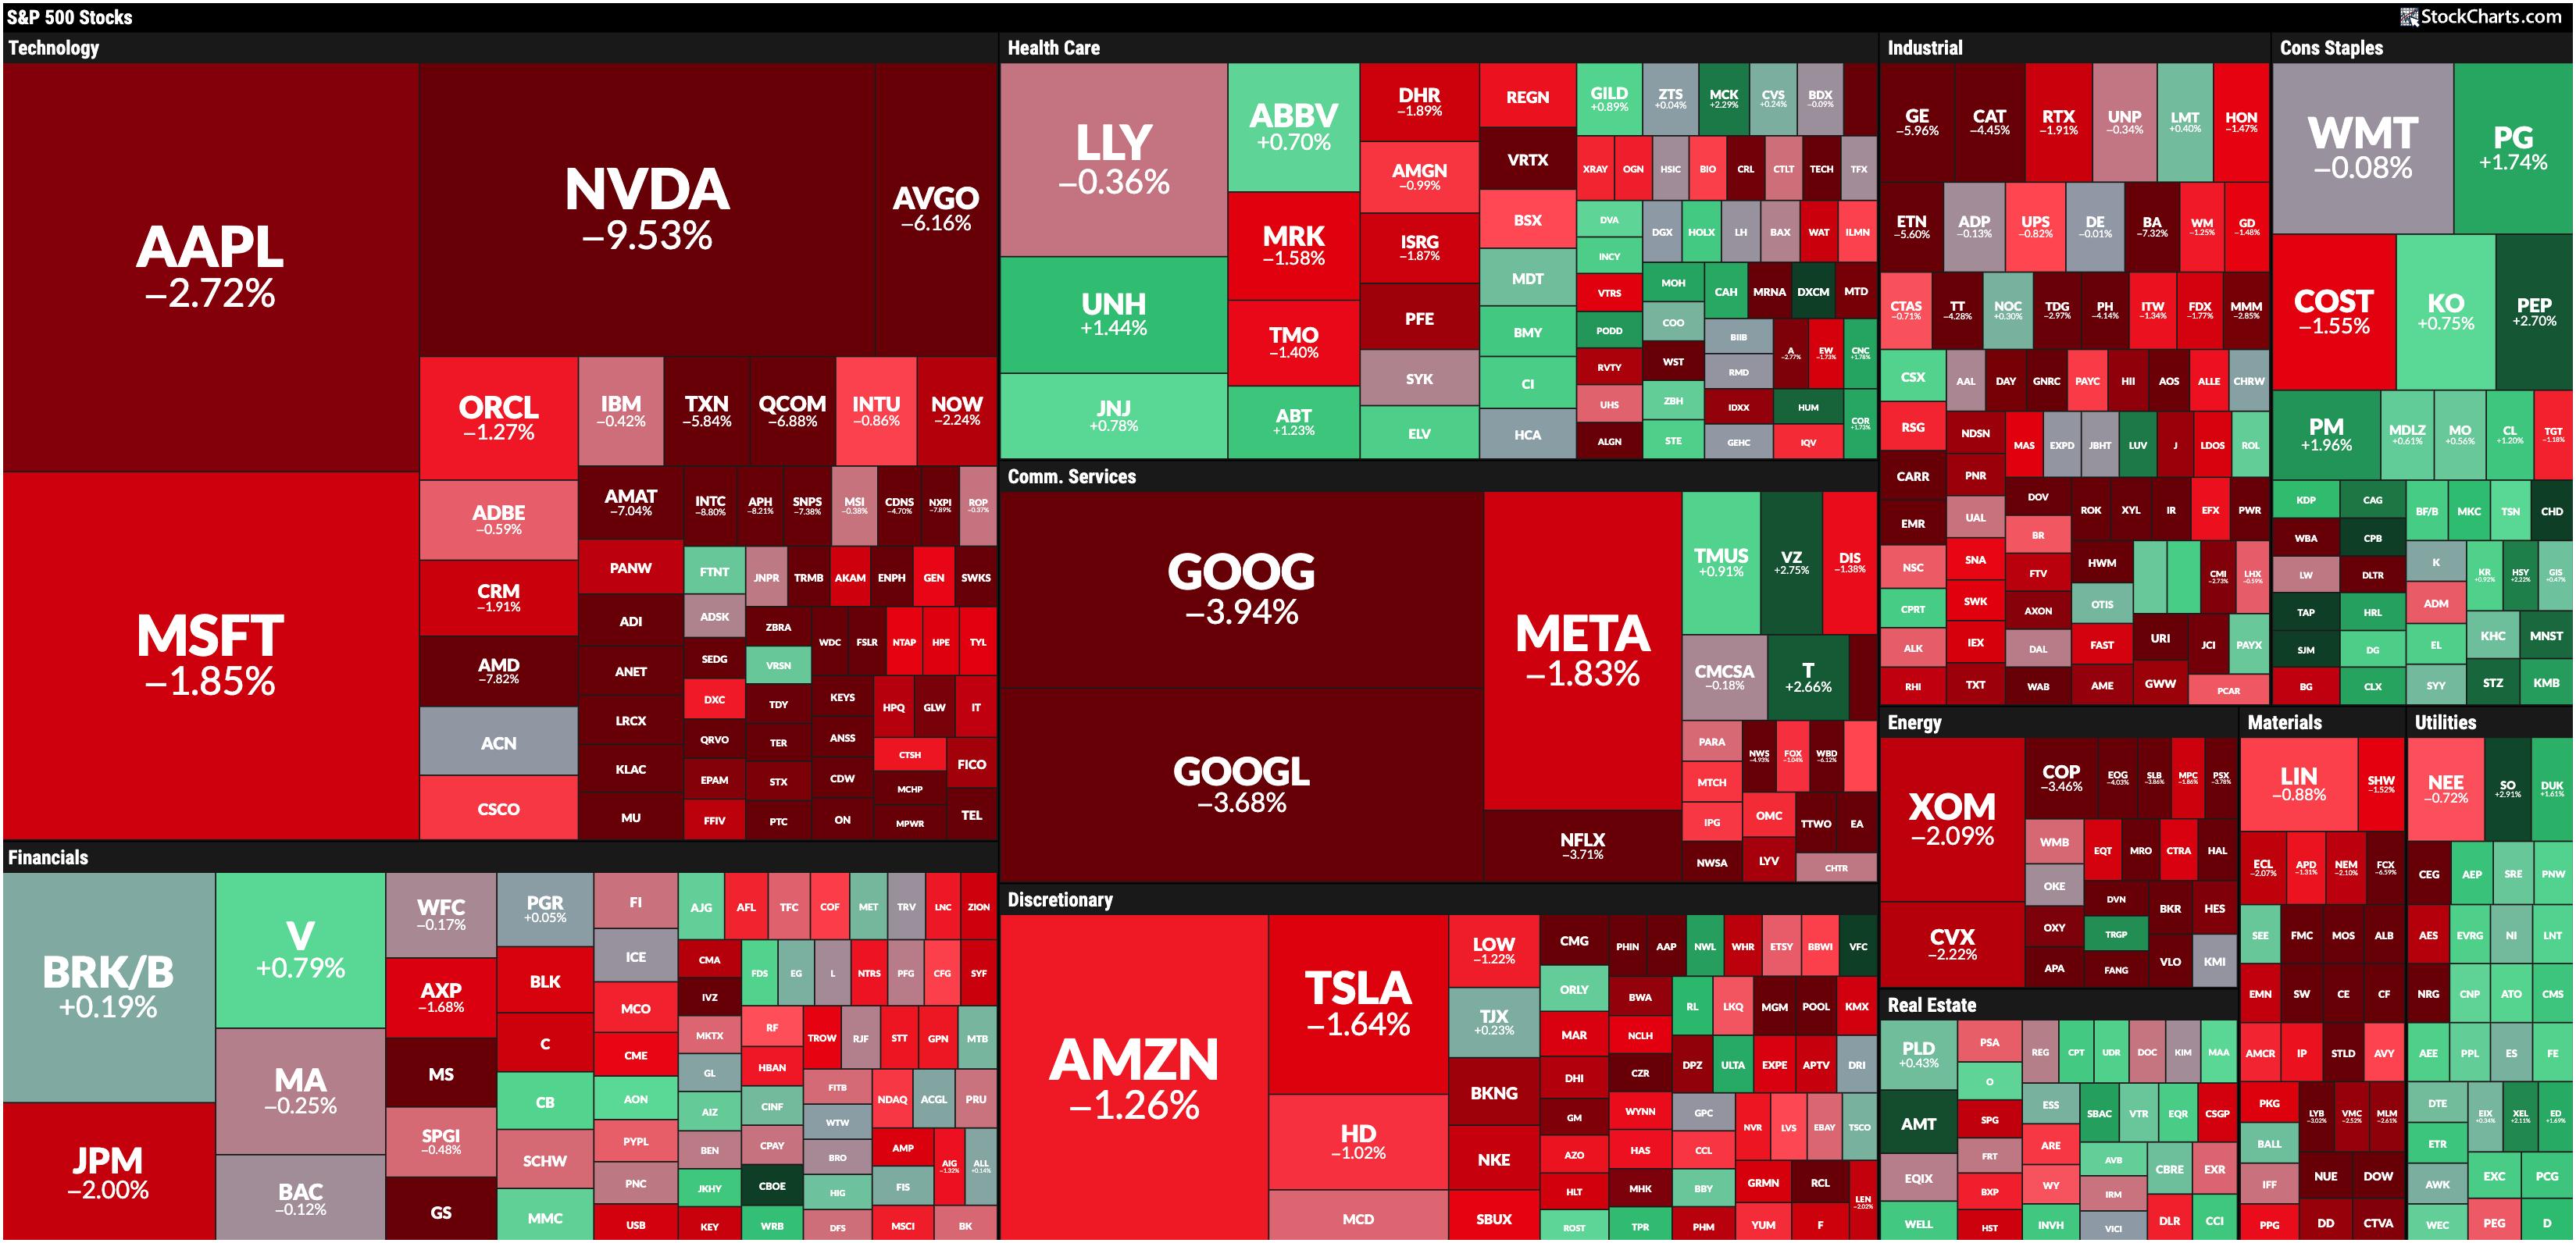
Stock Market Today: Tech Tumbles as Mega-Cap Stocks Get Hit by Major Profit-Taking

by Jayanthi Gopalakrishnan,
Director of Site Content, StockCharts.com
KEY TAKEAWAYS
* Semiconductor stocks get slammed
* Volatility rises as investors become more fearful of more selling pressure ahead
* Investors should be extremely cautious as Broadcom earnings and Non-Farm Payrolls could impact the stock market
I hope you had a relaxing, restful long weekend, and welcome to September.
It was a...
READ MORE
MEMBERS ONLY
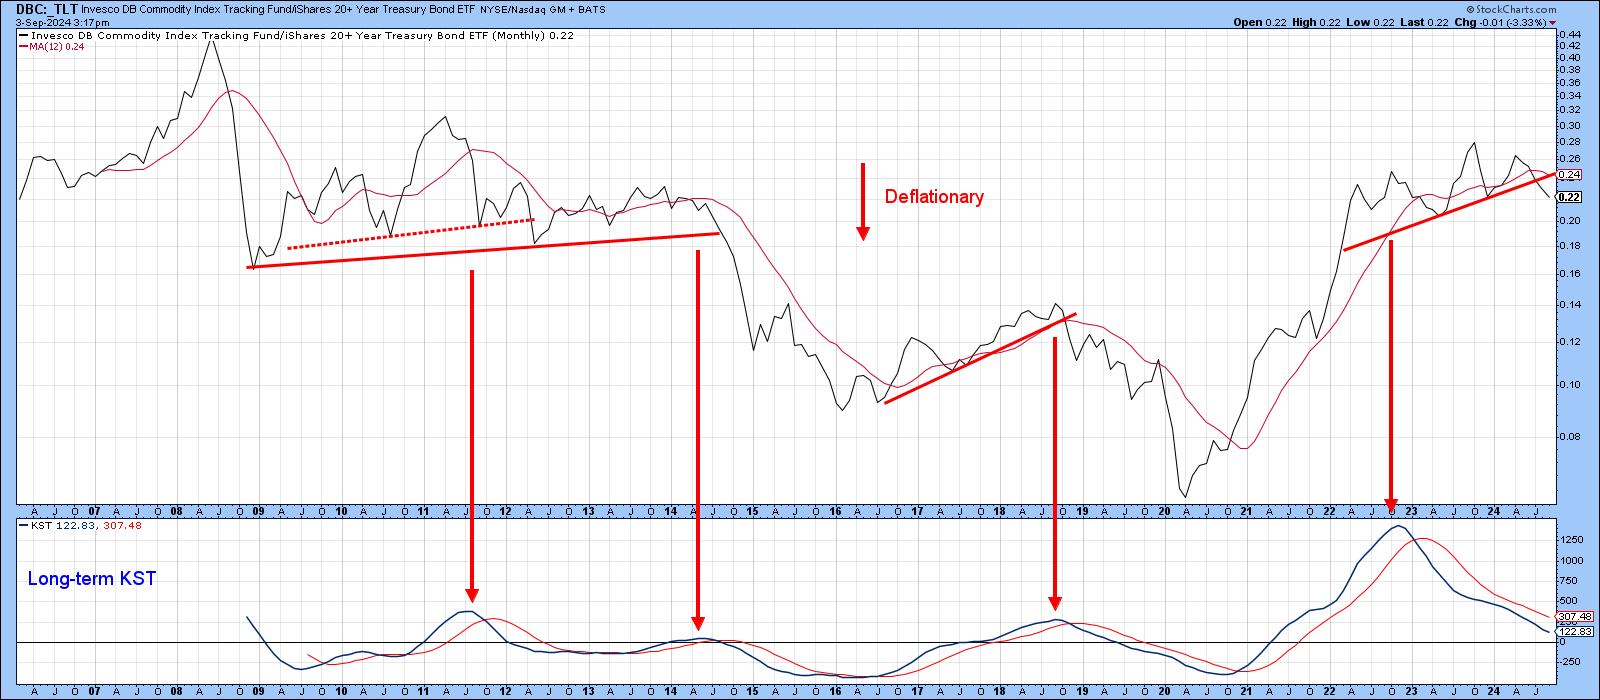
Is It Inflation or Deflation? What's in Your Wallet?

by Martin Pring,
President, Pring Research
Every business cycle has an inflationary and deflationary part, and it's very important for both traders and investors at least to try to have some understanding which has the upper hand at any particular point in time.
For example, when the economy is in a slowdown or recessionary...
READ MORE
MEMBERS ONLY

It all Started with a Big Bang!

by Arthur Hill,
Chief Technical Strategist, TrendInvestorPro.com
KEY TAKEAWAYS
* Extended uptrends often start with a bang, a big bang.
* Chartists can find big bangs by measuring price moves in ATR terms.
* Paypal broke a major resistance level with a 5+ ATR advance in August.
Extended trends often start with big bangs and major breakouts. Chartists can identify...
READ MORE
MEMBERS ONLY
4 MACD Patterns That Will Give You an Edge

by Joe Rabil,
President, Rabil Stock Research
In this exclusive StockCharts TV video, Joe shares four MACD patterns that he focuses on - Pinch, Reverse Divergence, Divergence, and Zero Line Reversal. These signals will help to improve the timing of your trades. He then shares which sectors are showing relative improvement vs the S&P 500,...
READ MORE
MEMBERS ONLY

Is the Multi-Month Dollar Index Trading Range About to be Resolved?
by Martin Pring,
President, Pring Research
Last June, I wrote an articlewhose title was more or less the same as this one. At the time, the Index was bumping up against the top of a major trading range, and it looked very much as if it was about to experience an upside breakout. My conclusion was...
READ MORE
MEMBERS ONLY
DP Trading Room: NVDA Going Into Earnings - Hold or Sell?

by Erin Swenlin,
Vice President, DecisionPoint.com
It is a big week for earnings and NVIDIA (NVDA) is at the top of the list! Erin gives you her view on whether to hold into earnings based on the technicals of the chart. She also reviewed other stocks reporting on Wednesday: CRM, CRWD, HPQ and OKTA.
Carl talks...
READ MORE
MEMBERS ONLY
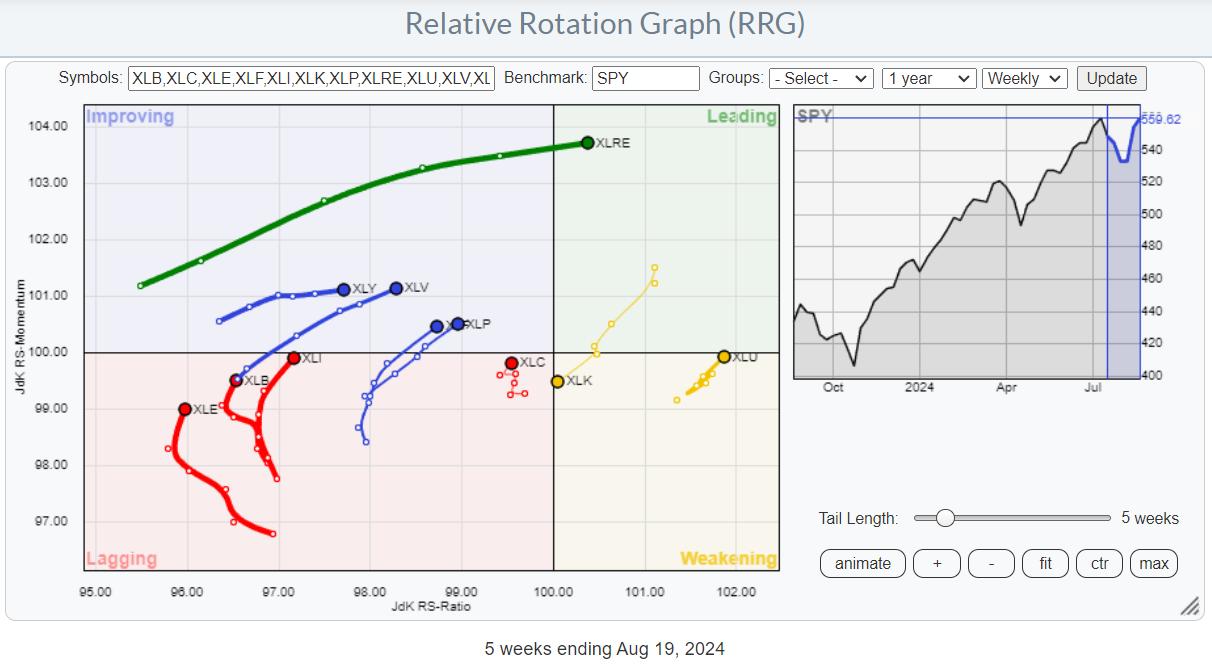
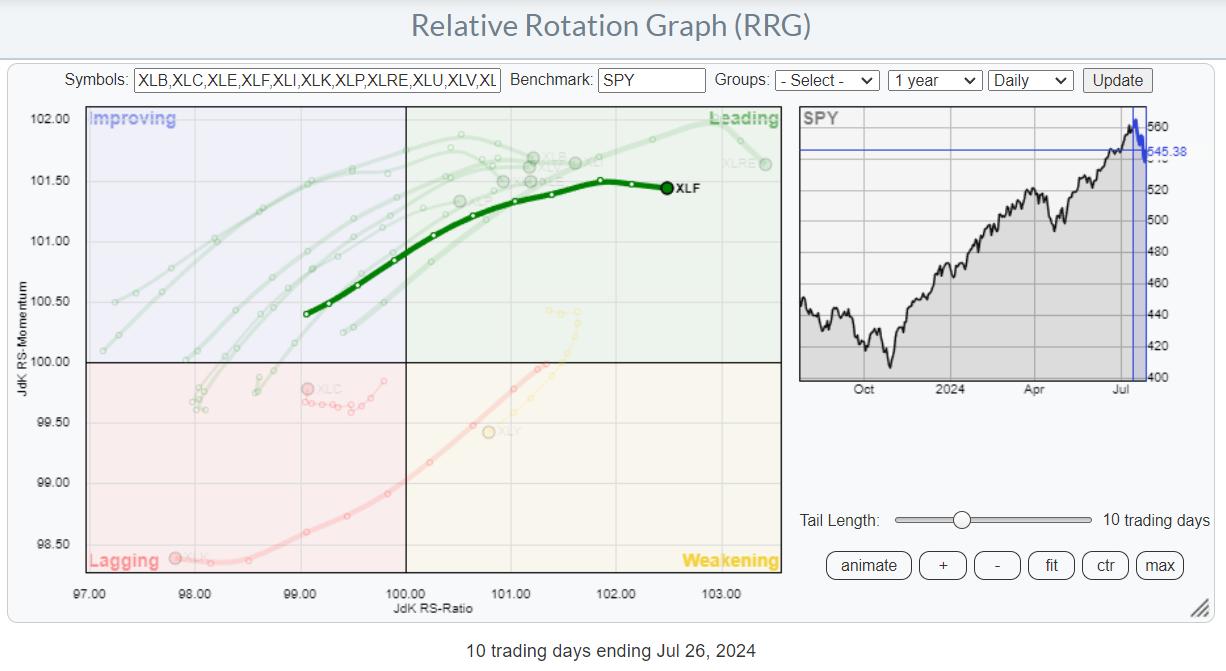
RRG-Velocity Jumping on XLF Tail

by Julius de Kempenaer,
Senior Technical Analyst, StockCharts.com
KEY TAKEAWAYS
* Sector rotation out of technology
* All other sectors are picking up relative strength
* Real-Estate, Utilities, and Financials showing strong rotations
On the weekly Relative Rotation Graph, the rotation still favors almost every sector over Technology. I discussed the opposite rotations between weekly and daily RRGs in last week&...
READ MORE
MEMBERS ONLY

The SCTR Report: Workday Rises on Strong Earnings Results and Rising Technical Strength
by Jayanthi Gopalakrishnan,
Director of Site Content, StockCharts.com
KEY TAKEAWAYS
* Workday, Inc. stock rose higher on strong earnings and guidance
* If Workday stock rises with strong momentum and technical strength, the stock has potential to make for a favorable intermediate-term position trade
* Learn how to set an alert for WDAY stock price to cross a specific threshold
When...
READ MORE
MEMBERS ONLY

Is Peloton Stock the Next Big Turnaround? What You Need to Know Before It's Too Late

by Karl Montevirgen,
The StockCharts Insider
KEY TAKEAWAYS
* Peloton shares jumped over 38% on Thursday following an earnings surprise
* Having fallen 97% from its record peak, Peleton could present investors with a ground-level market opportunity
* With the breakout well underway, here are the actionable levels to watch as Peloton stock surges ahead or dips back down...
READ MORE
MEMBERS ONLY

Top Ten Charts for August: Best Healthcare Stocks for August 2024

by David Keller,
President and Chief Strategist, Sierra Alpha Research
In this edition of StockCharts TV'sThe Final Bar, Dave continues a five-part series covering ten charts to watch in August 2024, honing in on two Health Care stocks showing renewed signs of strength. He also breaks down how earnings releases relate to price trends, and how investors should...
READ MORE
MEMBERS ONLY
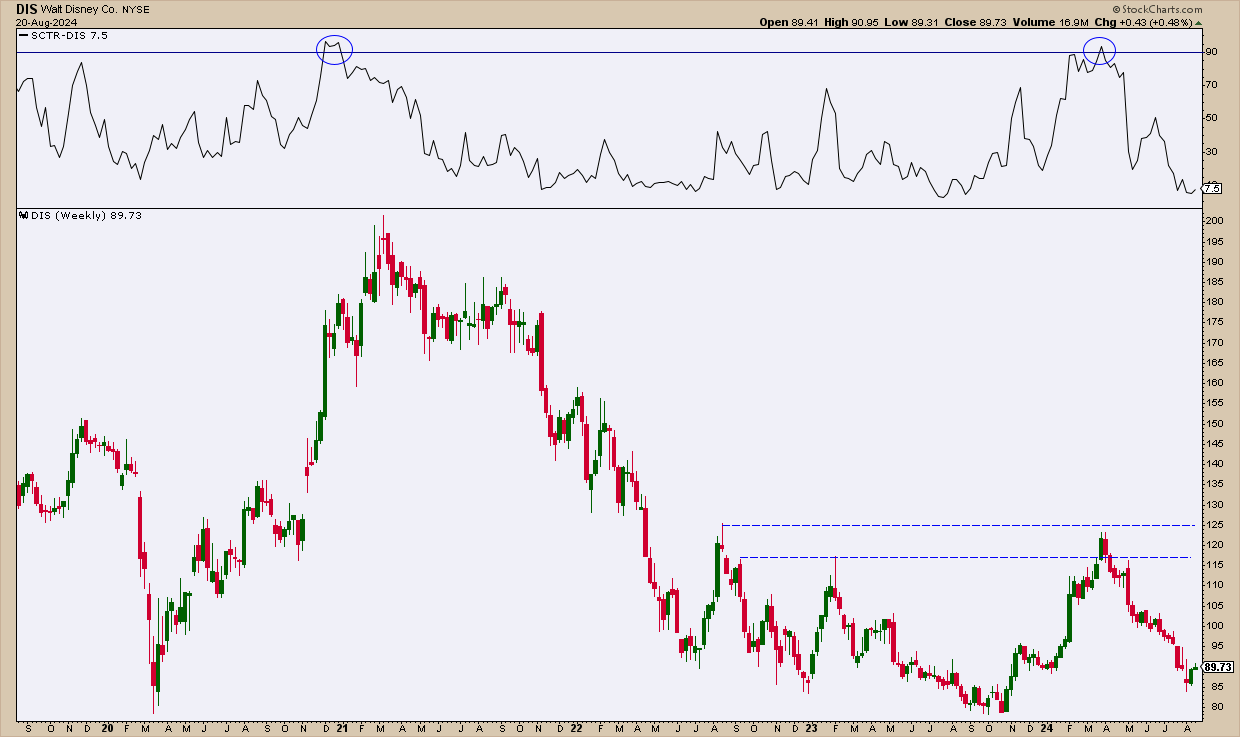
Disney Bust or Bargain? Here are the Levels to Watch!
by Karl Montevirgen,
The StockCharts Insider
The House of Mouse has taken a serious nosedive over the last three years, having gone from a high of about $201 down to $89 and change—a 55% drop that feels like one of its roller coaster rides. Not exactly the thrill Disney shareholders were hoping for.
But Disney...
READ MORE
MEMBERS ONLY
Top Ten Charts for August: Two Magnificent 7 Stocks Worth Watching
by David Keller,
President and Chief Strategist, Sierra Alpha Research
In this edition of StockCharts TV'sThe Final Bar, Dave kicks off a five-part series covering ten charts to watch in August 2024, starting with two mega-cap growth stocks testing key resistance levels. Will they power up to new all-time highs into September?
This video originally premiered on August...
READ MORE
MEMBERS ONLY

DP Trading Room: Potential Housing Crash?
by Erin Swenlin,
Vice President, DecisionPoint.com
Today Carl and Erin discuss the potential of a housing crash as more evidence is coming in that many haven't thought of. Private Equity firms have become very involved in the housing market, buying up properties on high amounts of leverage. What happens when it's time...
READ MORE
MEMBERS ONLY
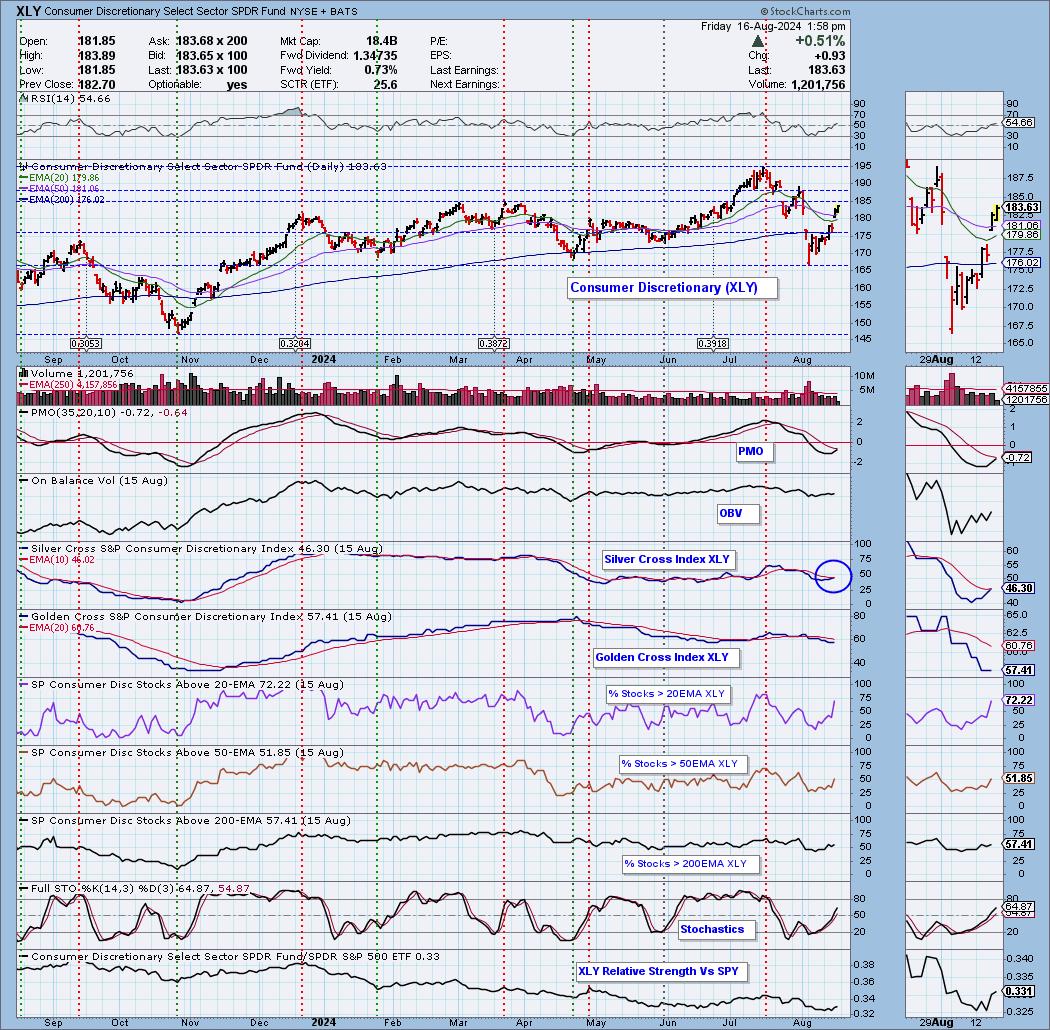
Consumer Discretionary New IT BULLISH Bias
by Erin Swenlin,
Vice President, DecisionPoint.com
The Silver Cross Index measures the number of stocks that have a 20-day EMA above the 50-day EMA, or are on a "Silver Cross" IT Trend Model BUY Signal. This gives us a more complete picture than simply measuring the number of stocks above their key moving averages....
READ MORE
MEMBERS ONLY

The SCTR Report: Dell Is Gaining Strength. Here's Why the Stock Is a Strong Buy
by Jayanthi Gopalakrishnan,
Director of Site Content, StockCharts.com
KEY TAKEAWAYS
* Dell stock is rising from its lows and is worth putting on your radar
* Dell stock is seeing technical improvement but needs more momentum
* There are clear entry and exit points on the daily chart of Dell
When the general market is recovering from a pullback, there can...
READ MORE
MEMBERS ONLY
What Inflation Fear? Strong Retail Sales Fuel Growth
by David Keller,
President and Chief Strategist, Sierra Alpha Research
In this edition of StockCharts TV'sThe Final Bar, Dave recaps another strong up day for growth leadership names, with ULTA and NVDA powering higher after retail sales numbers pushed aside inflation fears. He notes the cautious positioning in the NAAIM Exposure Index, Bitcoin's failed attempt to...
READ MORE
MEMBERS ONLY

How ADX Stage Analysis Can Make You a BETTER Trader!
by Joe Rabil,
President, Rabil Stock Research
In this exclusive StockCharts TV video, Joe shows the four stages a stock or market can be in at any time. He explains each stage and how ADX & Volatility can help define each stage. He then shows what stage the SPY is right and why the bias is still...
READ MORE
MEMBERS ONLY

The Growth Trade is Back!
by David Keller,
President and Chief Strategist, Sierra Alpha Research
In this edition of StockCharts TV'sThe Final Bar, Dave recaps an epic rally in mega cap growth stocks, with NVDA up over 6% and META threatening a new 52-week high. Dave highlights how gold and bond prices continue to rise in the face of stronger stocks, and breaks...
READ MORE
MEMBERS ONLY

SBUX Stock Price Skyrockets: Is Now the Time to Buy?
by Karl Montevirgen,
The StockCharts Insider
KEY TAKEAWAYS
* Starbucks' stock price saw a massive jump and SCTR score on Tuesday
* Much of SBUX's stock price movement is sentiment-driven, so the price spike could be short-lived
* StockCharts SCTR tool identified SBUX as a strong stock, and a more thorough analysis can determine if the...
READ MORE
MEMBERS ONLY

VIX Indicates Fear, But Is It Enough?
by Martin Pring,
President, Pring Research
Last Monday, markets around the world experienced a sharp drop as the unwinding of yen carry trades followed the previous Friday's response to a weak employment report. The speed and sharpness of the equity sell-off got the attention of the general-purpose media and just about everyone else.
From...
READ MORE
MEMBERS ONLY

DP Trading Room: Mortgage Rates are Falling - Watch Real Estate
by Erin Swenlin,
Vice President, DecisionPoint.com
Mortgage Rates fell quite a bit this past week and no one is really talking about it. One area that we will want to watch closely as rates fall is Real Estate (XLRE). This sector has already been moving in the right direction. It now has an opportunity to rally...
READ MORE
MEMBERS ONLY
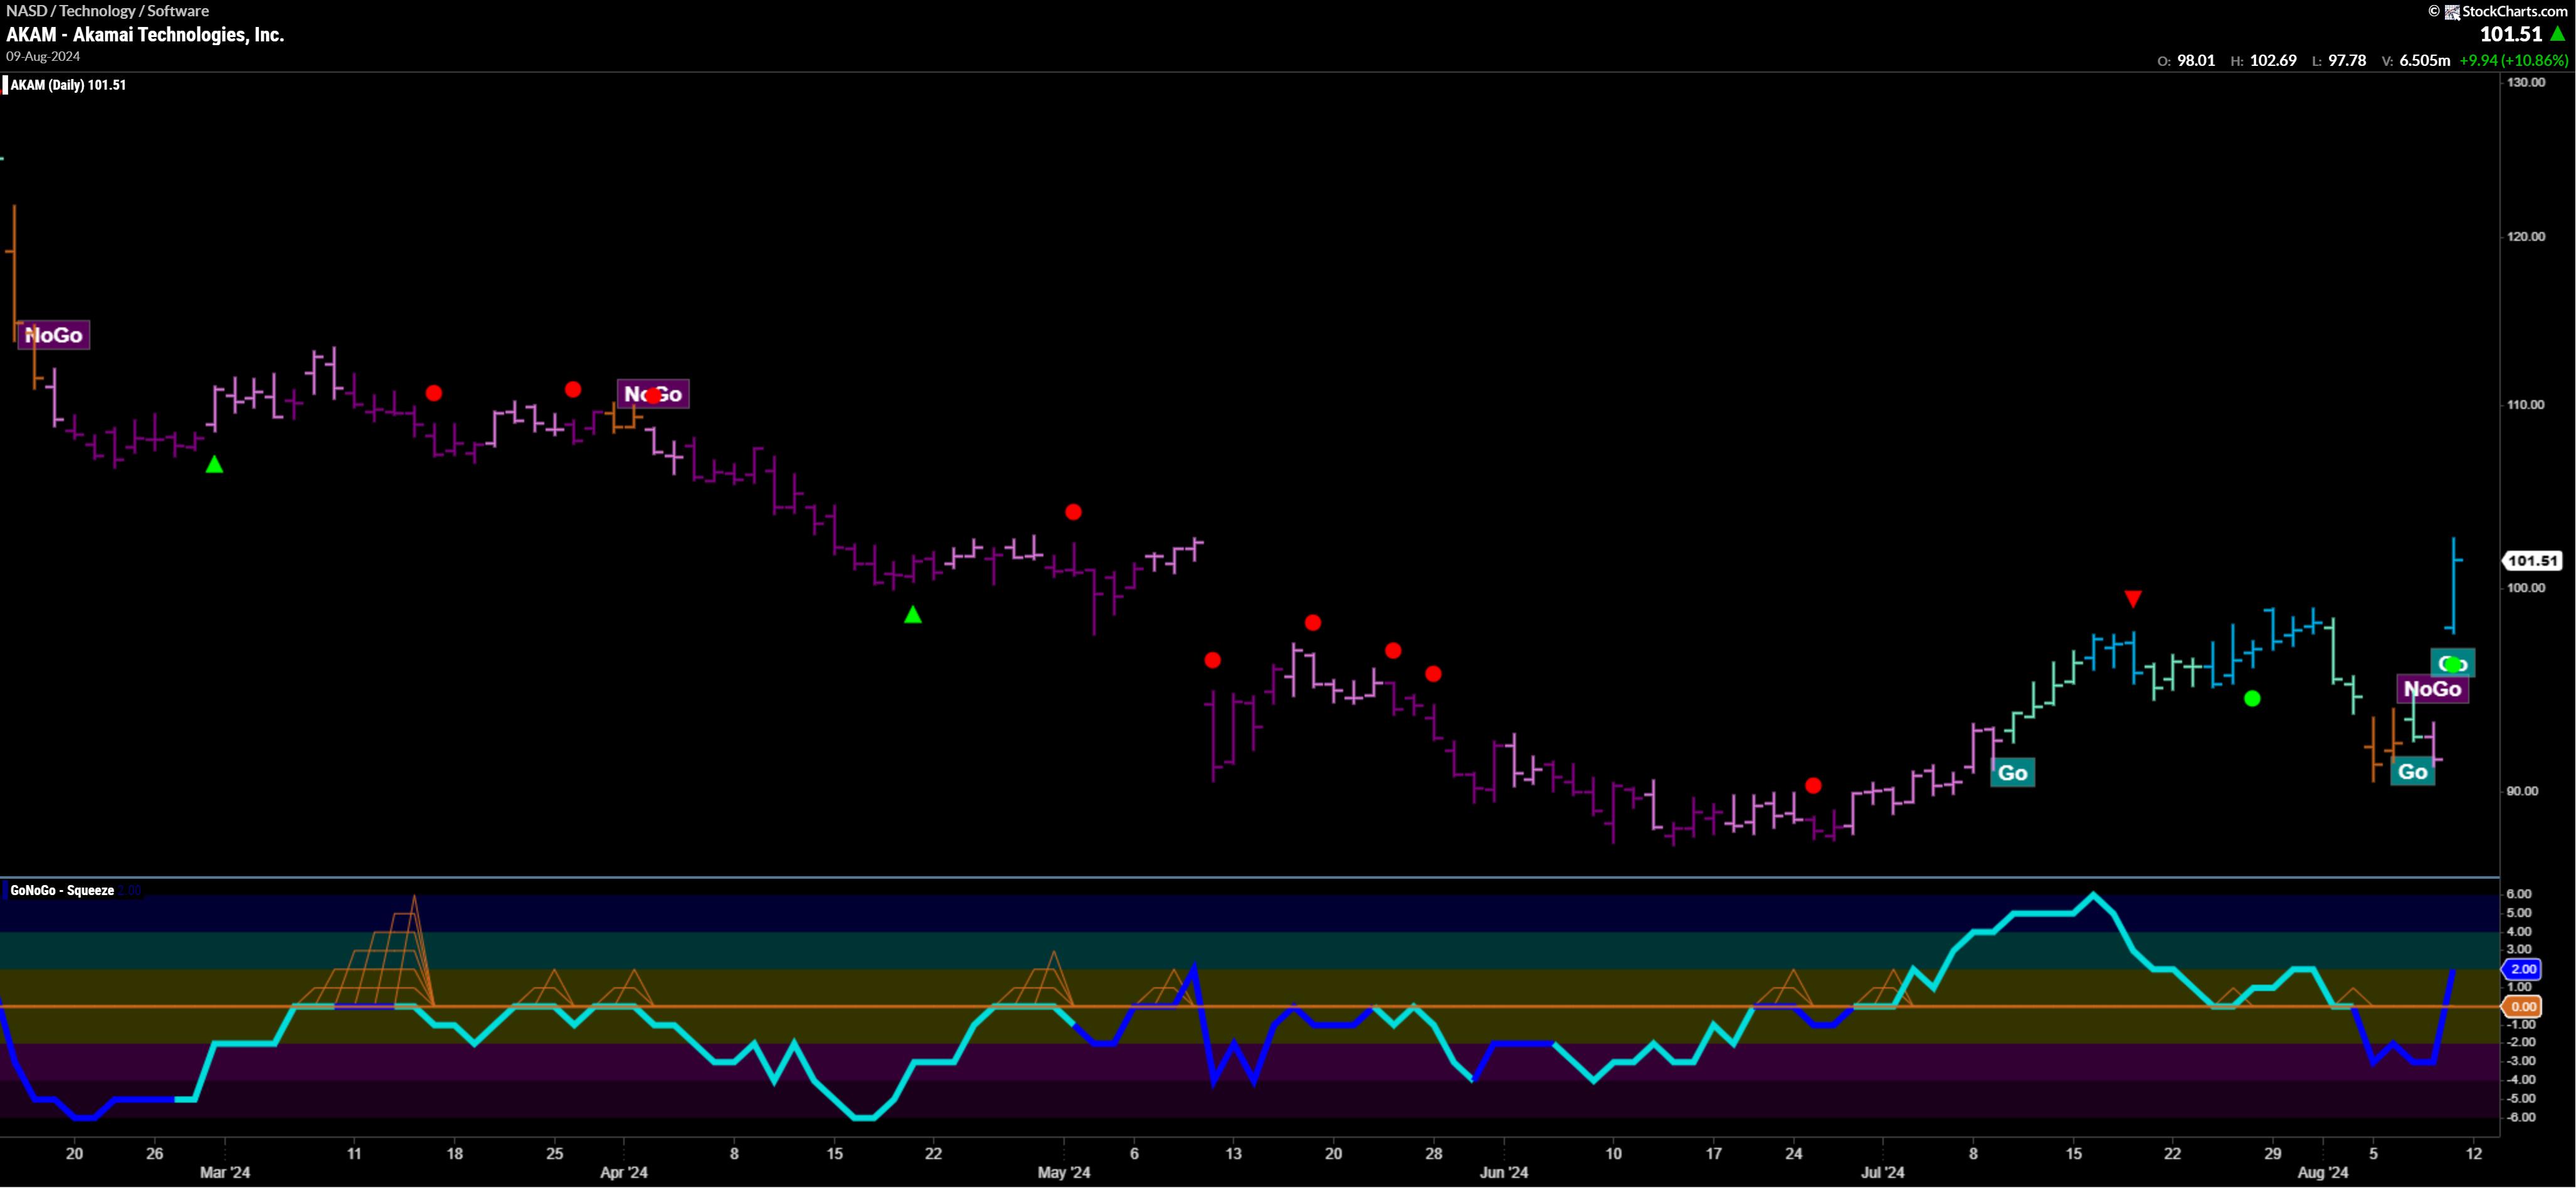
Top 5 Stocks in "Go" Trends | Fri Aug 9, 2024

by Tyler Wood,
Co-founder, GoNoGo Charts®
KEY TAKEAWAYS
* Scanning for breakouts on heavy volume
* Momentum confirmations of underlying trends
* Leading Equities in trend continuation
Top 5 Stocks in "Go" Trends
Trend Continuation on Rising Momentum
GoNoGo Charts® highlight low-risk opportunities for trend participation with intuitive icons directly in the price action. The resurgence of...
READ MORE
MEMBERS ONLY

Three Market Sentiment Indicators Confirm Bearish Phase
by David Keller,
President and Chief Strategist, Sierra Alpha Research
KEY TAKEAWAYS
* The VIX reaching 65 signals extreme volatility and elevated risk of market downside
* The AAII Survey is close to showing more bears than bulls, which would line up with previous corrections
* The NAAIM Exposure Index indicates that money managers were rotating to defensive positioning in early July
While...
READ MORE
MEMBERS ONLY

S&P 500 Teetering On 100-Day Moving Average Support
by Jayanthi Gopalakrishnan,
Director of Site Content, StockCharts.com
KEY TAKEAWAYS
* The stock market indexes end the week on a positive note after a scary Monday
* Volatility steps back slightly after a brief spike over 65
* Next week's consumer and producer inflation data could help set direction
A sigh of relief? The US stock market started the...
READ MORE
MEMBERS ONLY

How the PROS Time Entry Points
by David Keller,
President and Chief Strategist, Sierra Alpha Research
In this edition of StockCharts TV'sThe Final Bar, Dave presents a special all-mailbag episode, answering viewer questions on optimizing entry points for long ideas, best practices for point & figure charts, and the relationship between gold and interest rates.
See Dave's chart showing Zweig Breadth Thrust...
READ MORE
MEMBERS ONLY
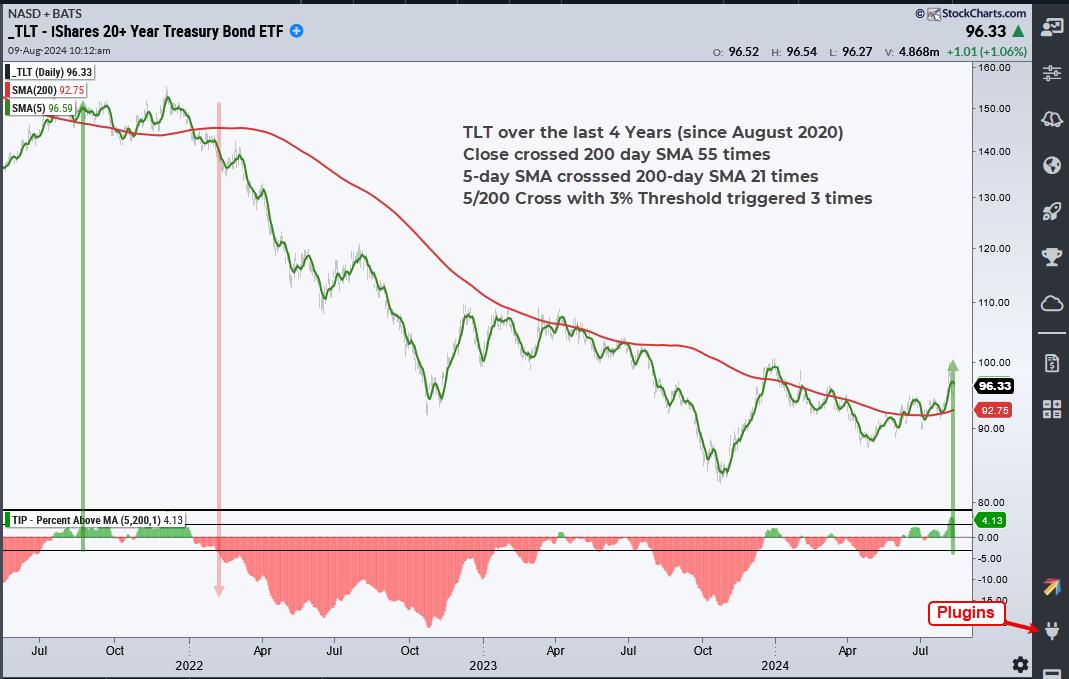
TLT Turns the Corner and Starts to Lead
by Arthur Hill,
Chief Technical Strategist, TrendInvestorPro.com
KEY TAKEAWAYS
* Smoothing the signal thresholds help to reduce whipsaws.
* A new uptrend signaled for TLT as the 5-day exceeded the 200-day by more than 3%
* TLT also sports a classic breakout and continuation signal.
The 20+ Yr Treasury Bond ETF (TLT) is turning the corner as a long-term trend...
READ MORE
MEMBERS ONLY

Will USO Soar to $83? Here Are the Key Levels to Watch!
by Karl Montevirgen,
The StockCharts Insider
KEY TAKEAWAYS
* Fundamental, technical, and seasonality factors suggest an upside move in WTI crude oil.
* Seasonality and other indicators suggest a swing trading opportunity in the United States Oil Fund (USO).
* Supply and geopolitical factors can quickly change the conditions of the market and the trade.
Oil prices are climbing...
READ MORE
MEMBERS ONLY

The Great Rotation: Not What You Think
by Martin Pring,
President, Pring Research
KEY TAKEAWAYS
* Small-cap stocks look like they have lost momentum.
* Market breadth in small-cap stocks appears to be weakening.
* The Utilities sector seems to be gaining momentum.
Just so we are on the same page, I looked up "Great Rotation" on Microsoft's Copilot and came away...
READ MORE
MEMBERS ONLY

QQQ: Critical Levels to Watch as Nasdaq Teeters on the Edge
by Karl Montevirgen,
The StockCharts Insider
KEY TAKEAWAYS
* QQQ has bounced off its 200-day moving average.
* An optimal entry point for QQQ would be the 50% to 61.8% Fibonacci retracement range.
* If QQQ drops below $350, it can mean further downside.
Just Another Manic Monday? On Monday, the Nasdaq plunged over 3%. With the S&...
READ MORE
MEMBERS ONLY

The SCTR Report: Carvana Stock Makes It To Top of the Podium Today
by Jayanthi Gopalakrishnan,
Director of Site Content, StockCharts.com
KEY TAKEAWAYS
* Carvana stock takes the lead in the large-cap stocks SCTR Report
* CVNA stock has established an upside trend with higher lows and higher highs
* Carvana's stock price is holding above its 21-day exponential moving average
On a day when the S&P 500 ($SPX) drops...
READ MORE
MEMBERS ONLY

DP Trading Room: Bear Market Rules Apply
by Erin Swenlin,
Vice President, DecisionPoint.com
The market is dropping perilously right now and so it is time to review Bear Market Rules. Today Erin and Carl share their rules for trading during a bear market move. We aren't officially in a bear market and we may not get there, but there is likely...
READ MORE
MEMBERS ONLY

Week Ahead: NIFTY Stays Prone To Profit-Taking Bouts; Guard Profits and Stay Stock-Specific

by Milan Vaishnav,
Founder and Technical Analyst, EquityResearch.asia and ChartWizard.ae
The previous week turned out quite volatile for the markets as they not only marked a fresh lifetime high but also faced corrective pressure as well towards the end of the week. The markets maintained an upward momentum all through the week. It scaled the psychologically important 25000 level as...
READ MORE
MEMBERS ONLY

It's Been a Long Time Mr Bear, Where Have You Been?
by Julius de Kempenaer,
Senior Technical Analyst, StockCharts.com
KEY TAKEAWAYS
* Some real damage for the markets
* Equal weight sector rotation paints a more realistic picture
* The BIG ROTATION into small caps has come to a halt
And then ..... all of a sudden..... things are heating up. Lots of (downside) market action in the past week.
Let's...
READ MORE
MEMBERS ONLY

Bonds To Get Beat Up? | Focus on Stocks: August 2024

by Larry Williams,
Veteran Investor and Author
It looks to me like it's time for the bond market to take a breather, if not have a pullback from now into late October.
We can sum it up with the cycle projections from Chart 1. I have highlighted, in red, the down leg of the 450-day...
READ MORE
MEMBERS ONLY

Semiconductors Are Down: Is Now the Time to Buy SMH?
by Karl Montevirgen,
The StockCharts Insider
KEY TAKEAWAYS
* SMH has completed 100% of a measured move from the bottom of a double-top reversal.
* SMH has broken below several key levels based on various indicators.
* There are actionable levels in the SMH chart that traders can take advantage of if they materialize.
Nvidia (NVDA) was perhaps the...
READ MORE
MEMBERS ONLY

Big Tech Earnings, Fed Meeting, Jobs Report: Will They Add More Pressure to the Stock Market?
by Jayanthi Gopalakrishnan,
Director of Site Content, StockCharts.com
KEY TAKEAWAYS
* Investor sentiment has turned more bearish with a continuation of a selloff in big tech stocks.
* More earnings, an FOMC meeting, and jobs report are adding to investor uncertainty.
* Keep an eye on bond prices as the data starts to unravel.
Last week, there was a noticeable change...
READ MORE
MEMBERS ONLY

Is the Bond Market About To Make a Big Move?
by Martin Pring,
President, Pring Research
The bond market experienced a secular bear between 1981 and the spring of 2020. Chart 1 offers three reasons why it has since reversed and given way to a secular uptrend or possibly multi-year trading range.
The first piece of evidence comes from violating the multi-decade trendline. Second, the price...
READ MORE
MEMBERS ONLY

DP Trading Room: Spotlight on Mega-Cap Earnings
by Erin Swenlin,
Vice President, DecisionPoint.com
This week we have four Magnificent Seven stocks reporting earnings. We also take a look at McDonalds (MCD) and Ford (F) going into earnings. How are the chart technicals setup on the precipice of earnings? Carl and Erin give you there thoughts.
Carl reviews the DP Signal Tables to see...
READ MORE
MEMBERS ONLY
Flying Financials. Will It Be Enough?
by Julius de Kempenaer,
Senior Technical Analyst, StockCharts.com
KEY TAKEAWAYS
* Strong Sector Rotation Out Of Technology
* Financials and Real Estate Lead
* Stock/Bond Ratio Triggers Sell Signal
Flying Financials
In the recent sector rotation, basically OUT of technology and INTO anything else, Financials and Real-Estate led the relative move.
On the RRG above, I have highlighted the (daily)...
READ MORE
MEMBERS ONLY
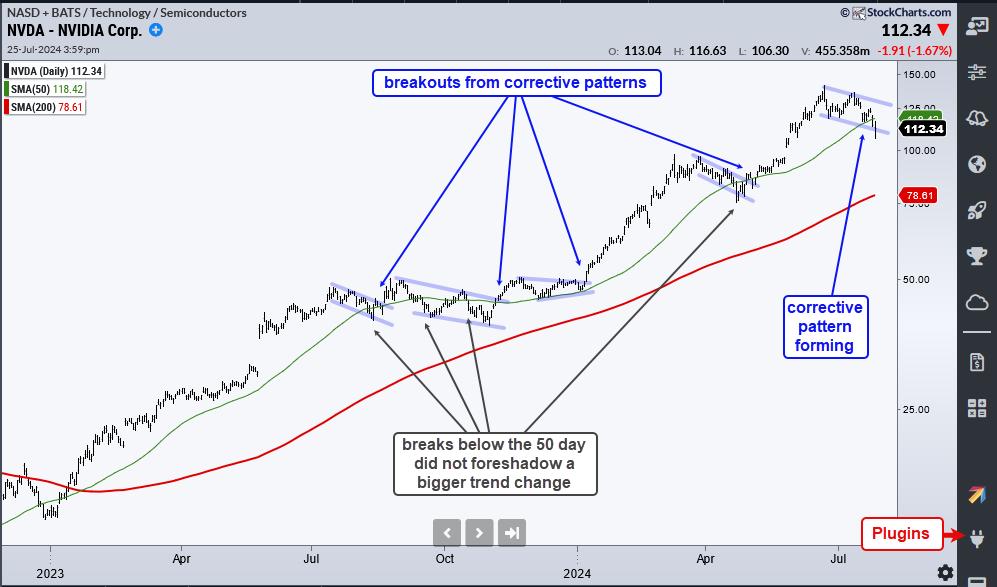
Nvidia Breaks the 50-day SMA: Is This a Threat or an Opportunity?
by Arthur Hill,
Chief Technical Strategist, TrendInvestorPro.com
KEY TAKEAWAYS
* The long-term trend provides perspective and sets the trading bias.
* The bias is bullish during long-term uptrends.
* Breaks below the 50-day SMA are viewed a opportunities, not threats.
After a big run this year, Nvidia (NVDA) fell over 15% from its high and broke its 50-day simple moving...
READ MORE