MEMBERS ONLY
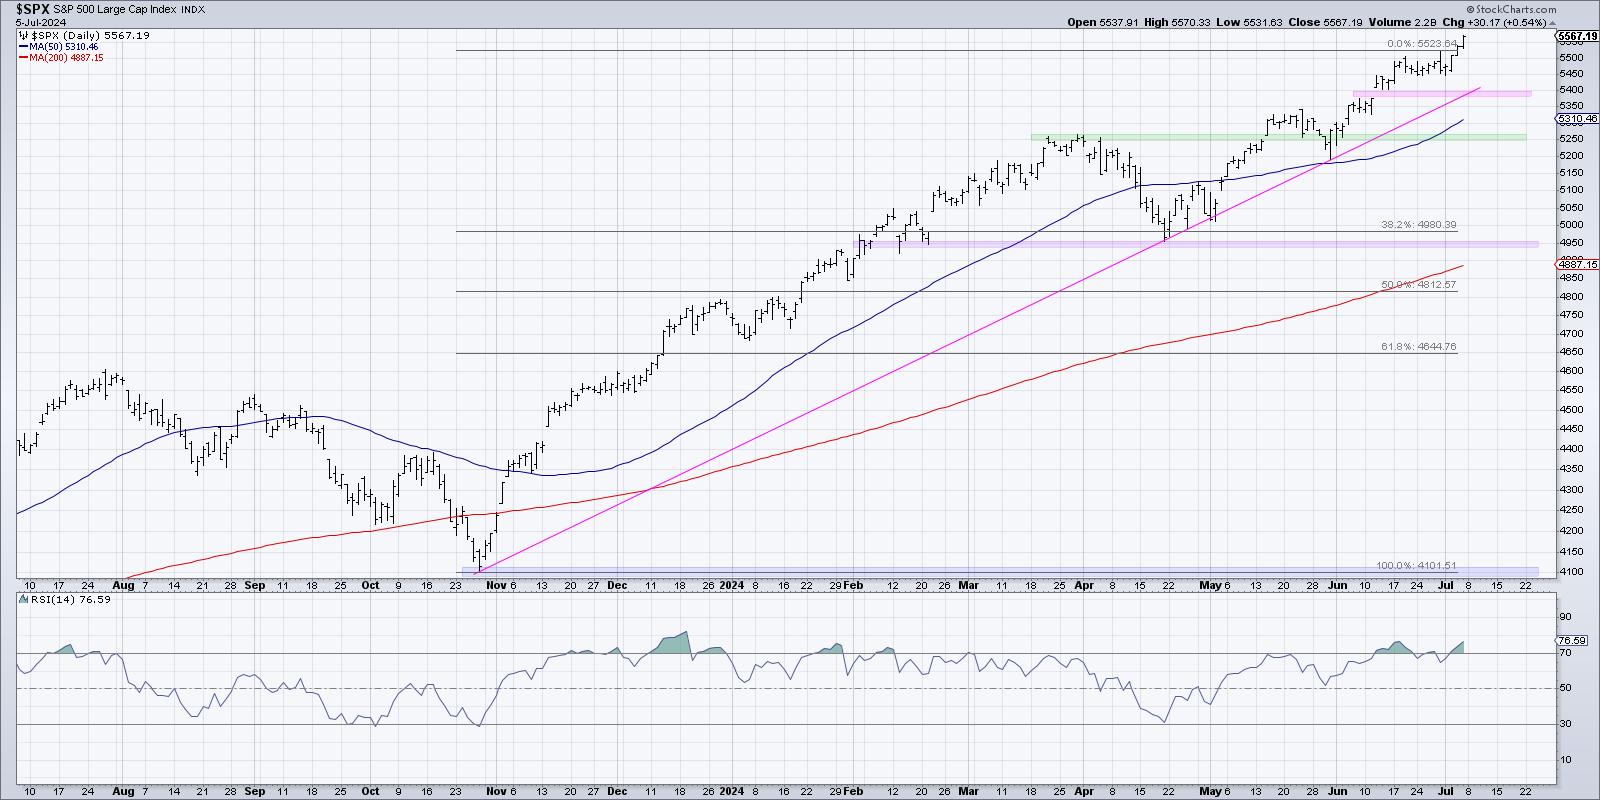
S&P 500 Breaks Key Trendline as Growth Stocks Plunge

by David Keller,
President and Chief Strategist, Sierra Alpha Research
In this edition of StockCharts TV'sThe Final Bar, Dave previews earnings releases from TSLA and GOOGL, breaks down key levels to watch for SPOT, GE, and more, and analyzes the discrepancy between S&P 500 and Nasdaq breadth indicators.
See Dave's MarketCarpet featuring the Vanilla...
READ MORE
MEMBERS ONLY
Small Caps Surge, Markets React to TSLA & GOOGL Earnings
by David Keller,
President and Chief Strategist, Sierra Alpha Research
In this edition of StockCharts TV'sThe Final Bar, Dave previews earnings releases from TSLA and GOOGL, breaks down key levels to watch for SPOT, GE, and more, and analyzes the discrepancy between S&P 500 and Nasdaq breadth indicators.
This video originally premiered on July 23, 2024....
READ MORE
MEMBERS ONLY

CrowdStrike's Epic Fail: Here are the Critical Trading Levels to Watch Now!

by Karl Montevirgen,
The StockCharts Insider
KEY TAKEAWAYS
* Following the CrowdStrike debacle, the stock is as much a technical trade as it is a news-driven trade
* Crowdstrike's stock price has entered a potential buying zone, but potential lawsuits may be a headwind
* Crowdstrike could be a buying opportunity but watch momentum, buying levels, and...
READ MORE
MEMBERS ONLY
Can Small and Mid-Caps Save the Market?

by Julius de Kempenaer,
Senior Technical Analyst, StockCharts.com
In this video from StockCharts TV,Julius takes a look at the markets through the lens of the "market factors" panel you can find on your StockCharts dashboard. Starting from the RRG, he then moves to the individual charts for these factors and notes a low correlation for...
READ MORE
MEMBERS ONLY
The Stock Market is Bracing for Earnings IMPACT!
by David Keller,
President and Chief Strategist, Sierra Alpha Research
In this edition of StockCharts TV'sThe Final Bar, Dave breaks down today's upside recovery day for stocks, then shares the charts of TSLA, NVDA, and more. He also illustrates the conflicting messages from AAII and NAAIM sentiment surveys, and also highlights the VIX testing the key...
READ MORE
MEMBERS ONLY
DP Trading Room: Behind the Scenes: CrowdStrike (CRWD)

by Erin Swenlin,
Vice President, DecisionPoint.com
Friday was a bad day for CrowdStrike Holdings (CRWD) as a bug was pushed out that disrupted Windows machines worldwide. The trouble for CRWD is the follow-up lawsuits etc that will likely plague the stock for some time to come. You'll be shocked to see the warning signs...
READ MORE
MEMBERS ONLY

Time for a Pause That Refreshes Stocks and Gold?

by Martin Pring,
President, Pring Research
Most weekends, I run through a chart list featuring weekly bars and candlesticks of bonds, stocks and commodities to see if any one or two bar patterns or candlestick formations have developed. Last week produced a crop of bearish messages from the major averages and some sectors. Before you rush...
READ MORE
MEMBERS ONLY
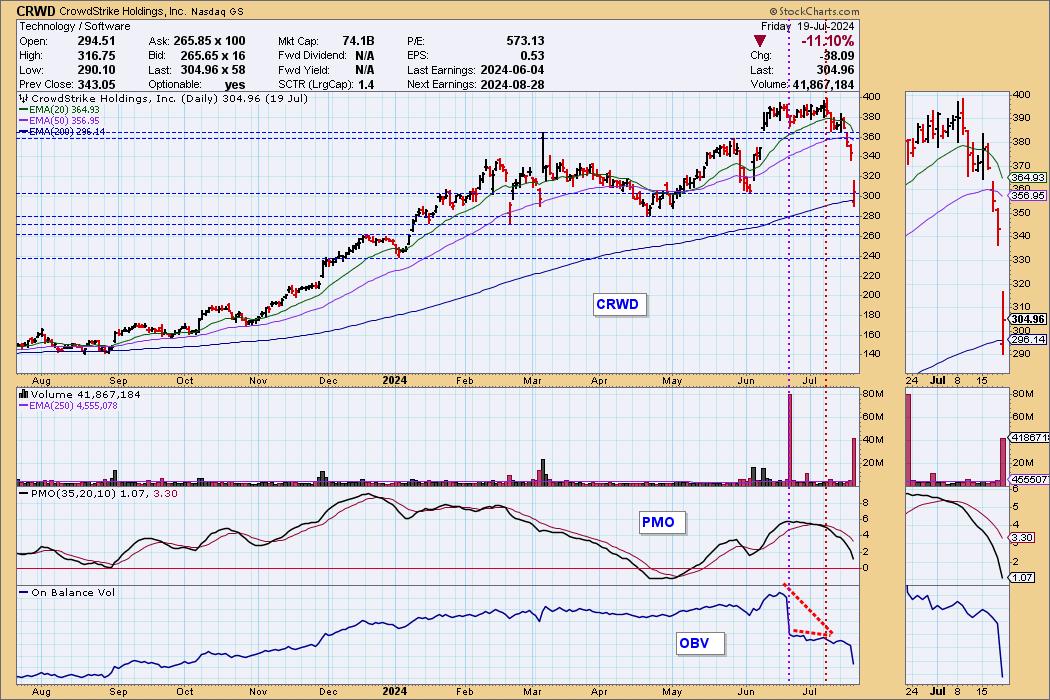
CrowdStrike: Did On-Balance Volume See the "Largest IT Outage In History" Coming?

by Carl Swenlin,
President and Founder, DecisionPoint.com
Friday's CrowdStrike software disaster has been described as "the largest IT outage in history," and it brought home just how vulnerable the planet is to itty-bitty coding errors. We were busy publishing the DecisionPoint ALERT Weekly Wrap, so I didn't have a chance to...
READ MORE
MEMBERS ONLY

Important Market Breadth Indicators to Watch: Making Sense of Three Consecutive Down Days

by Jayanthi Gopalakrishnan,
Director of Site Content, StockCharts.com
KEY TAKEAWAYS
* Three consecutive declining days in the stock market increases risk appetite
* Semiconductors were the catalyst for the selloff and trading below two support levels
* Keep an eye on market breadth indicators to get indications of whether the stock market is correcting or if the selloff will be longer-term...
READ MORE
MEMBERS ONLY
Hindenburg Omen: The Truth, Effects, and Duration
by David Keller,
President and Chief Strategist, Sierra Alpha Research
In this edition of StockCharts TV'sThe Final Bar, Dave answers viewer questions on the best time frames for viewing charts, insights on using Vanguard ETFs for sector rotation, the duration and effect of the Hindenburg Omen indicator, how stocks are indexed in Dow Jones Groups on StockCharts, and...
READ MORE
MEMBERS ONLY
What Does a Market Top Look Like?
by David Keller,
President and Chief Strategist, Sierra Alpha Research
The S&P 500 remains in a primary uptrend, as confirmed by a fairly consistent pattern of higher highs and higher lows. But what would confirm that a top is in place for our major equity benchmarks? To answer that, it may be helpful to review other charts that...
READ MORE
MEMBERS ONLY
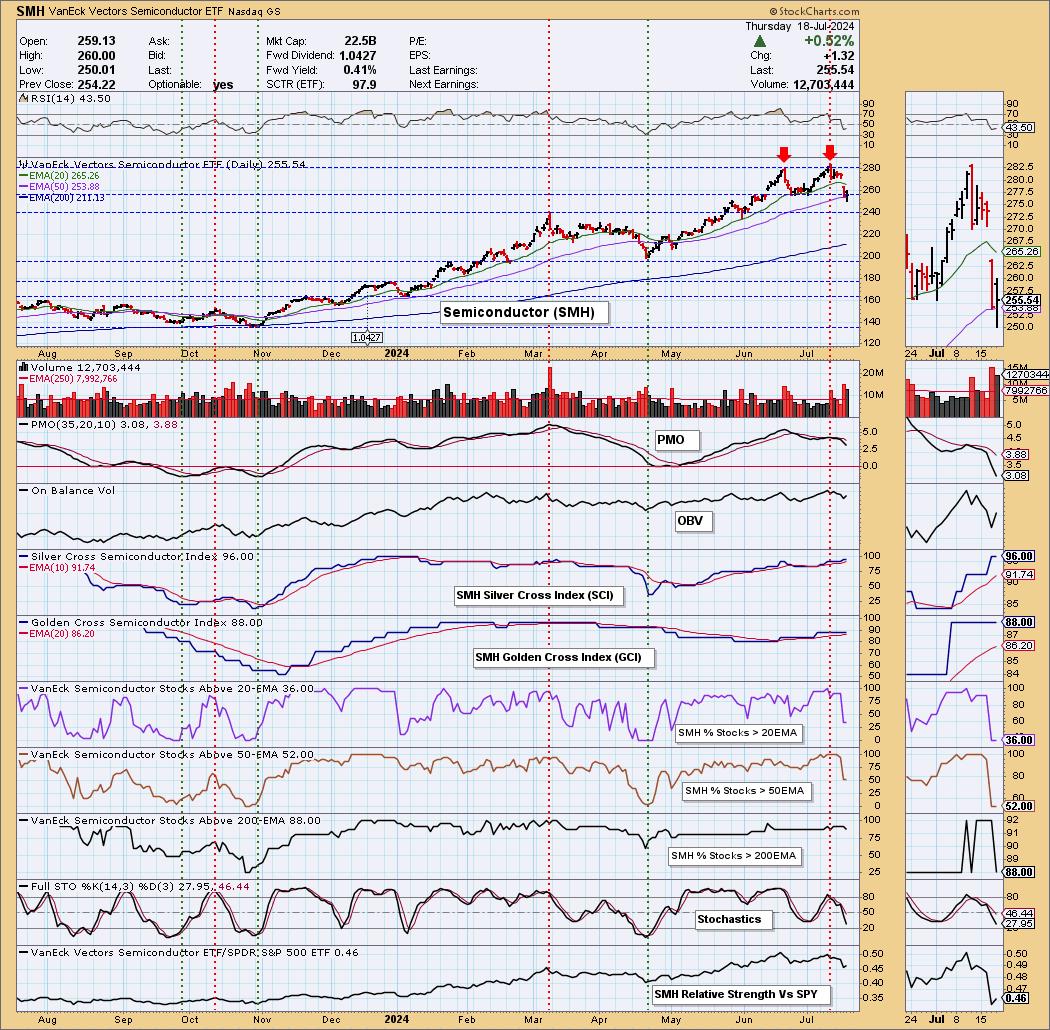
Double Top on Semiconductors (SMH)
by Erin Swenlin,
Vice President, DecisionPoint.com
(This is an excerpt from the subscriber-only DecisionPoint Alert)
We noticed a double top on the Semiconductor industry group (SMH) that looks very much like the NVIDIA (NVDA) chart. NVDA is clearly the bellwether for the group, and it appears all of the Semiconductors are feeling the pain. The downside...
READ MORE
MEMBERS ONLY

Will This Sector Rotation Be the Start of Something Bigger?
by Julius de Kempenaer,
Senior Technical Analyst, StockCharts.com
KEY TAKEAWAYS
* Technology is rotating out of favor
* Market Capitalization is a two-edged sword
* Negative divergences on Technology and S&P 500 charts are executing
Strong Rotations on Daily RRG
This daily RRG shows the sector rotation over the last five days. With only one more trading day to...
READ MORE
MEMBERS ONLY

Carvana Stock Is Picking Up Speed. Is Now the Time To Buy?
by Jayanthi Gopalakrishnan,
Director of Site Content, StockCharts.com
KEY TAKEAWAYS
* Carvana stock hit a new 52-week high and has potential to move higher
* The weekly chart of Carvana's stock price shows the trend is up and has more upside potential
* Carvana's stock chart shows the relative strength index is just approaching overbought territory, indicating...
READ MORE
MEMBERS ONLY

These Two Sectors are Showing Promising Silver Cross Setups
by Martin Pring,
President, Pring Research
A silver cross occurs when a 20-day MA crosses above its 50-day counterpart. While far from perfect, such signals enable you to ride a persistent trend. However, like all trend following techniques, problems can occur in a trading range environment.
Chart 1 features two recent buy signals for the S&...
READ MORE
MEMBERS ONLY
DP Trading Room: PMO Sort on Earnings Darlings
by Erin Swenlin,
Vice President, DecisionPoint.com
Earnings are coming into focus and today Erin looks at the big earnings stocks to find out which look the best going into earnings. She took the list of stocks and sorted them by the Price Momentum Oscillator (PMO) which put the strongest stocks at the top of the list....
READ MORE
MEMBERS ONLY
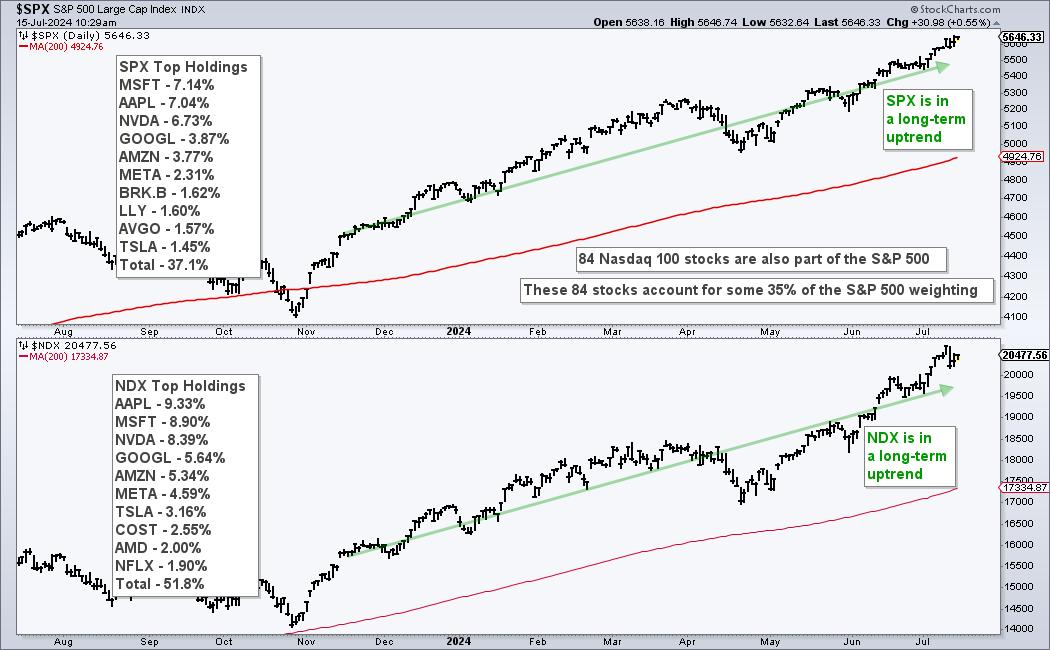
Using Nasdaq 100 Specific Breadth to Measure Risk Appetite

by Arthur Hill,
Chief Technical Strategist, TrendInvestorPro.com
KEY TAKEAWAYS
* Nasdaq 100 stocks account for over 30% of the S&P 500.
* Nasdaq 100 stocks represent the risk appetite in the stock market.
* Chartists can quantify the risk appetite using Nasdaq 100 specific breadth indicators.
The Nasdaq 100 is a major driver in the stock market and...
READ MORE
MEMBERS ONLY

Stock Market Makes Spectacular Run, and It's Not From the Popular Magnificent Seven
by Jayanthi Gopalakrishnan,
Director of Site Content, StockCharts.com
KEY TAKEAWAYS
* Stock market sees rally in areas aside from the Magnificent Seven stocks
* Small-cap stocks had an impressive performance in the last two trading days of the week
* The stock market continues to show its bullish strength as we enter earnings season
What a strange trip it's...
READ MORE
MEMBERS ONLY

Citi Predicts $3,000 Gold by 2025 — What You Need to Know
by Karl Montevirgen,
The StockCharts Insider
KEY TAKEAWAYS
* What the Fed does in the coming months could dramatically affect the direction of gold prices
* While seasonality suggests a shift from slump to strong performance for gold, it will likely coincide with the Fed's rate decisions in the coming months
* Goldman Sachs projects gold to...
READ MORE
MEMBERS ONLY

NVDA & Mag 7 Breaking Down; Russell 2000 (IWM) and Retail (XRT) Get "Silver Cross" BUY Signals
by Carl Swenlin,
President and Founder, DecisionPoint.com
by Erin Swenlin,
Vice President, DecisionPoint.com
KEY TAKEAWAYS
* NVIDIA (NVDA) breaks down with Magnificent Seven
* Russell 2000 (IWM) gets IT Trend Model "Silver Cross" BUY Signal
This is a complimentary excerpt from the subscriber-only DecisionPoint Alert.
NVIDIA (NVDA) broke down today in what looks like an echo of last month's pullback. There...
READ MORE
MEMBERS ONLY

When Will the Stock Market's Bullish Momentum Snap? Charts You Need to Watch
by Jayanthi Gopalakrishnan,
Director of Site Content, StockCharts.com
KEY TAKEAWAYS
* The stock market could continue its bullish run on interest rate cut speculation
* The S&P 500 Equal-Weighted Index is a good indication of the health of the overall stock market
* Bond market action is often a leading indicator of stock market action
With the S&...
READ MORE
MEMBERS ONLY

They Say Three Steps and Stumble; This Market is Taking a Fourth
by Martin Pring,
President, Pring Research
The legendary technician Edson Gould had a rule that, after three discount rate hikes, the stock market would be likely to stumble. That doesn't apply to emerging markets, but it did make a catchy headline. What is relevant to the iShares MSCI Emerging Market ETF (EEM) is that,...
READ MORE
MEMBERS ONLY

The BEST Way to Track Stock and ETF Performance
by David Keller,
President and Chief Strategist, Sierra Alpha Research
In this edition of StockCharts TV'sThe Final Bar, available to watch below, Dave continues a three-part series on selecting top charts to follow every month. In this second episode, Dave reviews charts he and Grayson Roze selected in May and June, reflecting on what has happened, what has...
READ MORE
MEMBERS ONLY

Silver's AI Boom: The Next Big Trade You Need to Know About
by Karl Montevirgen,
The StockCharts Insider
KEY TAKEAWAYS
* Silver may be the next big "AI trade"
* While silver ETFs are seeing large outflows, silver futures are telling a different story
* Understanding silver's seasonal pattern and identifying the key levels to watch are critical
Over the last few years, the "AI trade&...
READ MORE
MEMBERS ONLY
Identifying Top Charts with Upside Potential in 2024
by David Keller,
President and Chief Strategist, Sierra Alpha Research
In this edition of StockCharts TV'sThe Final Bar, available to watch below, Dave begins a three-part series on selecting top charts to follow every month. In this first episode, he shares how he and Grayson Roze select the charts to include in the Top 10 lists using the...
READ MORE
MEMBERS ONLY
The Chart to Help Navigate a Summer Market Top
by David Keller,
President and Chief Strategist, Sierra Alpha Research
KEY TAKEAWAYS
* Value sectors have been consistently underperforming the benchmarks since the April market low
* Technology has outperformed the S&P 500 as well as other growth sectors in 2024
* Defensive sectors like Utilities and Consumer Staples may be the most important to watch, as they can demonstrate investor...
READ MORE
MEMBERS ONLY

Tesla Stock's Shocking Comeback: What You Need to Know Before July 23
by Karl Montevirgen,
The StockCharts Insider
KEY TAKEAWAYS
* TSLA's stock price surged 32% above its zone of congestion following its April 23 earnings report
* News of Tesla's dwindling inventories, plus expectations of a Fed rate cut before the end of the year (among other things), are fueling the stock's advance...
READ MORE
MEMBERS ONLY

One Rule to Drastically Improve Your Trading

by Joe Rabil,
President, Rabil Stock Research
On this week's edition of Stock Talk with Joe Rabil, Joe uses a chart of AAPL to demonstrate how properly using a MACD and ADX indicator combo increases your chances of success. He analyzes 10-Year Yields, Bitcoin, Tesla, Datadog, and ServiceNow. Going through all the sectors, Joe explains...
READ MORE
MEMBERS ONLY

Has Housing Topped Out for the Cycle?
by Martin Pring,
President, Pring Research
Residential housing is not important for its size relative to GDP, which, according to Copilot, is about 3-5%. Rather, due to its interest rate sensitivity, housing is significant because it is the first sector of the economy to turn at the end of a recession, and the first to turn...
READ MORE
MEMBERS ONLY

Should You Be Worried About Poor Market Breadth?
by David Keller,
President and Chief Strategist, Sierra Alpha Research
In this edition of StockCharts TV'sThe Final Bar, available to watch below, Dave celebrates the S&P 500 closing above 5500, laments the lack of market breadth, and provides updates on the infamous Hindenburg Omen. He also breaks down key levels to watch on charts of V,...
READ MORE
MEMBERS ONLY

Could AMZN's Stock Hit $3 Trillion Valuation? What You Need To Know
by Karl Montevirgen,
The StockCharts Insider
KEY TAKEAWAYS
* AMZN's stock price entered new all-time high territory, closing at $200.02; it could rise higher
* If AMZN's stock price dips, watch for key levels to enter a long position
* Amazons' next earnings report is expected to drop on August 1, 2024, which...
READ MORE
MEMBERS ONLY

AAPL and TSLA Kick Off Q2 With BREAKOUTS!
by David Keller,
President and Chief Strategist, Sierra Alpha Research
In this edition of StockCharts TV'sThe Final Bar, available to watch below, Dave lays out the strong seasonal pattern for the S&P 500 in July, highlights the breakouts in AAPL and TSLA, shares the painful breakdowns in MGM, WM and CCL, and addresses the sudden rise...
READ MORE
MEMBERS ONLY

DP Trading Room: Deflation...a Possibility?
by Erin Swenlin,
Vice President, DecisionPoint.com
Today's DP Trading Room was jam packed! The lead story is definitely the fact that deflation is another possibility that many are not talking about. We don't know if it will be the final outcome, but we have a link that discusses this possibility: https://hoisington....
READ MORE
MEMBERS ONLY

What to Expect This Month | Focus on Stocks: July 2024

by Larry Williams,
Veteran Investor and Author
Historically, July has seen stock prices move higher almost 80% of the time, cementing this in our trader's notebook as a time to stay home and trade. Others can vacation this month!
Chart 1 is my true seasonal pattern for the Dow for the last 124 years. It...
READ MORE
MEMBERS ONLY

Top 5 Stocks in "Go" Trends | Fri June 28, 2024

by Tyler Wood,
Co-founder, GoNoGo Charts®
KEY TAKEAWAYS
* Trend Continuation
* Breakouts
* Momentum Confirmation
* Bull Flags
Top 5 Stocks in "Go" Trends
Trend Continuation on Rising Momentum
GoNoGo Charts® highlight low-risk opportunities for trend participation with intuitive icons directly in the price action. The resurgence of momentum in the direction of the underlying price trend...
READ MORE
MEMBERS ONLY
Mastering GoNoGo Charting: Scanning Securities on StockCharts.com
by Tyler Wood,
Co-founder, GoNoGo Charts®
KEY TAKEAWAYS
* Scanning
* screening
* Idea Generation
* Market Breadth
Join Tyler Wood, CMT, in this insightful tutorial where he demonstrates how to effectively scan for GoNoGo conditions using StockCharts.com. GoNoGo Charts, a powerful method developed by Alex Cole and Tyler Wood, blend foundational tools in technical analysis into a powerful...
READ MORE
MEMBERS ONLY

The 4 Best Tech Stocks to Watch Now!
by David Keller,
President and Chief Strategist, Sierra Alpha Research
In this edition of StockCharts TV'sThe Final Bar, Dave shares charts for Palo Alto Networks, Arista Networks, Adobe Systems, and Fortinet, four tech stocks that are all pushing higher despite major indexes remaining sideways going into Friday's economic releases. He also breaks down the chart of...
READ MORE
MEMBERS ONLY

Can Nvidia's Stock Skyrocket Again? Key Levels to Watch Now!
by Karl Montevirgen,
The StockCharts Insider
KEY TAKEAWAYS
* NVDA shares prices are falling, but it doesn't necessarily mean that the AI trend is at an end
* Expect near-term weakness in NVDA's stock price but keep in mind that longer-term prospects present a different picture
* Watch key support levels since ultra-bullish sentiment could...
READ MORE
MEMBERS ONLY

Dow Transports Are Set for a Short-Term Rally, But Will It Be Enough?
by Martin Pring,
President, Pring Research
The Transportation Sector has been one of the weaker brethren of late. That's important, as this market average forms part of the Dow Theory, which many observers believe is currently signaling a bear market. However, back in January, I wrote a piece on the Dow Theorythat came to...
READ MORE
MEMBERS ONLY

Why Investors are Betting Big on Berkshire Hathaway Class B Shares Right Now
by Karl Montevirgen,
The StockCharts Insider
KEY TAKEAWAYS
* Berkshire Hathaway Class B shares are poised for an explosive breakout
* Fundamentally, BRK/B has been a consistent outperformer and is diversified among different sectors
* BRK/B is working its way through a symmetrical triangle formation and could breakout in either direction
Berkshire Hathaway needs no introduction. The...
READ MORE