MEMBERS ONLY

Why Investors are Betting Big on Berkshire Hathaway Class B Shares Right Now

by Karl Montevirgen,
The StockCharts Insider
KEY TAKEAWAYS
* Berkshire Hathaway Class B shares are poised for an explosive breakout
* Fundamentally, BRK/B has been a consistent outperformer and is diversified among different sectors
* BRK/B is working its way through a symmetrical triangle formation and could breakout in either direction
Berkshire Hathaway needs no introduction. The...
READ MORE
MEMBERS ONLY

Large-Cap Growth Threatens the S&P Rally

by Julius de Kempenaer,
Senior Technical Analyst, StockCharts.com
In this video from StockCharts TV,Julius takes a look at rotation among growth/value and size segments, followed by a look at current sector rotation. He detects an intraday sector rotation he has never seen before, which could be the prelude for a larger move.
This video was originally...
READ MORE
MEMBERS ONLY

Nvidia Plunges Over 6% to Mark the End of the AI Trade?

by David Keller,
President and Chief Strategist, Sierra Alpha Research
In this edition of StockCharts TV'sThe Final Bar, Dave tracks the rapid and concerning deterioration in semiconductors, with stocks like NVDA and AVGO pushing lower after last week's bearish candle patterns. He then dives into the downturn in Bitcoin, the impressive recovery for energy stocks, and...
READ MORE
MEMBERS ONLY

End of Quarter NASDAQ 100 Pile-On

by Bruce Fraser,
Industry-leading "Wyckoffian"
The NASDAQ 100 ($NDX) has been surging higher since October 2023 with the pace of advance accelerating in the second quarter of 2024. These 100 components are among the largest market capitalization NASDAQ Composite ($COMPQ) stocks. All of the ‘Magnificent-7' mega-caps are represented in this index. Now the second...
READ MORE
MEMBERS ONLY

Seasonality and Positive News Push These Stocks into an Uptrend

by Mary Ellen McGonagle,
President, MEM Investment Research
Last week, the broader market Indices hit another new high on Thursday before pulling back into Friday's close. Not all areas participated, however, as the recently explosive move into AI stocks ran into trouble later in the week. Instead, many of last week's top performers were...
READ MORE
MEMBERS ONLY

4 Ways To ENHANCE The Moving Averages On Your Charts

by Grayson Roze,
Chief Strategist, StockCharts.com
Moving averages are a crucial charting tool, but many of us aren't getting the most out of them. In this edition of StockCharts TV'sStockCharts in Focus, Grayson shows you how to enhance your moving averages with 4 unique charts, straight out of his own account. You&...
READ MORE
MEMBERS ONLY

Tech Stocks Take a Breather: Is Now the Best Time To Buy the Chip Dip?

by Jayanthi Gopalakrishnan,
Director of Site Content, StockCharts.com
KEY TAKEAWAYS
* Technology stocks end the week lower, breaking their winning streak
* Semiconductor stocks sell off and take the S&P 500 and Nasdaq Composite lower for the week
* Micron Technology announces earnings next week, which could mean the pullback may present an opportunity to load up on some...
READ MORE
MEMBERS ONLY

Why Technical Analysis Does NOT Work for Leveraged ETFs
by David Keller,
President and Chief Strategist, Sierra Alpha Research
In this edition of StockCharts TV'sThe Final Bar, Dave answers viewer questions on using technical indicators on leveraged and inverse ETFs like SOXL and SOXS, buying breakouts below the 200-day moving average, upside targets for gold, and whether the $USD is in a primary uptrend.
See Dave'...
READ MORE
MEMBERS ONLY

Gilead's Game-Changer: What You Need to Know About the Stock
by Karl Montevirgen,
The StockCharts Insider
KEY TAKEAWAYS
* Gilead Sciences' stock price got a boost from positive results of a late-stage trial of its HIV drug
* While Gilead still needs to replicate its results and seek FDA approval, this may be a good time for traders and investors to get in early on a potentially...
READ MORE
MEMBERS ONLY

Price Pays... But For How Long?
by Julius de Kempenaer,
Senior Technical Analyst, StockCharts.com
KEY TAKEAWAYS
* The number of new 52-week highs is declining
* The percentages of stocks trading above 200-,50-, and 20-day Exp Moving Averages are declining
* Despiote narrowing breadth, the S&P continues higher
While the S&P 500 continues to move higher, the number of stocks participating to...
READ MORE
MEMBERS ONLY

Investing with the Trend: Conclusions

by Greg Morris,
Veteran Technical Analyst, Investor, and Author
Note to the reader: This is the twenty-fifth and final in a series of articles I'm publishing here, taken from my book, "Investing with the Trend." Hopefully, you will find this content useful. Market myths are generally perpetuated by repetition, misleading symbolic connections, and the complete...
READ MORE
MEMBERS ONLY

Analyze This: Will the Dow Soar or Crash in 2024?
by Karl Montevirgen,
The StockCharts Insider
KEY TAKEAWAYS
* Analyst opinions of Dow Jones Industrial Average are mixed, with both bullish and bearish forecasts
* While some analysts expect the Dow to hit 40,000 this year, some say it can fall to 34,000
* Basic tools like trend lines and support-and-resistance, paired with Fibonacci Retracements, can help...
READ MORE
MEMBERS ONLY

Is the Eighteen-Month Dollar Index Trading Range About to be Resolved?

by Martin Pring,
President, Pring Research
Chart 1 shows that the Dollar Index has been in a trading range since the start of 2023. Its sheer size indicates the ultimate breakout could be followed by a sizeable move in either direction. It is also likely to have important implications for many different markets and asset classes....
READ MORE
MEMBERS ONLY

June & Gloom | Larry's "Family Gathering" June 18, 2024 Recording

by Larry Williams,
Veteran Investor and Author
June is here! Will it be bloom or gloom for the stock market?
In this month's Family Gathering video, Larry examines the current averages in the market and what the advance-decline line is telling us. He explains the Trading Day of the Month (TDOM) concept and how you...
READ MORE
MEMBERS ONLY

It's TOO EARLY to Be Bullish on Tesla
by David Keller,
President and Chief Strategist, Sierra Alpha Research
In this edition of StockCharts TV'sThe Final Bar, Dave breaks down an upside follow-through day for the S&P 500 and Nasdaq, and highlights the continued weakness in market breadth indicators. Dave identifies key levels to watch for GLD, FSLR, ENPH, TSLA, AVGO, and BIO. Focusing in...
READ MORE
MEMBERS ONLY

DP Trading Room: Natural Gas (UNG) Bearish Again?

by Erin Swenlin,
Vice President, DecisionPoint.com
Carl and Erin return to the trading room showing you the charts you need to see to start your week!
Carl covered the market trends and condition to start the program. He also covers Bitcoin, Dollar, Gold, Silver, Gold Miners, Bonds, Yields and Crude Oil.
Carl also gave us a...
READ MORE
MEMBERS ONLY

Could the QQQ Turn Dramatically Lower?
by David Keller,
President and Chief Strategist, Sierra Alpha Research
There is no denying the strength of the bullish primary trend for stocks off the April low. The Nasdaq 100 index continues to make new all-time highs, closing just under $480 on Friday after gaining about 3.5% over the last week. But will this incredible uptrend continue into July...
READ MORE
MEMBERS ONLY

Breadth Thrust Can Validate a New Bull Phase for Stocks
by David Keller,
President and Chief Strategist, Sierra Alpha Research
In this edition of StockCharts TV'sThe Final Bar, Dave describes how the "breadth thrust", popularized by legendary market strategist Martin Zweig, can help to validate a new bull phase for stocks. He answers viewer questions on pairs trades, running technical indicators like RSI on price ratios,...
READ MORE
MEMBERS ONLY

How to Stop the "Wealth Destroyers" by Deploying Your Sell Methodology

by Gatis Roze,
Author, "Tensile Trading"
"We are in the business of making mistakes. Winners make small mistakes. Losers make big mistakes."
There are zillions of cliches that paraphrase what Ned Davis said. The umbrella axiom with your portfolio should be to cut your losers.
Nude investing is what I label an investor without...
READ MORE
MEMBERS ONLY

Stock Market Pushes Higher, But Is There a Bond Market Surprise Brewing?
by Jayanthi Gopalakrishnan,
Director of Site Content, StockCharts.com
KEY TAKEAWAYS
* Cooler inflation data sees Treasury yields fall and bond prices rise
* The S&P 500 and Nasdaq Composite hit new highs as interest rate cuts could be on the horizon
* AAPL overcomes headwinds and is playing catchup while TSLA awaits results of a shareholder vote to approve...
READ MORE
MEMBERS ONLY
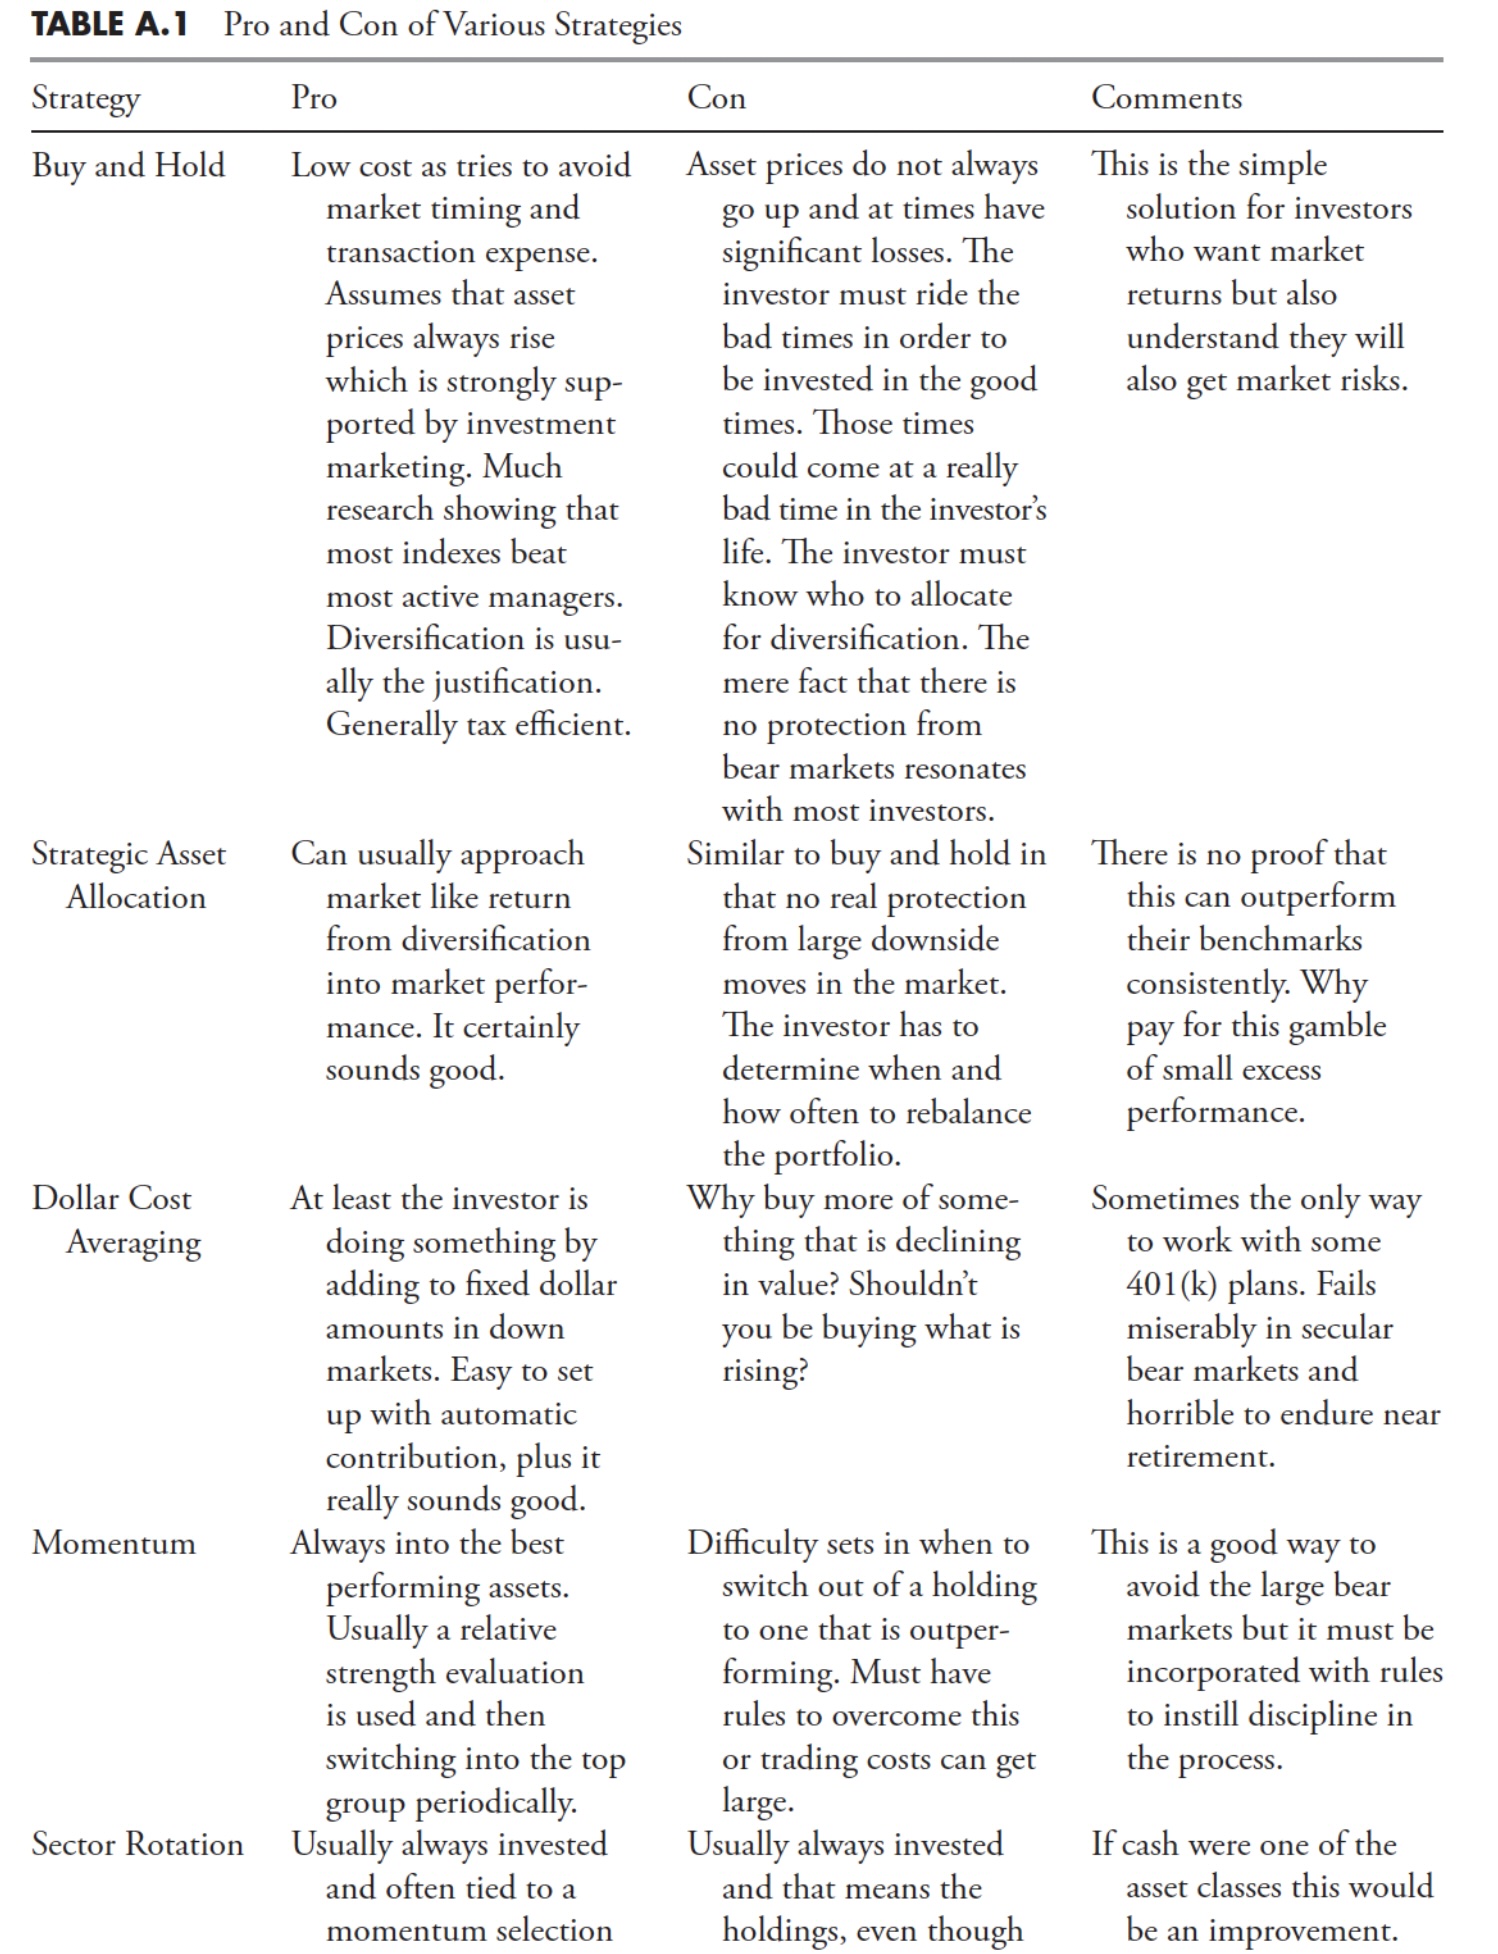
Investing with the Trend: Appendix
by Greg Morris,
Veteran Technical Analyst, Investor, and Author
Note to the reader: This is a set of appendices for a series of articles I'm publishing here, taken from my book, "Investing with the Trend." Hopefully, you will find this content useful. Market myths are generally perpetuated by repetition, misleading symbolic connections, and the complete...
READ MORE
MEMBERS ONLY

Bitcoin, Politics, and Profits: What You Need to Know About CleanSpark and Riot Platforms
by Karl Montevirgen,
The StockCharts Insider
KEY TAKEAWAYS
* A presidential contender expressed a desire to mine all remaining Bitcoin in the U.S.
* 90% of Bitcoin's total supply of 21 million has been mined
* If the remaining Bitcoin gets mined, it presents an unprecedented opportunity for two of the largest Bitcoin miners in the...
READ MORE
MEMBERS ONLY

S&P 500 Above 5400: Economic Optimism or Irrational Exuberance?
by David Keller,
President and Chief Strategist, Sierra Alpha Research
In this edition of StockCharts TV'sThe Final Bar, Dave recaps the continued optimism for technology shares following this morning's bullish CPI data and the Fed's statements suggesting a Goldilocks scenario for risk assets. He also breaks down key technical signals and levels for AAPL,...
READ MORE
MEMBERS ONLY

5 Simple and Powerful Uses for Moving Averages

by Joe Rabil,
President, Rabil Stock Research
On this week's edition of Stock Talk with Joe Rabil, Joe shows the five ways to use the Moving Average lines to help with decision making. He discusses how these lines can help to define trend reversals and confirmed trends, when to be on the alert for a...
READ MORE
MEMBERS ONLY

Apple Blasts Through $200 On AI Optimism
by David Keller,
President and Chief Strategist, Sierra Alpha Research
In this edition of StockCharts TV'sThe Final Bar, Dave reviews key charts from a technical analysis perspective, including AAPL, FSLR, MSTR, and STT. He also addresses the potential bearish momentum divergence for the S&P 500 index and reviews the negative breadth conditions, with new 52-week lows...
READ MORE
MEMBERS ONLY

DP Trading Room: Equal-Weight Losing Against Cap-Weight SPY
by Erin Swenlin,
Vice President, DecisionPoint.com
Did you know that the equally-weighted RSP is seriously underperforming the cap-weighted SPY? It is losing considerable ground against the SPY and that suggests that if mega-caps fail, so will go the market. Carl shows us charts to prove his point.
Next up Carl covers the market in general followed...
READ MORE
MEMBERS ONLY

Week Ahead: Despite Pullback, Breadth Remains a Concern; Nifty Still Prone to Retracement

by Milan Vaishnav,
Founder and Technical Analyst, EquityResearch.asia and ChartWizard.ae
The markets had an incredibly eventful week as they reacted to the exit polls and general election results. All happened in the same week; the Nifty saw itself forming a fresh lifetime high, and also came off close to 8% from its peak. A remarkable recovery also followed, which led...
READ MORE
MEMBERS ONLY

Tracking the Three Signs of the Bear
by David Keller,
President and Chief Strategist, Sierra Alpha Research
There is no denying that the primary trend for the S&P 500 remains bullish as we push to the end of Q2 2024. But what about the conditions "under the hood" of the major benchmarks? Today, we'll highlight three "signs of the bear&...
READ MORE
MEMBERS ONLY

META, AMZN and MSFT On The Move! Here's How to Pinpoint Entry
by Mary Ellen McGonagle,
President, MEM Investment Research
In this StockCharts TV video, Mary Ellen reviews what drove the markets to new highs. She highlights S&P 500 sectors, plus stocks that have reversed their downtrends, pointing out good entry points. Mary Ellen also takes a close look at why stocks did not respond to today'...
READ MORE
MEMBERS ONLY

NVIDIA's Stock Split and Potential Correction

by Carl Swenlin,
President and Founder, DecisionPoint.com
by Erin Swenlin,
Vice President, DecisionPoint.com
When Nvidia (NVDA) opens on Monday, it will have experienced a 10:1 split, and we should remember that one of the purposes of stock splits is to facilitate distribution. That is to say that the lower price after the split attracts investors who avoided the stock at the higher...
READ MORE
MEMBERS ONLY

S&P 500 Still Bullish: This Is What You Should Watch For
by Jayanthi Gopalakrishnan,
Director of Site Content, StockCharts.com
KEY TAKEAWAYS
* Stock market unfazed by today's jobs data
* Yields rise, US dollar rises, and equities close the week relatively flat
* Market breadth continues to be strong, indicating the stock market is still chugging along
It was a bit of a seesaw week in the stock market, but,...
READ MORE
MEMBERS ONLY

Only One Pocket of Strength Left in US Stock Market
by Julius de Kempenaer,
Senior Technical Analyst, StockCharts.com
KEY TAKEAWAYS
* Only Large-Cap Growth is on a positive RRG-Heading
* No segment, except LC Growth, has managed to take out its late March high
* $DJUSGL setting up for negative divergences
Breaking Down Into Growth / Value
Using Relative Rotation Graphs to help break down the US stock market into various segments...
READ MORE
MEMBERS ONLY

Technology Sector Participation Is Fading
by Carl Swenlin,
President and Founder, DecisionPoint.com
The Technology Sector (XLK) continues to dominate and drive the rally, but fewer and fewer stocks within the sector are participating in the rally. We know this because our Silver Cross Index (SCI), which shows the percent of stocks in the Technology Sector with Silver Cross BUY Signals (20-day EMA...
READ MORE
MEMBERS ONLY

Retail Stocks Caught in Limbo: Will RTH Break Free and Soar?
by Karl Montevirgen,
The StockCharts Insider
KEY TAKEAWAYS
* VanEck Vectors Retail ETF (RTH) holds 70% discretionary and 30% staples retail stocks
* Retail stocks have been on a steady long-term uptrend over the last 10 years
* Traders are likely to accumulate or sell positions depending on the Fed's interest rate decisions
VanEck Vectors Retail ETF...
READ MORE
MEMBERS ONLY

3 Keys to Finding the Strongest Trends
by Joe Rabil,
President, Rabil Stock Research
On this week's edition of Stock Talk with Joe Rabil, Joe shows the three keys he hunts for when identifying reversals and strong trends, giving a few examples and then showing one that is developing now. He then highlights similar techniques he uses while reviewing the Sectors. In...
READ MORE
MEMBERS ONLY

Will Spotify Smash Its All-Time High of $387?
by Karl Montevirgen,
The StockCharts Insider
KEY TAKEAWAYS
* Spotify's stock price has been trending higher for the last 16 months
* Spotify's stock price could reach its all-time high
* Analysts project Spotify's stock price to reach $400 in 2024 and $485 in 2025
Music streamer Spotify Technology (SPOT) isn't...
READ MORE
MEMBERS ONLY

It's Time to Take a Look at the Canadian and Australian Dollars and What They Imply for Inflation
by Martin Pring,
President, Pring Research
The Canadian and Aussie dollars have been confined between two converging trendlines since the beginning of the century, as we can see from Chart 1. The moment of truth appears to be close at hand, as both are approaching the apex of a giant potential symmetrical triangle.
One usually consistent...
READ MORE
MEMBERS ONLY

Week Ahead: Markets' Reaction to Exit Poll and General Election Results
by Milan Vaishnav,
Founder and Technical Analyst, EquityResearch.asia and ChartWizard.ae
The Indian equities experienced a notably eventful previous week, marked by a fresh lifetime high and a subsequent decline of over 400 points within the same week. Over the past five sessions, the Nifty 50 index fluctuated within a 693.80-point range before closing with a net weekly loss of...
READ MORE
MEMBERS ONLY

Hindenburg Omen Flashes Initial Sell Signal
by David Keller,
President and Chief Strategist, Sierra Alpha Research
While the S&P 500 did manage to finish the week above tactical support at 5250, one of the most widely-followed macro technical indicators recently registered an initial sell signal for the second time in 2024. Today we'll explain the three components of the Hindenburg Omen, show...
READ MORE
MEMBERS ONLY

Top 5 Stocks in "Go" Trends | Fri May 31, 2024

by Tyler Wood,
Co-founder, GoNoGo Charts®
KEY TAKEAWAYS
* Trend Continuation
* Breakouts
* Momentum Confirmation
* Bull Flags
Top 5 Stocks in "Go" Trends
Trend Continuation on Rising Momentum
GoNoGo Charts® highlight low-risk opportunities for trend participation with intuitive icons directly in the price action. The resurgence of momentum in the direction of the underlying price trend...
READ MORE