MEMBERS ONLY

Stay Ahead of the Markets with AUTOMATED Portfolio Reports

by Grayson Roze,
Chief Strategist, StockCharts.com
Staying on top of your portfolio in a fast-moving market can be a challenge. On this week's edition of StockCharts TV'sStockCharts in Focus, Grayson shows you how to make things easier on yourself with automated ChartList Reports for your portfolio. You'll learn how to...
READ MORE
MEMBERS ONLY

The Day the Yields Broke Out

by Martin Pring,
President, Pring Research
Wednesday brought an unexpected firming up of the inflation figures, causing analysts and commentators to trim the number of times they expect interest rates to be cut this year. Whenever it is that the questions turn away from whether to when and by how much, as was the case until...
READ MORE
MEMBERS ONLY
Using Outsized Moves to Identify Trend Reversals - Checking in on Housing and Semis

by Arthur Hill,
Chief Technical Strategist, TrendInvestorPro.com
KEY TAKEAWAYS
* Outsized Moves Can Jump Start Trends
* Chartists can use ATR-SAR to Identify Outsized Moves
* Housing and Retail are Leading Lower with Outsized Declines
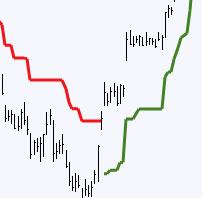
Trends often start with outsized moves. But how do we measure and identify such moves? Chartists can measure moves in Average True Range (ATR) terms...
READ MORE
MEMBERS ONLY

From Relic To Reckoning: Can Gold Surge To $3,000?

by Karl Montevirgen,
The StockCharts Insider
KEY TAKEAWAYS
* Gold is at record highs with retail investors buying despite sky-high valuations
* Fiscal, monetary, and geopolitical uncertainties are driving this "relic" turned "alternative currency"
* The technical context reveals a few strategic insights for anyone bullish on the yellow metal
The strange thing about gold...
READ MORE
MEMBERS ONLY

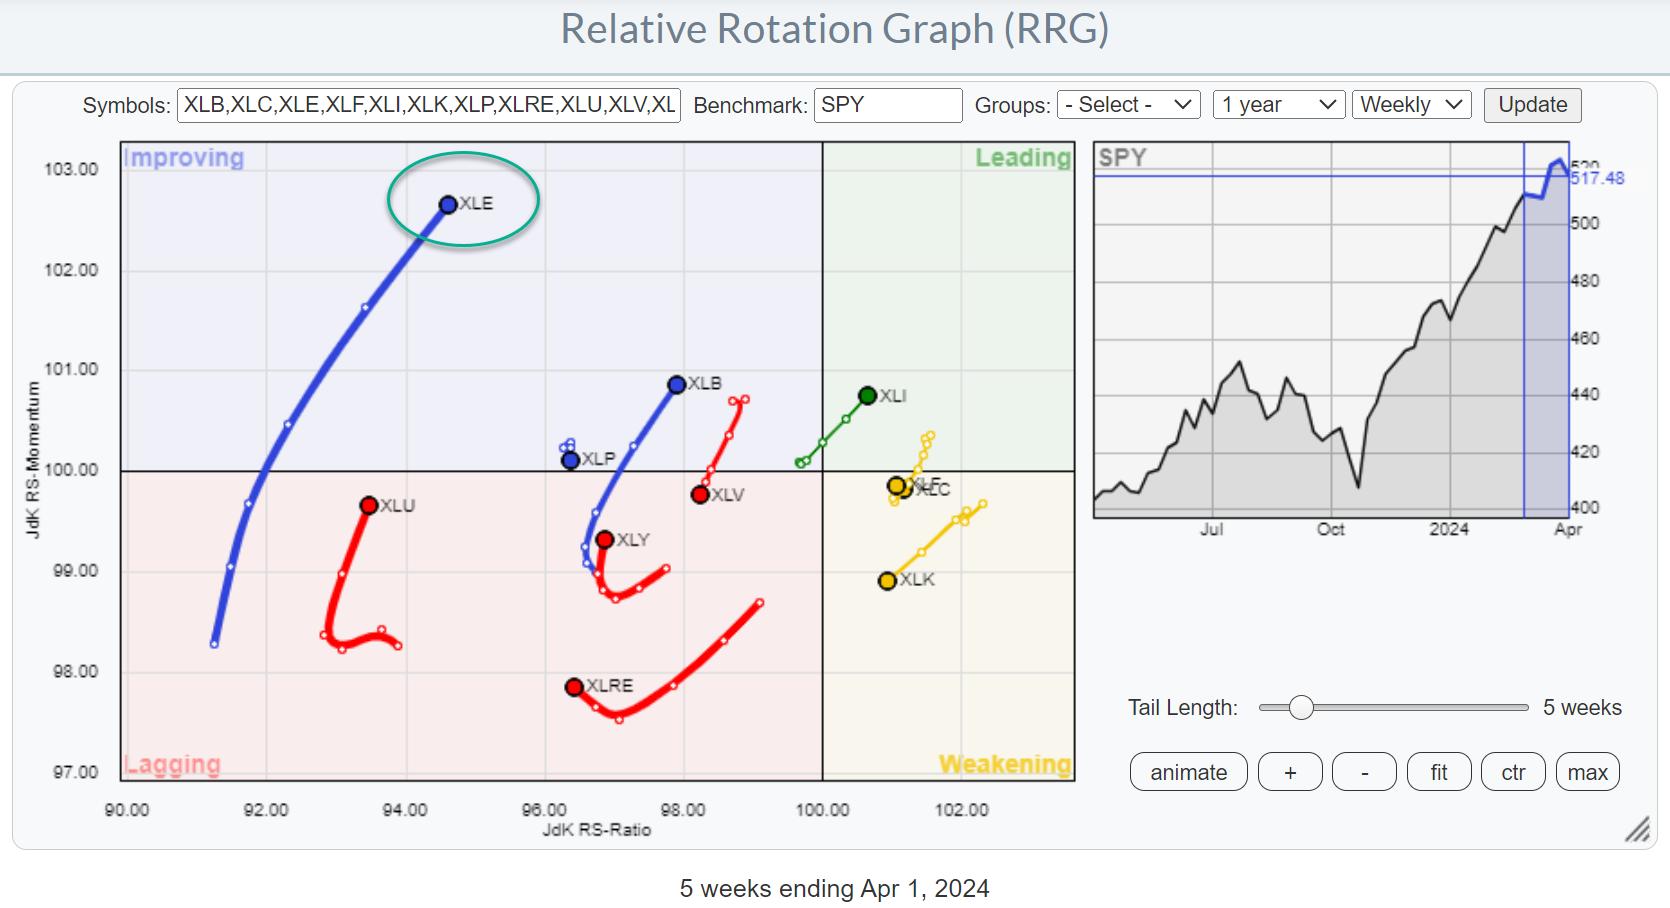
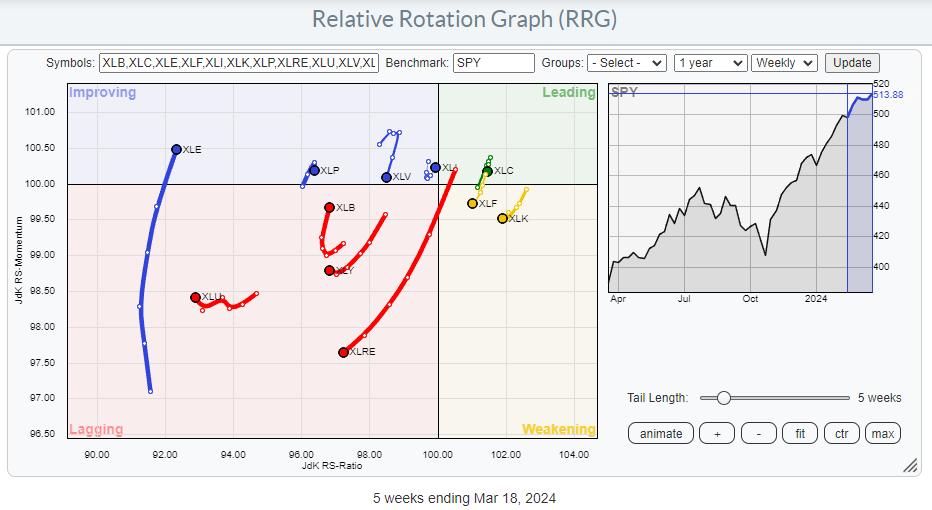
RRG Indicates That Non-Mega Cap Technology Stocks are Improving

by Julius de Kempenaer,
Senior Technical Analyst, StockCharts.com
KEY TAKEAWAYS
* The energy sector remains on a very strong rotational path
* A completed top formation in Healthcare opens up significant downside risk
* Smaller Technology stocks are taking over from mega-cap names
A Sector Rotation Summary
A quick assessment of current sector rotation on the weekly Relative Rotation Graph:
XLB:...
READ MORE
MEMBERS ONLY

NVDA is Holding Strong: It's Time to Think About Accumulating this Stock

by Jayanthi Gopalakrishnan,
Director of Site Content, StockCharts.com
KEY TAKEAWAYS
* NVDA stock is rising as the broader market sells off
* NVDA is technically and fundamentally strong and is outperforming the S&P 500
* NVDA's stock price has broken above a downward channel, which could be the start of the next uptrend
Sometimes, it helps to...
READ MORE
MEMBERS ONLY
Market Research and Analysis - Part 5: Drawdown Analysis

by Greg Morris,
Veteran Technical Analyst, Investor, and Author
Note to the reader: This is the sixteenth in a series of articles I'm publishing here taken from my book, "Investing with the Trend." Hopefully, you will find this content useful. Market myths are generally perpetuated by repetition, misleading symbolic connections, and the complete ignorance of...
READ MORE
MEMBERS ONLY

Is the Banking System on the Verge of Systemic Implosion? What to Look Out For
by Karl Montevirgen,
The StockCharts Insider
KEY TAKEAWAYS
* A few fringe economists are sounding the alarm on a looming series of banking collapses
* With bank holdings of government debt now underwater, some claim that banks are virtually insolvent as a result
* Whether any of this takes place, even partially, technical levels on the charts can help...
READ MORE
MEMBERS ONLY

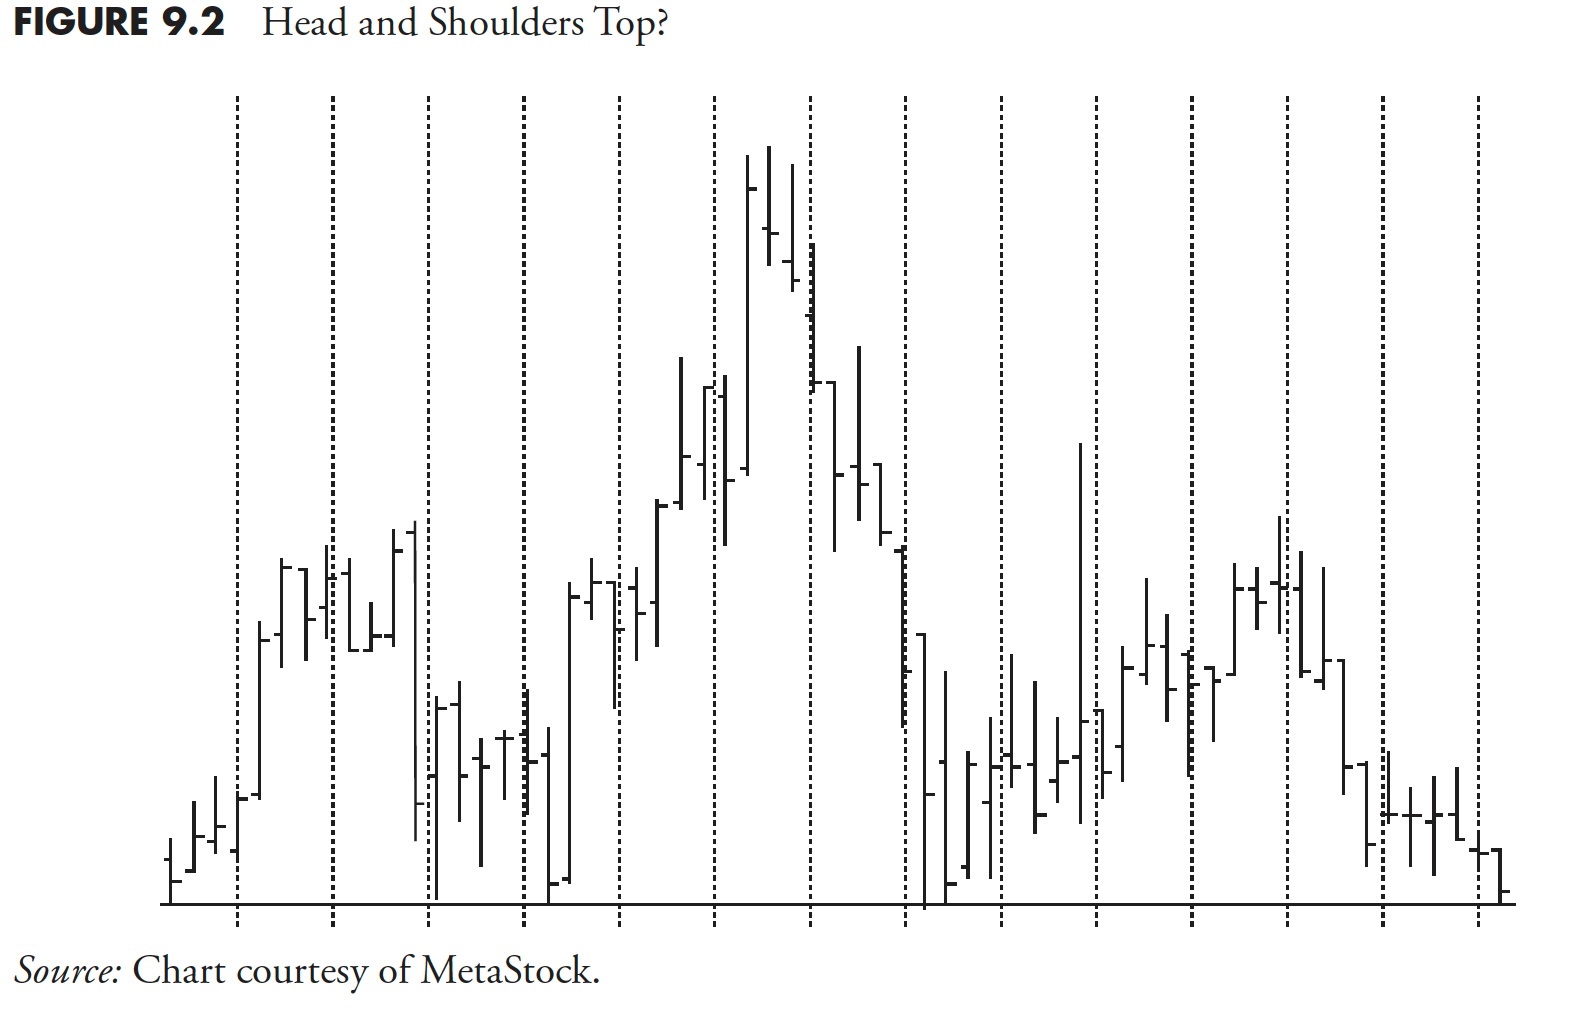
This Sector is Breaking Up and Down Simultaneously
by Martin Pring,
President, Pring Research
This may seem like a contradiction, but it is possible for two different things to be true at the same time.
What I am referring to is the fact that the health care sector (XLV) recently broke out from a consolidation reverse head-and-shoulders pattern, as we can see from the...
READ MORE
MEMBERS ONLY

Despite Stable Markets, Breadth Says Danger

by David Keller,
President and Chief Strategist, Sierra Alpha Research
In this edition of StockCharts TV'sThe Final Bar, Dave drops a market update, with a focus on Bitcoin's rebound above 70K, deteriorating short-term breadth conditions, and stocks still making new highs despite the market consolidation phase.
This video originally premiered on April 8, 2024. Watch on...
READ MORE
MEMBERS ONLY
Double Top Forming in Growth vs. Value?
by David Keller,
President and Chief Strategist, Sierra Alpha Research
In this edition of StockCharts TV'sThe Final Bar, Dave answers questions from The Final Bar Mailbag. Today he talks about how to use the ADX indicator, how growth vs. value may have formed a double top pattern, how to use VWAP for intraday and historical analysis, and what...
READ MORE
MEMBERS ONLY
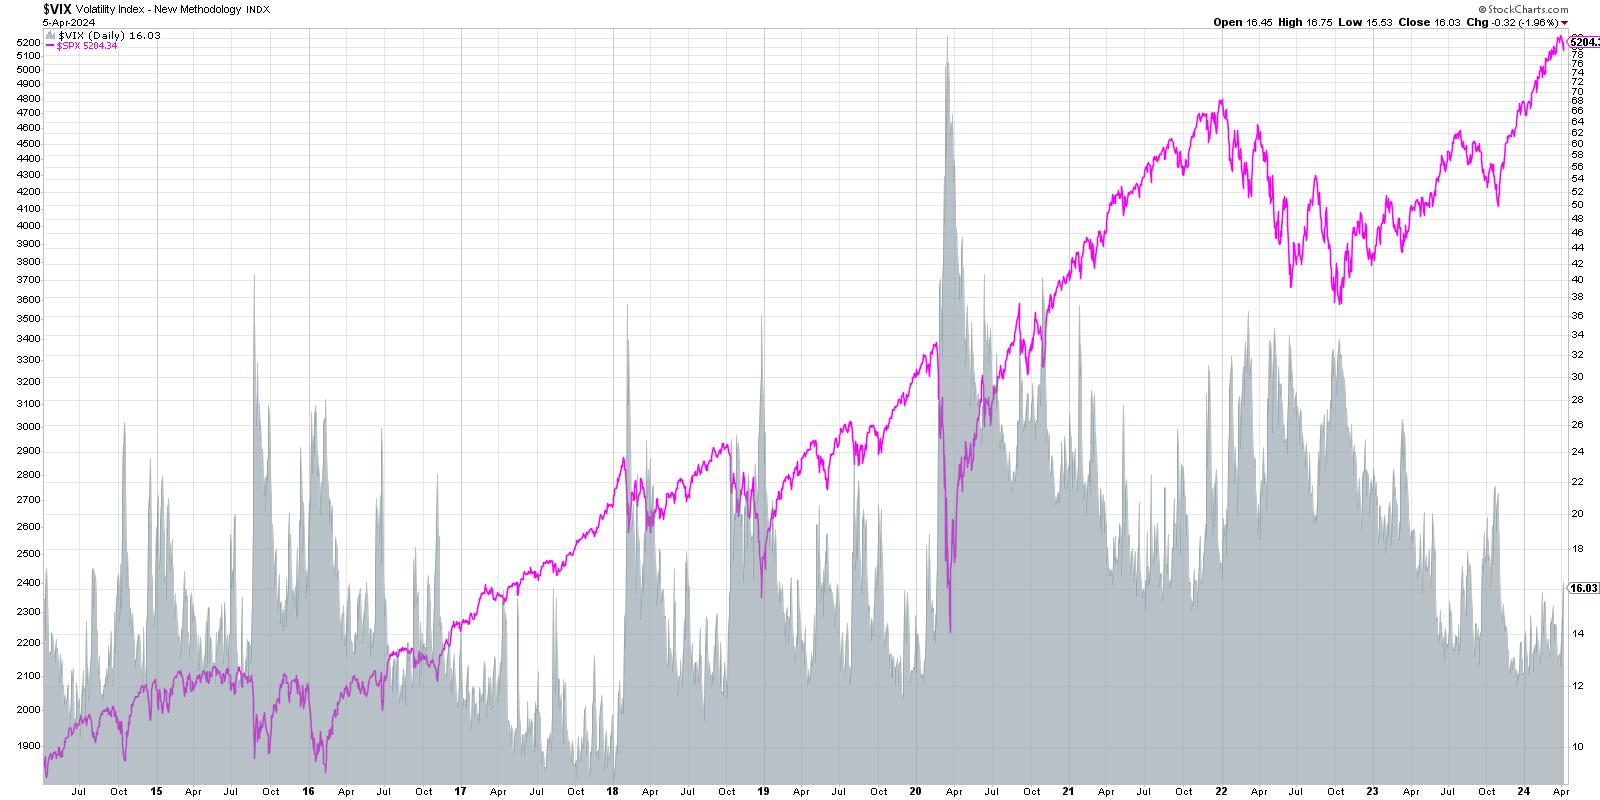
VIX Spikes Above 16 - Is This the End?
by David Keller,
President and Chief Strategist, Sierra Alpha Research
The VIX ended the week just above 16, bringing it to its highest level in 2024. What does this tell us about investor sentiment, and how does this compare to previous market cycles?
Let's take a quick tour of market history through the lens of the VIX, focusing...
READ MORE
MEMBERS ONLY
Energy is on Fire
by Julius de Kempenaer,
Senior Technical Analyst, StockCharts.com
KEY TAKEAWAYS
* Energy sector is breaking higher on price chart
* XLE's RRG tail is continuing to pick up steam
* The exploration & production industry is leading inside the energy sector
Strong Rotation on the Weekly RRG
For a few weeks now, the improvement in the energy sector (XLE)...
READ MORE
MEMBERS ONLY

Silver's Surge: Can It Reach $50 an Ounce This Year?
by Karl Montevirgen,
The StockCharts Insider
KEY TAKEAWAYS
* Several analysts have grown exceedingly bullish on silver which has been undervalued for some time
* Price targets are now at the range of $35 to $50 an ounce
* The technical outlook presents a mixed picture, but there are a few key levels to watch if you're...
READ MORE
MEMBERS ONLY
Spot Big Reversals Using the ADX Indicator

by Joe Rabil,
President, Rabil Stock Research
On this week's edition of Stock Talk with Joe Rabil, Joe demonstrates how to use the "Big Green Bar" candlestick pattern. This candlestick provides great confirmation on certain types of entry points, and can also be helpful for exits. Joe finishes up the show covering the...
READ MORE
MEMBERS ONLY
Should You be Concerned About These Four Stocks?
by David Keller,
President and Chief Strategist, Sierra Alpha Research
In this edition of StockCharts TV'sThe Final Bar, Dave and guest Julius de Kempenaer of RRG Research talk sector rotation, growth vs. value, offense vs. defense, and an outlook for the US equity markets as we begin Q2 2024. Dave also charts the strong breadth readings and low...
READ MORE
MEMBERS ONLY

DJT Has Closed Last Week's Gap, But is It Enough?
by Martin Pring,
President, Pring Research
Sometimes, simple indicators like bar or candlesticks operate just as the textbooks tell us they should. I don't normally follow individual stocks, but the hype surrounding last week's listing of Trump Media piqued my interest to see if the technical position squared with what the many...
READ MORE
MEMBERS ONLY
DP Trading Room: On-Balance Volume (OBV) Explained

by Erin Swenlin,
Vice President, DecisionPoint.com
Today Carl and Erin cover the topic of On-Balance Volume (OBV) as a representation of volume trends. This came to their attention as they uncovered an OBV negative divergence on the SPY chart.
Carl completes a review of the weekly charts for the Magnificent 7 stocks, giving us a more...
READ MORE
MEMBERS ONLY

Business Confidence and Stocks | Focus on Stocks: April 2024

by Larry Williams,
Veteran Investor and Author
Here comes the answer to a very old question, "Do stocks lead the economy, does the economy lead the stock market, or is there something else?"
My work has shown numerous times that GDP is not a good predictor of the Dow Jones. Also, business inventories and a...
READ MORE
MEMBERS ONLY
Overbought Conditions Reflect Strength and Said Strength Drives Momentum Rotation Strategies
by Arthur Hill,
Chief Technical Strategist, TrendInvestorPro.com
KEY TAKEAWAYS
* Overbought is just another term for strong. RSI above 70 shows strong upside momentum, which his bullish. Stocks can become overbought (strong) and remain strong.
Momentum and trend strategies are off to a roaring start here in 2024. More often than not, these strategies buy leading stocks that...
READ MORE
MEMBERS ONLY
Core PCE Data Has Powell Pleased - May Set Tone For Q2

by Mary Ellen McGonagle,
President, MEM Investment Research
The Fed's preferred gauge of inflation was released today and, according to Fed chief Jerome Powell, "it was good," as there were no ugly surprises. This news could boost the markets, as sticky inflation data has had investors on edge amid interest rates that have remained...
READ MORE
MEMBERS ONLY

Which Magnificent 7 Stock Would You Pick for Q2?
by David Keller,
President and Chief Strategist, Sierra Alpha Research
This article represents an exercise I like to call the "Single Stock Portfolio". In this scenario, you can only own one stock in your portfolio for the next three months, and you can pick any one of the following eight stocks. Which one would you select, and why?...
READ MORE
MEMBERS ONLY

Buy Breakout or Fade Divergence on Growth Stocks?
by David Keller,
President and Chief Strategist, Sierra Alpha Research
In this edition of StockCharts TV'sThe Final Bar, Dave presents a mailbag show discussing key technical analysis topics. He covers breakouts, the role of TSX, CCI signals, Gartner Group (IT) strategies, seasonal patterns, ATR use, NVDA Fibonacci retracements, and managing high-yield stocks like GLP. You don't...
READ MORE
MEMBERS ONLY
These Breadth Charts PROVE How Strong This Bull Market Is
by Grayson Roze,
Chief Strategist, StockCharts.com
On this week's edition of StockCharts TV'sStockCharts in Focus, Grayson explains the importance of market breadth and shares some of the most crucial charts for understanding what's truly happening beneath the surface of the market. Using the Sample Chart Gallery, you'll see...
READ MORE
MEMBERS ONLY
How to Analyze Volume Trends on Multiple Time Frames
by David Keller,
President and Chief Strategist, Sierra Alpha Research
In this edition of StockCharts TV'sThe Final Bar, Dave highlights charts breaking above resistance levels, including Gold Shares (GLD), Phillips 66 (PSX), Capital One Fence Corp (COF), Freeport-McMoRan (FCX), and DraftKings (DKNG). Dave also interviews Buff Dormeier of Kingsview Investment Management, who shows how he uses RSI, the...
READ MORE
MEMBERS ONLY
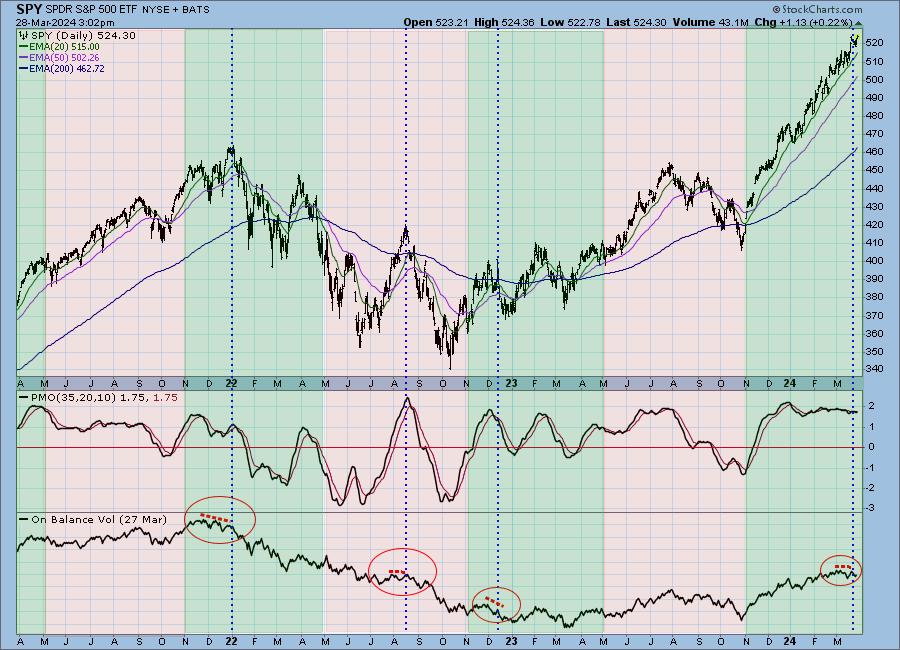
One Month of Positive Seasonality Remaining -- OBV Says, "Maybe Not."

by Carl Swenlin,
President and Founder, DecisionPoint.com
The late Yale Hirsch (Stock Trader's Almanac) has long been known for identifying the six-month periods of positive and negative seasonality in the stock market. The positive period is November through April, and the negative period is May through October. We are currently in a positive period, which...
READ MORE
MEMBERS ONLY
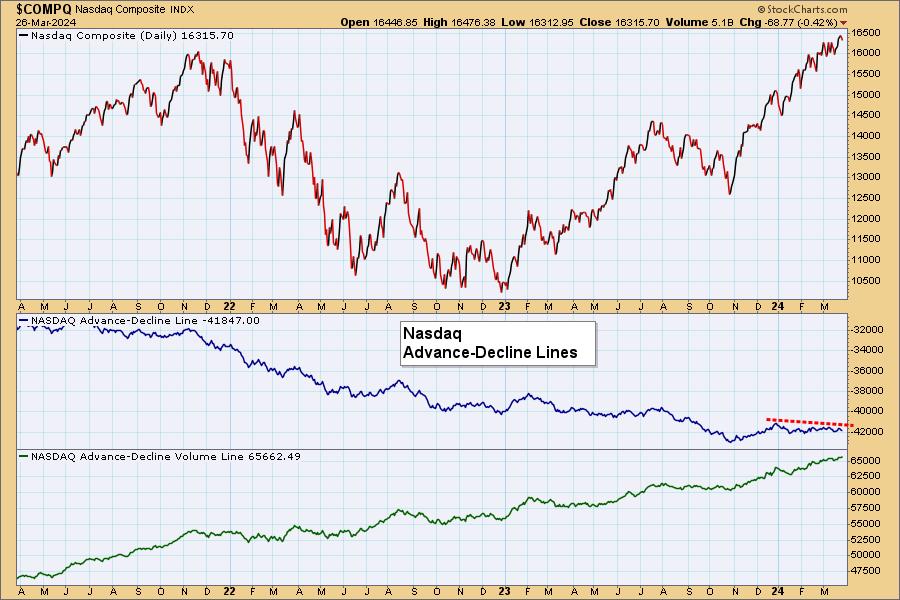
Surprise Negative Divergence on Nasdaq Advance-Decline Line
by Erin Swenlin,
Vice President, DecisionPoint.com
We were perusing the Advance-Decline Line charts that we have and noticed something that surprised us. The Nasdaq Advance-Decline Line is trending lower while prices continue higher. This is negative divergence we didn't expect to see.
What makes that negative divergence even more interesting is looking at the...
READ MORE
MEMBERS ONLY

Don't Bet on Lower Rates
by Martin Pring,
President, Pring Research
To paraphrase the late great contrarian Humphrey Neil: When everyone thinks alike, it's usually time to look for a turn in the market.
It seems to me, after reviewing an unscientific survey of the financial media, that everyone and his dog (no disrespect to our canine friends) is...
READ MORE
MEMBERS ONLY

DP Trading Room: Shake Up at Boeing (BA)
by Erin Swenlin,
Vice President, DecisionPoint.com
Today Carl and Erin reviewed the Boeing (BA) chart together discussing the technical ramifications of the step down of the CEO and two other board members. We do note that the CEO will finish out the year so problems could continue throughout the year. The technicals on the chart are...
READ MORE
MEMBERS ONLY
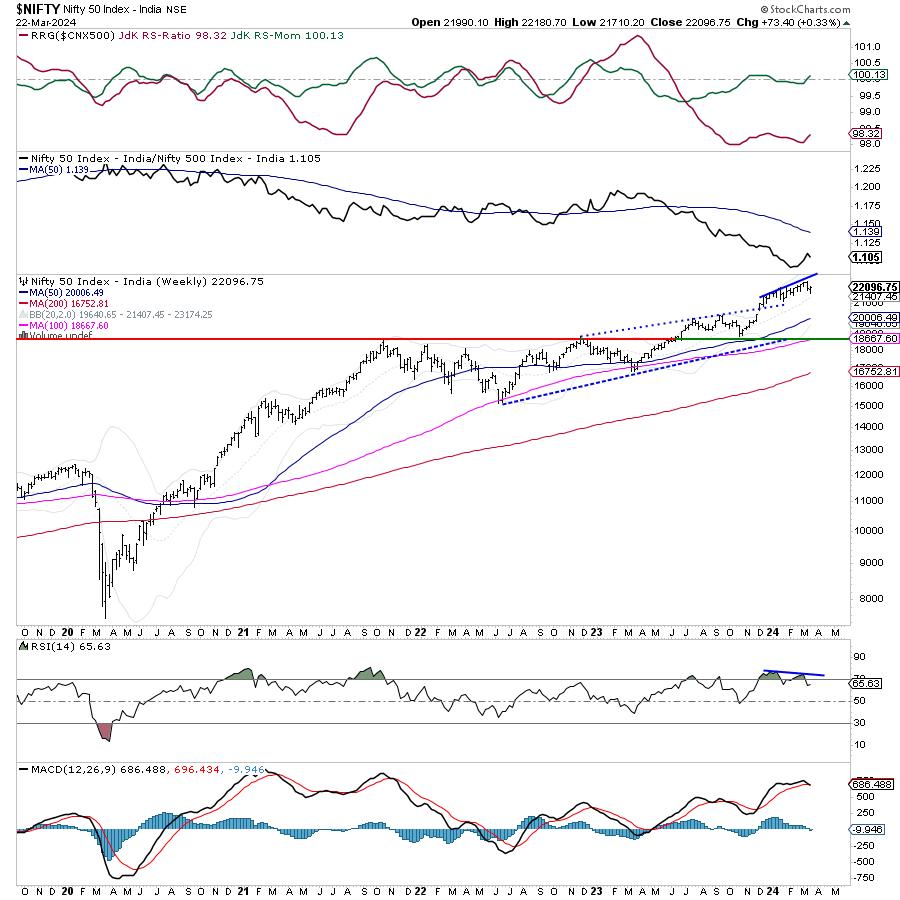
Week Ahead: Short Week May Not See NIFTY Adopting Sustained Directional Bias; Volatility May Return

by Milan Vaishnav,
Founder and Technical Analyst, EquityResearch.asia and ChartWizard.ae
After a corrective action the week before, the markets continued to wear a tentative look throughout this past week as well.
In the previous technical note, it was mentioned that the level of 22525 has become an intermediate top for the markets, and any runway upsides should not be expected....
READ MORE
MEMBERS ONLY

An Indicator to Define the Trend and Quantify Momentum
by Arthur Hill,
Chief Technical Strategist, TrendInvestorPro.com
The 200-day SMA is perhaps the most widely used long-term moving average. As its name implies, it is a simple indicator that chartists can use for trend-following and momentum strategies. For trend-following, we just need to know where prices stand relative to the 200-day SMA. For momentum, we need to...
READ MORE
MEMBERS ONLY

Look Out Below! The Bear Case For Apple
by David Keller,
President and Chief Strategist, Sierra Alpha Research
KEY TAKEAWAYS
* While the long-term trend in Apple has been quite strong, the weekly charts shows a clear double-top pattern with declining momentum.
* Our Market Trend Model currently reads short-term bearish, medium-term bearish, and long-term bullish.
* A break below price support around $169 could open the door to further downside,...
READ MORE
MEMBERS ONLY
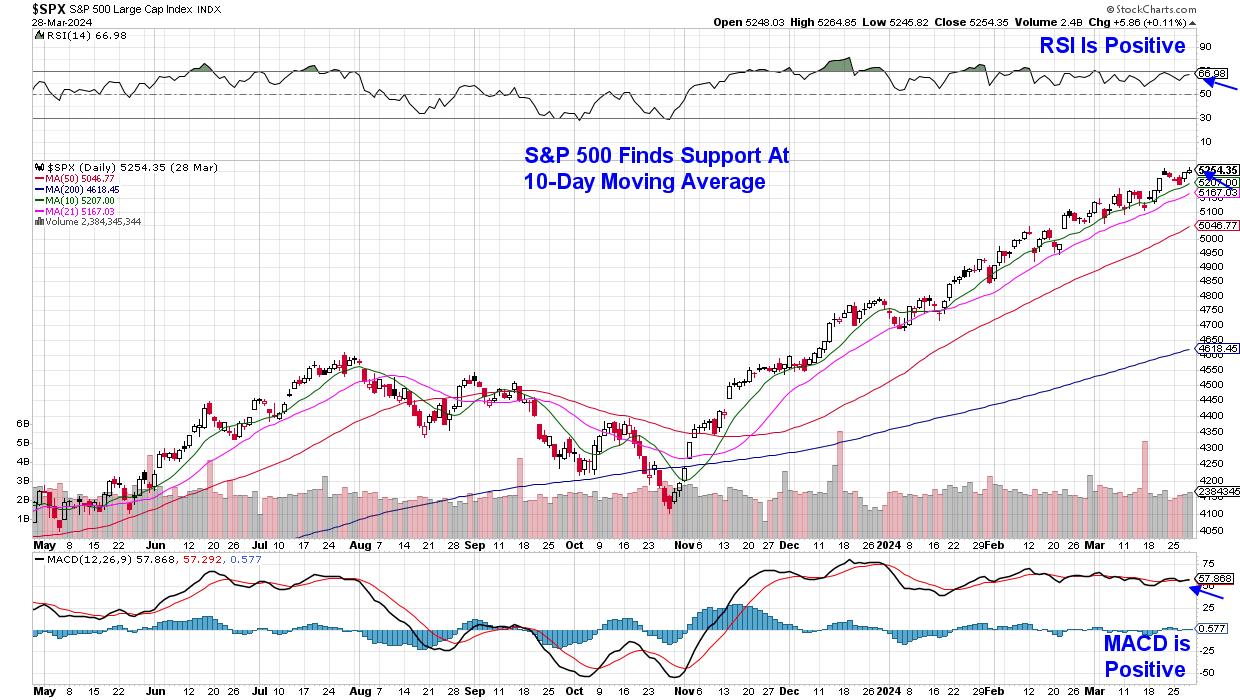
The Stock Market This Week: What This Surging Bull Means
by Jayanthi Gopalakrishnan,
Director of Site Content, StockCharts.com
KEY TAKEAWAYS
* The Dow Jones Industrial Average, S&P 500, and Nasdaq Composite are holding strong
* Gold and the US dollar trend higher in spite of dovish Fed comments
* Cannabis stocks trade higher on news of partial legalization in Germany
It was an action-packed week in the stock market....
READ MORE
MEMBERS ONLY

MEM TV: Get In EARLY! These Areas Are Seeing LIFT OFF
by Mary Ellen McGonagle,
President, MEM Investment Research
In this episode of StockCharts TV'sThe MEM Edge, Mary Ellen reviews what's shaping up in the broader markets after the Fed announced their rate cut plans. She also shares how to use ETFs to shape your investment decisions for the longer term. In addition, Mary Ellen...
READ MORE
MEMBERS ONLY

The Best Leading Indicator for Stocks
by David Keller,
President and Chief Strategist, Sierra Alpha Research
In this edition of StockCharts TV'sThe Final Bar, Dave brings you another mailbag show! Explore the differences between RSI and Accumulation Distribution for stocks. Compare the benefits of SharpCharts or ACP on StockCharts. Understand the nuances between Keltner and Bollinger Bands. Discover why considering sector trends and using...
READ MORE
MEMBERS ONLY

Is China a Basket Case or a Screaming Buy?
by Martin Pring,
President, Pring Research
By now it's common knowledge that the Chinese property sector is in crisis, foreign investment has slowed, and youth unemployment is at record levels. Should be time to sell Chinese equities, right? After all, we don't know when the other shoe is going to drop. They...
READ MORE
MEMBERS ONLY
Market Research and Analysis - Part 2: Using Technical Indicators
by Greg Morris,
Veteran Technical Analyst, Investor, and Author
Note to the reader: This is the thirteenth in a series of articles I'm publishing here taken from my book, "Investing with the Trend." Hopefully, you will find this content useful. Market myths are generally perpetuated by repetition, misleading symbolic connections, and the complete ignorance of...
READ MORE
MEMBERS ONLY
Coinbase Stock Didn't Crash, But the Trade Still Raked in Cash
by Karl Montevirgen,
The StockCharts Insider
KEY TAKEAWAYS
* Technical indicators suggested that Coinbase stock was due for a pullback
* The scenario identified a clear short setup with multiple price targets and stop-loss levels
* Coinbase eventually dipped but the risk may have been greater than the reward
As a trader, calling market tops (or bottoms) is a...
READ MORE
MEMBERS ONLY
Downside Risk in a Bullish Market
by David Keller,
President and Chief Strategist, Sierra Alpha Research
In this edition of StockCharts TV'sThe Final Bar, Dave welcomes guest Chris Ciovacco of Ciovacco Capital Management. David focuses on downside risk for GOOGL and AMZN, and shares one utility name that should be on your radar! Chris updates a weekly S&P 500 chart he first...
READ MORE
MEMBERS ONLY
Energy: A Long-Term Turnaround in Relative Strength is Brewing
by Julius de Kempenaer,
Senior Technical Analyst, StockCharts.com
KEY TAKEAWAYS
* Energy sector showing relative strength in three timeframes
* The sector is nearing a heavy resistance area
* A long-term turnaround in relative strength appears to be underway
Energy Improving in Three Time Frames
Watching the sector rotation at the start of this week shows a continued improvement for the...
READ MORE