MEMBERS ONLY

Putting a Mean-Reversion Strategy Into Practice

by Arthur Hill,
Chief Technical Strategist, TrendInvestorPro.com
Mean-reversion strategies typically buy stocks when they are oversold, which means catching the falling knife. These declines are often rather sharp, but the odds favor some sort of bounce after reaching an oversold extreme. While there are no guarantees, chartists can mitigate risk by insuring that the stock is still...
READ MORE
MEMBERS ONLY

Three Charts to Track Impending Doom

by David Keller,
President and Chief Strategist, Sierra Alpha Research
KEY TAKEAWAYS
* January through March is the weakest three-month period for stocks in an election year.
* The McClellan Oscillator turned bearish this week, suggesting at least a short-term pullback for stocks.
* The VIX remains low, but a push above 15 could indicate further downside, retracing the gains from Q4.
Okay,...
READ MORE
MEMBERS ONLY
Prepare for 2024: Martin Pring's Expert Insights on the Equity Market

by Martin Pring,
President, Pring Research
In this must-see once a year special, Martin breaks down his comprehensive equity market outlook for 2024, accompanied by Bruce Fraser.
Encompassing a secular (multi-business cycle) perspective of the forces that are likely to influence stocks and bonds over the coming years, Martin presents a look ahead at what'...
READ MORE
MEMBERS ONLY

Supercharge Your SUCCESS with The Ultimate List of Prebuilt Charts

by Grayson Roze,
Chief Strategist, StockCharts.com
On this week's edition of StockCharts TV'sStockCharts in Focus, Grayson kicks off the New Year by hooking you up with every chart you could ever need, and you don't have to create a single one yourself! In just a couple of clicks, you can...
READ MORE
MEMBERS ONLY

Add Happiness To Your Portfolio With a Sprinkle of Disney Stock

by Jayanthi Gopalakrishnan,
Director of Site Content, StockCharts.com
KEY TAKEAWAYS
* Disney's stock price is showing signs of consolidation and may be worth watching for signs of a breakout
* The stock is at a critical support level and if the stock is able to hold this support, it could be positive for the stock
* A break above...
READ MORE
MEMBERS ONLY

Discover the Hottest Sectors of 2024!

by Joe Rabil,
President, Rabil Stock Research
On this week's edition of Stock Talk with Joe Rabil, Joe explains how to use the MACD zero line in 2 consecutive timeframes to identify ideal entry zones. He presents two examples of how this pattern works and when to enter. He also examines what he is seeing...
READ MORE
MEMBERS ONLY

January: NASDAQ Has the Best Odds of Gains, BUT...
"January provides us with a wealth of information that gets our year off to a good start, financially and emotionally.
"The data is specifically chosen to begin in 2009 because that is the bottom of the most significant bear market prior to the 2022 bear market, and 2009...
READ MORE
MEMBERS ONLY

Sprouts Farmers Market: A Hidden Gem on the Corner of Wall and Main Street?

by Karl Montevirgen,
The StockCharts Insider
KEY TAKEAWAYS
* Sprouts Farmers Market has been riding a relatively steady uptrend channel over the last year
* More dominant on Main Street than Wall Street, its earnings have been yielded positive surprises almost every quarter since 2019
* Look for SFM stock to pull back to its 50-day SMA
Most traders...
READ MORE
MEMBERS ONLY

Technology Shares PLUNGE to Kick Off 2024
by David Keller,
President and Chief Strategist, Sierra Alpha Research
In this edition of StockCharts TV'sThe Final Bar, guest Mish Schneider of MarketGauge talks strength in small caps, leadership in retail, and the importance of watching junk bonds for risk-on conditions. Dave charts pullbacks in AAPL and NVDA, and shares two names pushing higher as value beats growth...
READ MORE
MEMBERS ONLY

MRNA Stock Gets an Upgrade: When is the Best Time To Buy?
by Jayanthi Gopalakrishnan,
Director of Site Content, StockCharts.com
KEY TAKEAWAYS
* MRNA stock surges on the potential of widening its vaccine offerings
* Moderna's stock price has crossed above its upper Bollinger Band and is showing technical strength
* Look for MRNA's stock price to move above its 50-week moving average
Last year's vaccine sales...
READ MORE
MEMBERS ONLY

The Science and Art of Stock Market Predictions
Over the holiday, I thought a lot about predictions and how they are formed.
The dictionary meaning of prediction is a statement about a future eventor data.Many of the predictions for 2024 that I have seen are made by what we assume are knowledgeable people in the financial fields....
READ MORE
MEMBERS ONLY

Guidelines for 2024 | Focus on Stocks: January 2024

by Larry Williams,
Veteran Investor and Author
Let's Get This Out of The Way Right Now
For the last 18 years, I've had a love affair with my annual forecast report. Until I began writing this letter, it was the only thing I did. Many of you purchased it last year, and some...
READ MORE
MEMBERS ONLY

STRONG Indicators for 2024!

by TG Watkins,
Director of Stocks, Simpler Trading
On this week's edition of Moxie Indicator Minutes, TG points out how broadly supported the market has been this time around, and how he's seeing excellent setups on the higher time frames. He walks us through some of the action that is making him look forward...
READ MORE
MEMBERS ONLY

Unlocking Russell 2000 SECRETS & Volatility INSIGHTS!
by David Keller,
President and Chief Strategist, Sierra Alpha Research
In this special all-Mailbag edition of StockCharts TV'sThe Final Bar, Dave answers viewers' burning questions, ranging from the effectiveness of short-term moves with the 5-day MA to deciphering the mysteries of the Russell 2000's growth or value positioning and much more!
Click here to take...
READ MORE
MEMBERS ONLY
Ready Yourself for 2024 With Macro to Micro Analysis
For the new year, we have given you an extensive 3-pronged look at the markets.
First, we have the general outlook for the economy and markets through the Outlook 2024. This is the general outlook for 2024, including the recap of 2023 and how the predictions I made then played...
READ MORE
MEMBERS ONLY

Intermediate-Term Participation Levels Are Very Overbought, and They Are Weak Long-Term

by Carl Swenlin,
President and Founder, DecisionPoint.com
When we discuss participation, we are referring to the more specific and accurate assessment of breadth available with the Golden Cross and Silver Cross Indexes. The venerable and widely-known Golden Cross is when the 50-day moving average of a price index crosses up through the 200-day moving average, which signals...
READ MORE
MEMBERS ONLY

This Stock is up a Startling 90% This Year: Last Time This Happened Was in 2003
by Jayanthi Gopalakrishnan,
Director of Site Content, StockCharts.com
KEY TAKEAWAYS
* Intel stock is up over 90% in 2023 and could see further growth in 2024
* The stock crossed above its upper Bollinger Band and is now pulling back
* Any signs of a reversal followed by price action that confirms the uptrend is resuming will be an ideal entry...
READ MORE
MEMBERS ONLY

Is FedEx's Long-Term Uptrend in Jeopardy? Here's What to Watch.
by Karl Montevirgen,
The StockCharts Insider
KEY TAKEAWAYS
* A drop in global demand contributed to FedEx's quarterly earnings miss which caused the stock price to fall
* FedEx's stock price action reveals the critical price levels to watch for entry points
* Set technical price alerts at key support and resistance levels to closely...
READ MORE
MEMBERS ONLY
The Top Five Charts of 2023
by David Keller,
President and Chief Strategist, Sierra Alpha Research
KEY TAKEAWAYS
* 2023 was dominated by mega cap growth stocks, but the fourth quarter saw a potential change as other sectors experienced renewed vigor.
* Three breadth indicators provided great clarity to the up and down cycles over the course of the year, as extreme readings tended to coincide with major...
READ MORE
MEMBERS ONLY

Boost Your Trading Success with This Chart Trick
by Grayson Roze,
Chief Strategist, StockCharts.com
On this week's edition of StockCharts TV'sStockCharts in Focus, Grayson we reveals a useful chart trick that will revolutionize your trading toolkit. Get ready to dive into the site, explore the tools, and walk through the features that will help you maximize the value of your...
READ MORE
MEMBERS ONLY

Is Sentiment Too Bullish?

by Erin Swenlin,
Vice President, DecisionPoint.com
KEY TAKEAWAYS
* NAAIM Sentiment - No Leverage
* AAII Sentiment Highly Bullish
* Rydex Bull Assets Have Room to Move Higher
(This is an excerpt from today's subscriber-only DP Alert.)
We thought it might be a good idea to review sentiment today. It should be no surprise that investors are...
READ MORE
MEMBERS ONLY

GNG TV: Buying Opportunity or Trend Reversal?

by Alex Cole,
Co-founder, GoNoGo Charts®

by Tyler Wood,
Co-founder, GoNoGo Charts®
In this edition of the GoNoGo Charts show, Tyler and Alex dive into the current trends and momentum in the markets, in order to help navigate through the ever-changing landscape of stocks, bonds, commodities, and the dollar. Is the recent pullback in the S&P 500 is just a...
READ MORE
MEMBERS ONLY

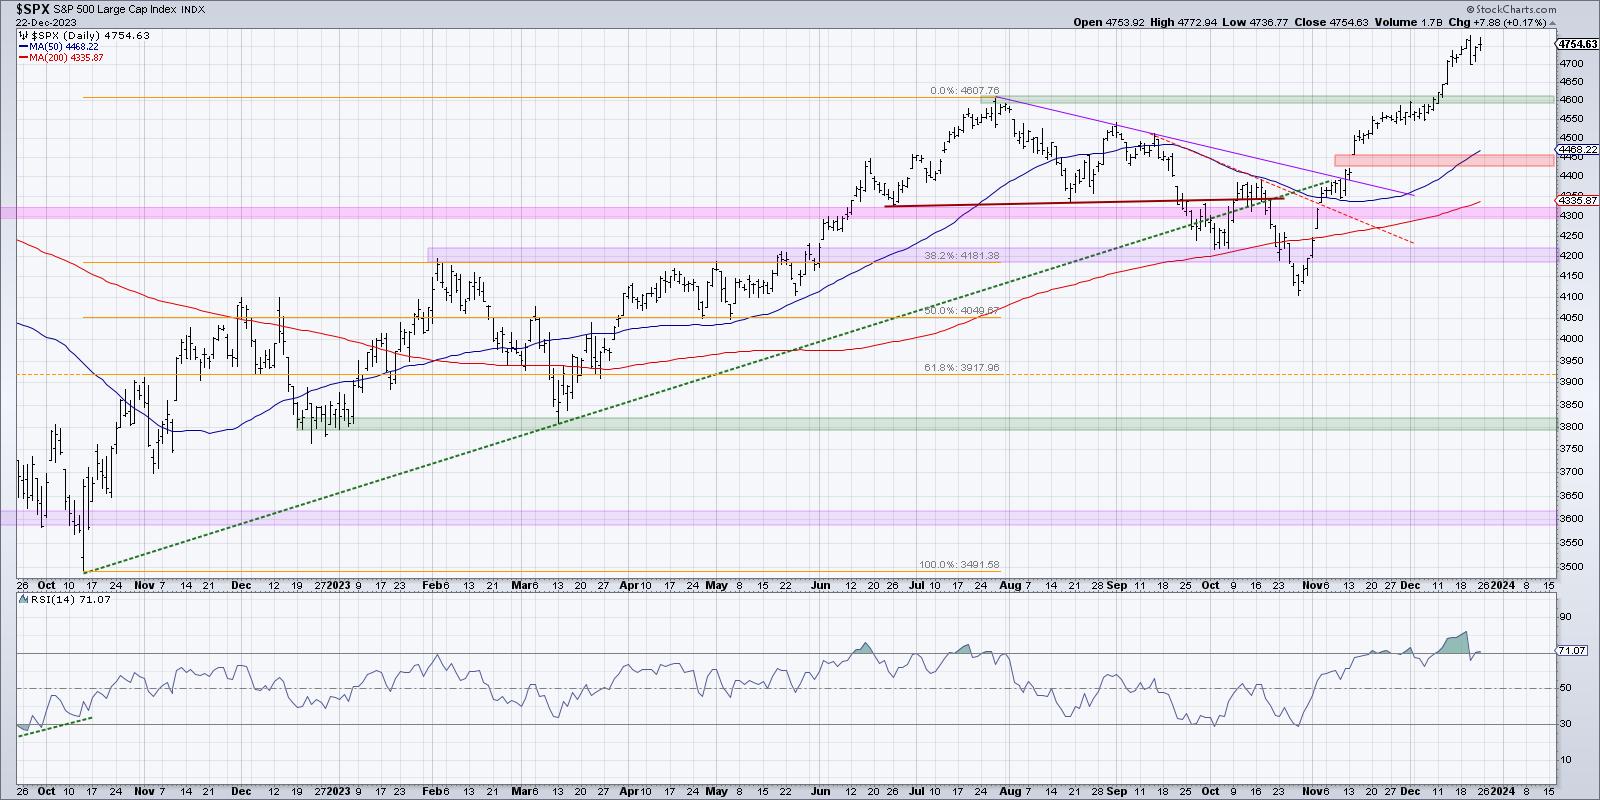
More from Mish's Outlook 2024 -- S&P 500
A passage from the Outlook:
SPY's all-time high was made in January 2022 at $479.98.
For now, the chart looks clear. If SPY pushes over 460, we can expect more upside at least until we get near the ATHs.
Should those levels clear, then we are in...
READ MORE
MEMBERS ONLY

Profit From the AI Wave Now: One Stock With Lots of Upside Potential
by Jayanthi Gopalakrishnan,
Director of Site Content, StockCharts.com
KEY TAKEAWAYS
* An earnings beat and strong guidance was enough to send shares of Micron Technology higher
* Micron Technology hit a new 52-week high and the stock has room for more upside
* Identify your entry and exit price targets to trade this stock
Yesterday's stock market selloff was...
READ MORE
MEMBERS ONLY

The Hoax of Modern Finance - Part 3: Fictions Told to Investors

by Greg Morris,
Veteran Technical Analyst, Investor, and Author
Note to the reader: This is the third in a series of articles I'm publishing here taken from my book, "Investing with the Trend," in article form here on my blog. Hopefully, you will find this content useful. Market myths are generally perpetuated by repetition, misleading...
READ MORE
MEMBERS ONLY

Mish's Outlook 2024 is Here -- Macro to Micro
Coming into 2023, we used the theme, "You can't hunt with the hounds and run with the rabbit." Those who stood back with the hounds, in search of a sure hit, were not only left behind, but missed the move higher as the rabbit got the...
READ MORE
MEMBERS ONLY
Top Five Charts of 2023 #3: Market Breadth Indicators
by David Keller,
President and Chief Strategist, Sierra Alpha Research
In the third of a five-part special series on StockCharts TV'sThe Final Bar, Dave breaks down three market breadth indicators that tell the story of market conditions in 2023. By analyzing the S&P 500 Bullish Percent Index, the percentage of stocks above their 50-day moving average,...
READ MORE
MEMBERS ONLY

Costco's Record-Breaking Surge: Is It Time to Buy or Sell?
by Karl Montevirgen,
The StockCharts Insider
KEY TAKEAWAYS
* Costco experienced a significant rally driven by strong earnings and an upgraded analyst target of $700
* Despite COST's bullish prospects, the stock is overbought and is likely to pull back
* Setting price alerts at several support levels may be key to finding a strong long entry...
READ MORE
MEMBERS ONLY

What Would It Take for Emerging Markets to Emerge?
by Martin Pring,
President, Pring Research
Over the years, emerging markets as a group have experienced huge swings in relative performance. The latest one, which began in 2010, has been quite bearish. When such linear trends dominate the scene, reliable cyclical indicators, such as the long-term KST or monthly MACD, often give premature buy signals and...
READ MORE
MEMBERS ONLY

Top Five Charts of 2023 #2: Ten-Year Treasury Yield
by David Keller,
President and Chief Strategist, Sierra Alpha Research
In the second of a five-part special series on StockCharts TV'sThe Final Bar, Dave takes a deep dive into the bond markets, talking rising rates, Fed rate hikes, value vs. growth, inverted yield curves, and what the bond markets in 2023 could tell us about potential future paths...
READ MORE
MEMBERS ONLY

DP Trading Room: Finally! Signs of Life in the Energy Sector
by Erin Swenlin,
Vice President, DecisionPoint.com
by Carl Swenlin,
President and Founder, DecisionPoint.com
In this week's edition of The DecisionPoint Trading Room, with Energy (XLE) finally showing signs of life, Carl and Erin dive into the sector to learn more about participation and new momentum. Carl discusses Total Returns on SPX, which are showing new all-time highs before the actual index....
READ MORE
MEMBERS ONLY

Stock(ing) Stuffers That Could Be Loving the High 2024
Just for the fun of it, and since we did not include it in our Outlook 2024, I decided to have a look at what experts are saying concerning mushrooms, cannabis, and hemp. After all, recreational and medical alternatives as investments, have been huge underperformers, and are a bit of...
READ MORE
MEMBERS ONLY

Extreme Breadth Readings Say Short-Term Bearish, Long-Term Bullish
by David Keller,
President and Chief Strategist, Sierra Alpha Research
By late October, the market conditions were dire indeed. The S&P 500 had broken below its 200-day moving average for the first time since March. Only 10% of S&P 500 members remained above their 50-day moving average, meaning a full 90% were below this key short-term...
READ MORE
MEMBERS ONLY

GNG TV: S&P 500 Breakout -- Will the Rally Continue to All-Time Highs by Year End?
by Alex Cole,
Co-founder, GoNoGo Charts®
by Tyler Wood,
Co-founder, GoNoGo Charts®
In this edition of the GoNoGo Charts show, as equities rally with speed from 4600 to 4700 this week, Alex and Tyler take a look across style boxes, cap scales, asset classes, and sectors, and review small-cap industrials that are part of the broadening leadership groups giving legs to this...
READ MORE
MEMBERS ONLY

The Hoax of Modern Finance - Part 2: Indicators, Terminology, and Noise
by Greg Morris,
Veteran Technical Analyst, Investor, and Author
Note to the reader: Over the next couple of weeks and months, I will be republishing the contents of my book, "Investing with the Trend," in article form here on my blog. I'm calling this series "The Hoax of Modern Finance" for reasons you...
READ MORE
MEMBERS ONLY

Energy Sector Finally Becoming Bullish?
by Carl Swenlin,
President and Founder, DecisionPoint.com
We publish this table daily to give an overview of the market, sector, and industry group indexes we follow. The Intermediate-Term Trend Model (ITTM) BUY Signals occur when the 20-day EMA crosses up through the 50-day EMA (Silver Cross). Long-Term Trend Model (LTTM) BUY Signals occur when the 50-day EMA...
READ MORE
MEMBERS ONLY
Larry's "Family Gathering" December 14, 2023 Recording
by Larry Williams,
Veteran Investor and Author
In this video, Larry presents his forecast for FANG stocks, including an analysis of the stock selloff for META. He then digs into the cycle of debt and why he's bothered about credit card writeoffs. After that, he examines the weekly economic index and GDP and how they...
READ MORE
MEMBERS ONLY
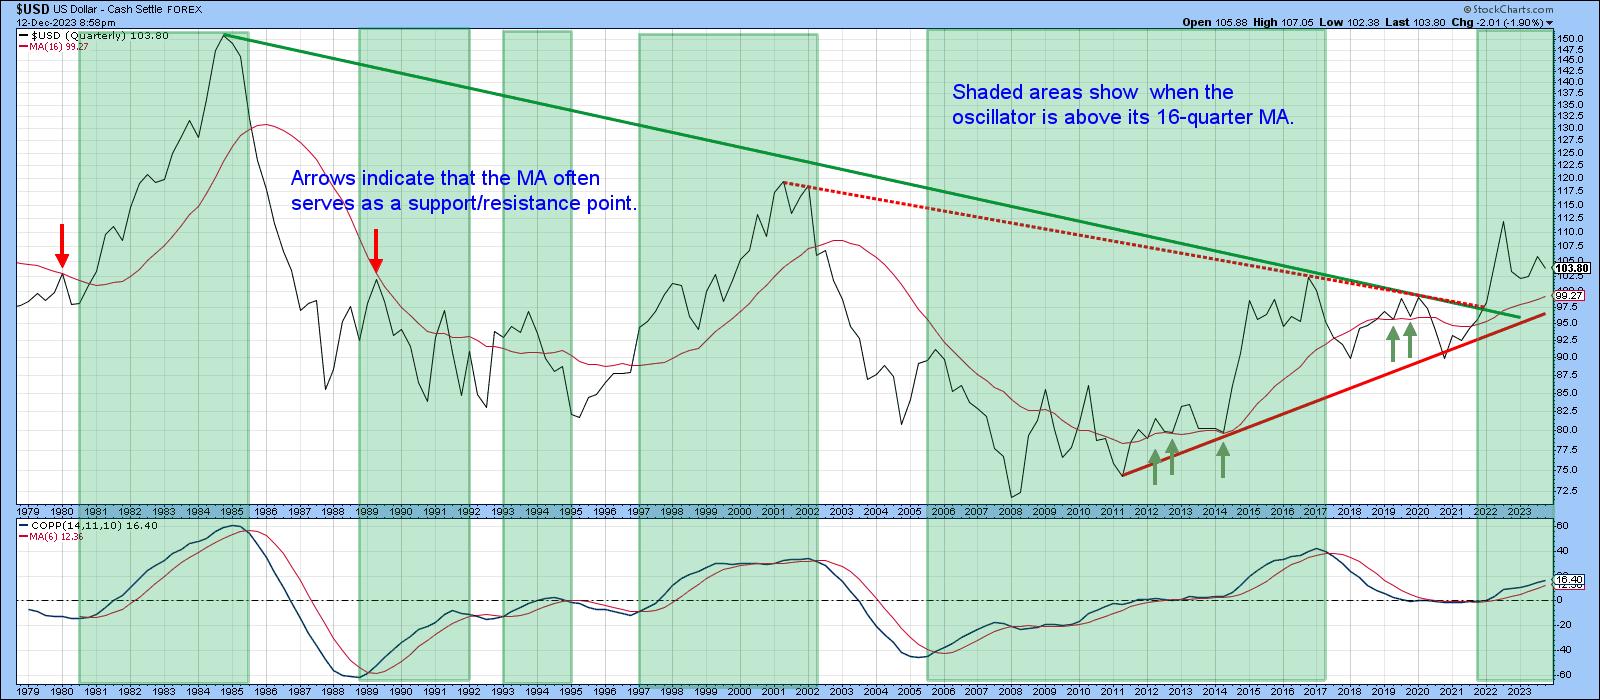
Maybe It's Time for a Santa Claus Rally... in the Dollar
by Martin Pring,
President, Pring Research
I like to start off my approach to any market by taking a look at the long-term trend. That's because a rising tide not only lifts all boats, but the direction of the long-term trend determines the characteristics of those below it. For example, if the primary trend...
READ MORE
MEMBERS ONLY

The Hoax of Modern Finance - Part 1: Introduction
by Greg Morris,
Veteran Technical Analyst, Investor, and Author
Note to the reader: Over the next couple of weeks and months, I will be republishing the contents of my book, "Investing with the Trend," in article form here on my blog. I'm calling this series "The Hoax of Modern Finance" for reasons you...
READ MORE
MEMBERS ONLY

Is Overbought Really Bearish?
by Arthur Hill,
Chief Technical Strategist, TrendInvestorPro.com
The S&P 500 SPDR (SPY) surged over 10% since late October and exceeded the upper Bollinger Band (125,1). This means price is more than 1 standard deviation above the 125-day SMA. Surely, this means SPY is overbought. But is this actually bearish? Historical evidence suggests that this...
READ MORE
