MEMBERS ONLY

Eli Lilly's Volatile Victory: What Tuesday's Turnaround Means for Your Portfolio

by Karl Montevirgen,
The StockCharts Insider
KEY TAKEAWAYS
* Eli Lilly & Co's beat on earnings and revenue expectations led to a swift 5% spike and reversal in its stock price
* Analyzing Eli Lilly's stock price chart reveal some headwinds that may not be apparent in fundamental data
* Eli Lilly's stock...
READ MORE
MEMBERS ONLY

Market Breadth Divergence Says NO BULL!

by David Keller,
President and Chief Strategist, Sierra Alpha Research
In this edition of StockCharts TV'sThe Final Bar, Dave demonstrates how the market's recent upswing has left mid-caps and small-caps in the dust, with deteriorating breadth conditions suggesting an increased risk of downside for the S&P 500. He also unveils the latest...
READ MORE
MEMBERS ONLY

Only a Fool Would Try to Call a Correction in a Bull Market, So Here Goes!

by Martin Pring,
President, Pring Research
The vast majority of the primary trend indicators are pointing to a bull market and have been doing so for the better part of a year. Chart 1, for instance, shows that NYSE Margin Debt, or rather its long-term KST, has only recently gone bullish. The vertical lines point...
READ MORE
MEMBERS ONLY
DecisionPoint Trading Room: Narrow Advance a Big Problem!

by Erin Swenlin,
Vice President, DecisionPoint.com
The market rally last week was very narrow, driven mainly by large gains in communication services stocks like Meta. Many technical indicators are showing negative divergences. The broader market struggled. Erin reviews all of the sectors under the hood and then takes your symbol requests.
Key Takeaways:
- Communication services and...
READ MORE
MEMBERS ONLY

Generals March On, but Fewer Troops are Following - Get the Essential Breadth Indicator ChartList

by Arthur Hill,
Chief Technical Strategist, TrendInvestorPro.com
Divergences reflect a disconnect between price and the indicator. A bearish divergence forms when price forges a higher high and the indicator fails to confirm this high. In the case presented below, we have the S&P 500 moving higher and fewer stocks making it back above their 50...
READ MORE
MEMBERS ONLY

Deciphering Gold's (GLD) Signals: Is Now the Time to Go Long on Gold?
by Karl Montevirgen,
The StockCharts Insider
KEY TAKEAWAYS
* The robust jobs data triggered a sell-off in the gold market, hampering expectations of an imminent rate cut
* Price projections for GLD in 2024 span a wide spectrum, below and above current prices because of fluctuating macroeconomic and geopolitical dynamics
* The Volume-by-Price indicator is especially...
READ MORE
MEMBERS ONLY

Top Ten Charts to Watch for February 2024
by David Keller,
President and Chief Strategist, Sierra Alpha Research
In this edition of StockCharts TV'sThe Final Bar, Grayson and Dave run through charts they feel present actionable opportunities based on their technical analysis setups. They'll cover breakout strategies, moving average techniques, relative strength, and much more. And you'll have ten new charts to...
READ MORE
MEMBERS ONLY

DR Horton Stock Plummets: Is Now the Time to Buy the Dip?
by Karl Montevirgen,
The StockCharts Insider
KEY TAKEAWAYS
* DHI's stock plummeted after missing Wall Street's earnings expectations and soft guidance
* Technical indicators provide a clearer view for those looking to buy the dip
* You can use StockCharts seasonality charts to provide a big-picture context to your trading setup
The tight supply...
READ MORE
MEMBERS ONLY

Mastering MACD: The Fly-By Pattern

by Joe Rabil,
President, Rabil Stock Research
On this week's edition of Stock Talk with Joe Rabil, Joe discusses key aspects to MACD when viewed as an oscillator rather than a momentum indicator. He also explains how to use MACD combination signals as well as combining with the ADX indicator. He then covers the symbol...
READ MORE
MEMBERS ONLY

Home Prices and Stocks | Focus on Stocks: February 2024

by Larry Williams,
Veteran Investor and Author
Let's begin this month with a look at ...
Home Prices and Stocks
Most people have the majority of their money in homes and/or stocks. Thus, I thought that this month, I would take a look at what should be happening in the real estate market.
Let'...
READ MORE
MEMBERS ONLY

S&P 500 Falls, Nears First Support Level -- How Much Lower Can It Go?

by Jayanthi Gopalakrishnan,
Director of Site Content, StockCharts.com
KEY TAKEAWAYS
* The Fed leaves interest rates unchanged as expected, but investors weren't happy
* S&P 500, Dow Jones Industrial Average, and Nasdaq Composite all close lower after Fed decision
* The 10-year Treasury yield falls to a three week low
Will the Fed cut interest rates...
READ MORE
MEMBERS ONLY

Gold is Making Waves within a Long-Term Uptrend
by Arthur Hill,
Chief Technical Strategist, TrendInvestorPro.com
Gold is not the most exciting asset at the moment, but it is in a long-term uptrend and perhaps the strongest commodity out there. There are also signs that the January decline is ending as RSI hits a momentum support zone and a bullish continuation pattern forms. Note that...
READ MORE
MEMBERS ONLY
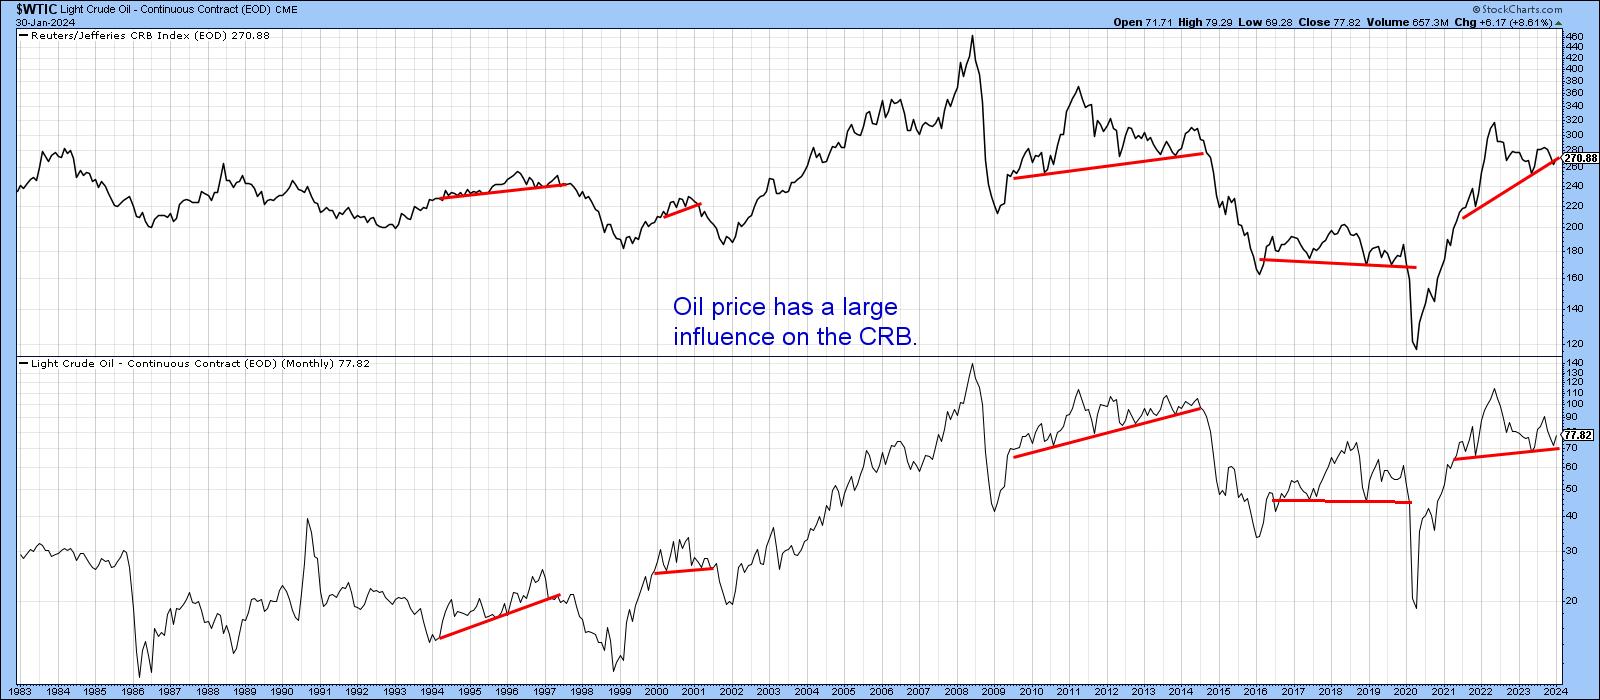
Is Oil Going Up or Down?
by Martin Pring,
President, Pring Research
Oil is not only an important commodity in and of itself, but is also one has a substantial influence on commodity indexes in general. Its weight in the CRB Composite is 23%; for energy in total, it is 39%. Chart 1 compares the oil price to the CRB Composite, where...
READ MORE
MEMBERS ONLY
Will Catalysts Push Markets HIGHER or Drag Them LOWER?
by David Keller,
President and Chief Strategist, Sierra Alpha Research
In this edition of StockCharts TV'sThe Final Bar, Dave tracks the S&P 500 as it pushes to a new high above 4900, while the McClellan Oscillator rotates to a bullish reading. He breaks down earnings plays this week, including XOM, MSFT, and more.
This video originally...
READ MORE
MEMBERS ONLY
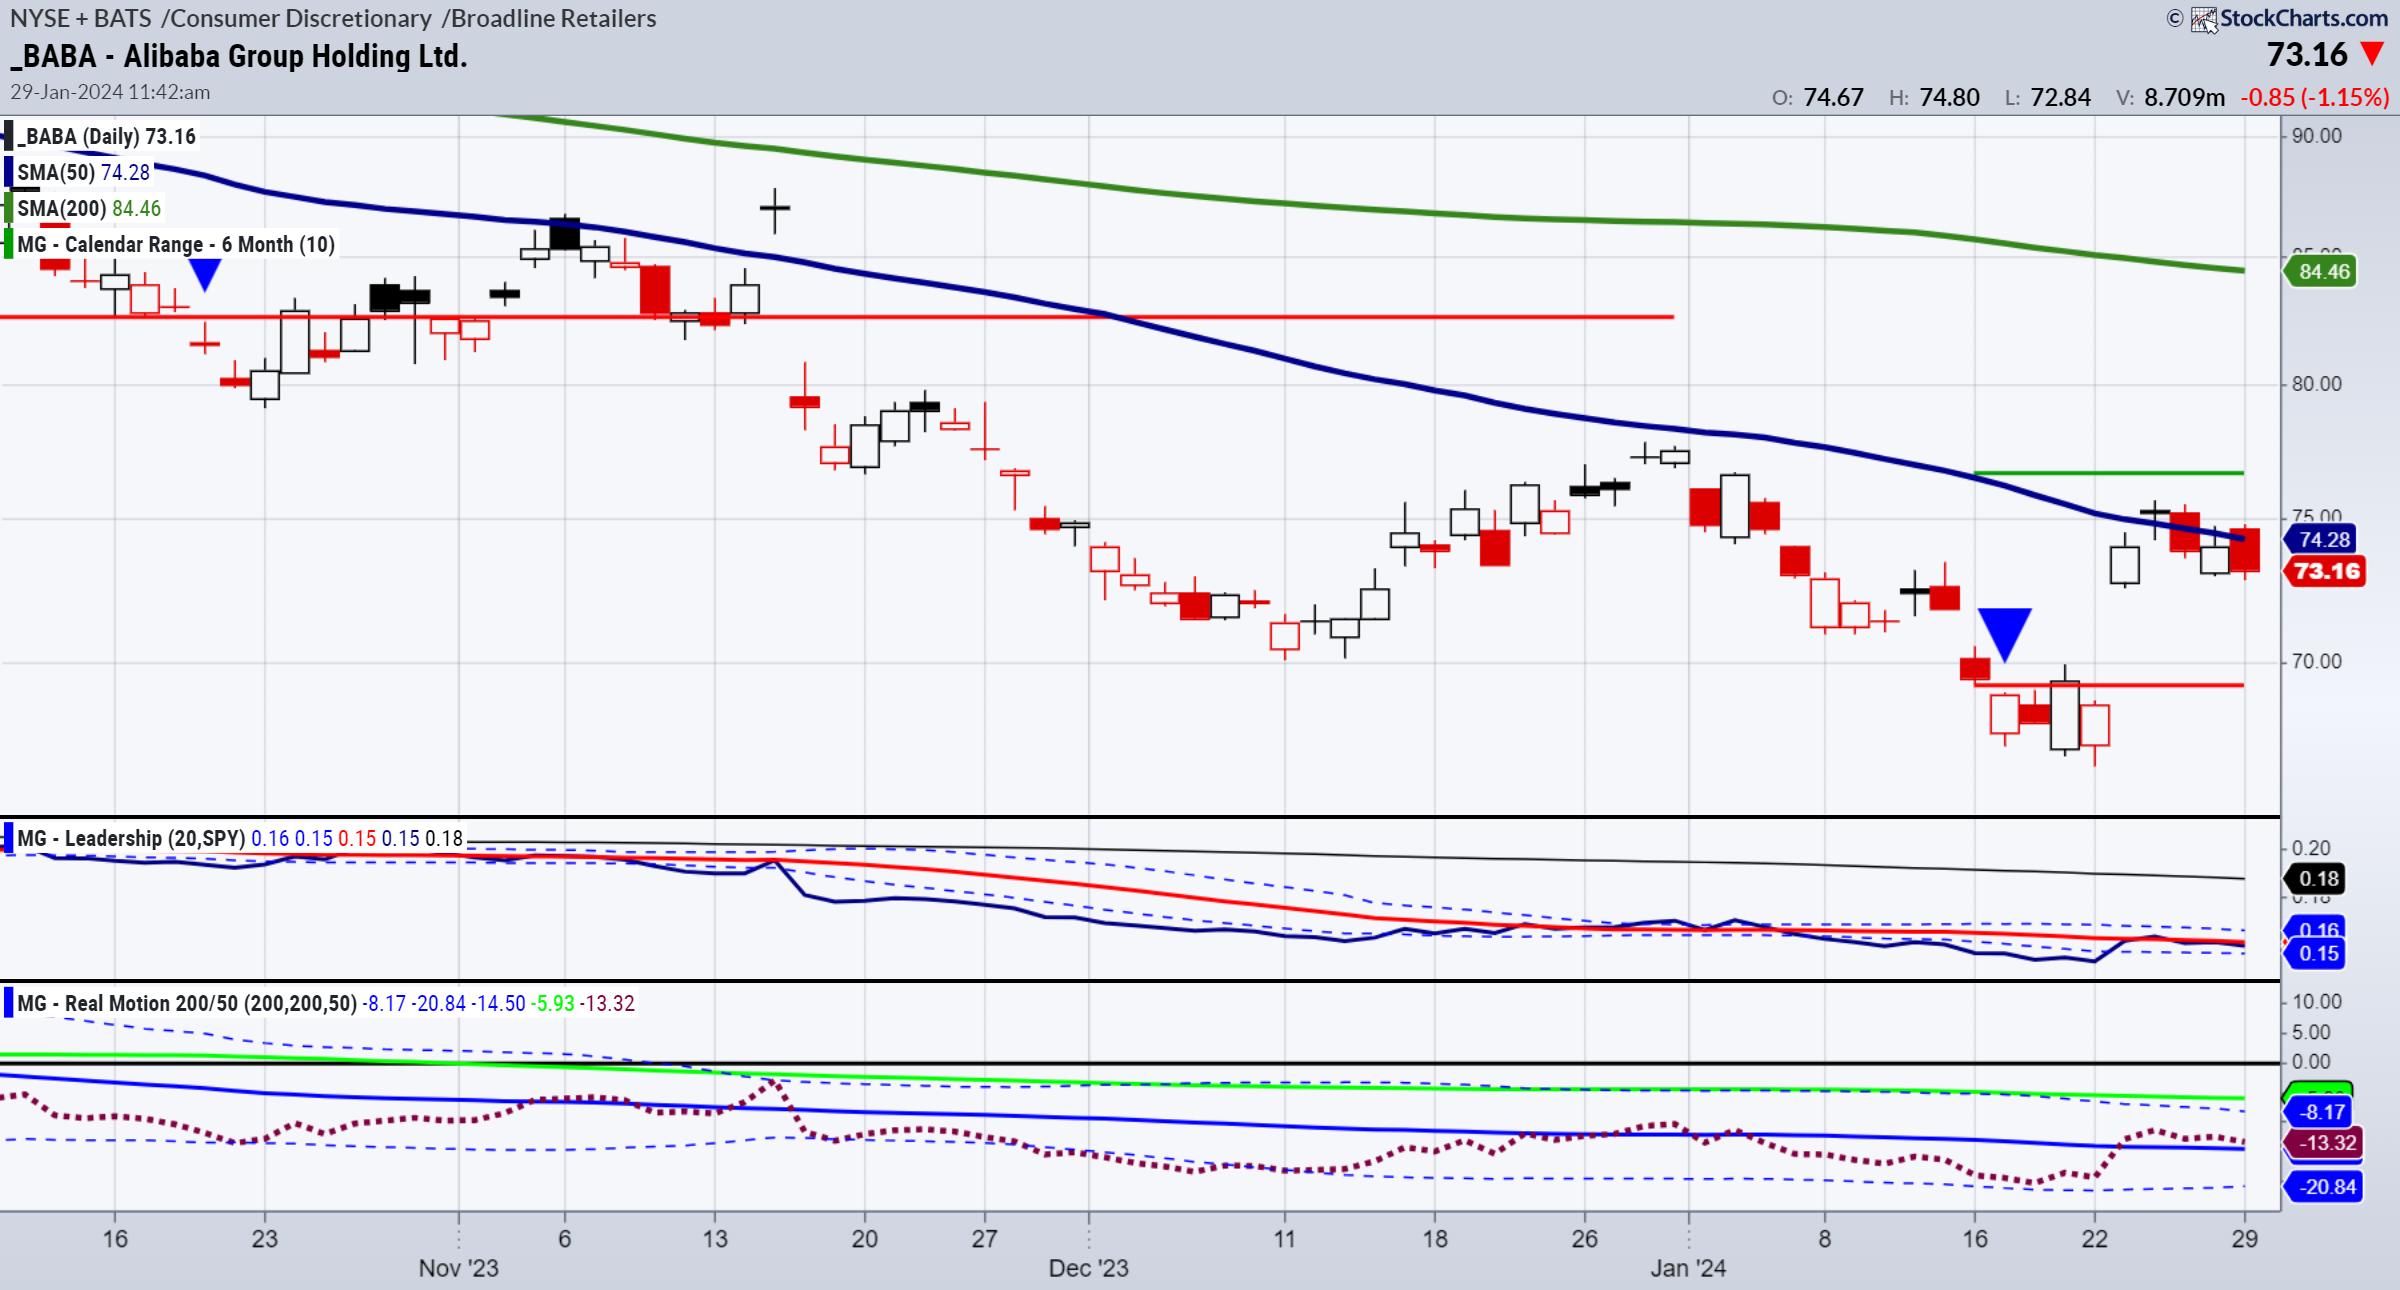
A Word and A Chart About and On Alibaba
Alibaba.com is one of the world's largest wholesale marketplaces.
To be honest, I had never gone to their website until today, even though we bought shares in BABA 2 weeks ago. So, in case you are like me and have not checked them out, they sell a...
READ MORE
MEMBERS ONLY
Earnings Preview: The Technical Temperature
by Erin Swenlin,
Vice President, DecisionPoint.com
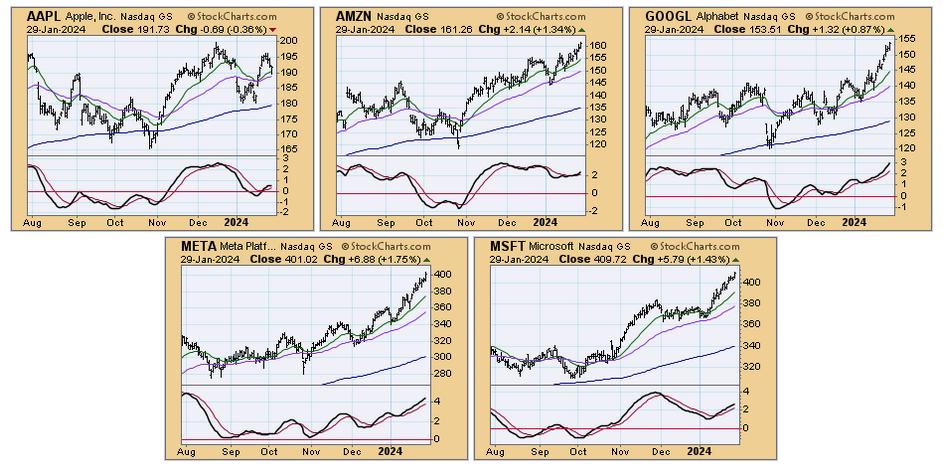
KEY TAKEAWAYS
* Big Week in Earnings
* Magnificent 7 - Five Reporting (MSFT, GOOGL, META, AAPL and AMZN
* Other stocks we look at: PFE, SBUX, AMD, MA, BA, MET, MRK, XOM and CVX
* Even more coverage with viewer symbol requests
This is a big week for earnings so Carl and Erin break...
READ MORE
MEMBERS ONLY

Stock Market Indexes Keep Setting New Highs: How Much Higher?
by Jayanthi Gopalakrishnan,
Director of Site Content, StockCharts.com
KEY TAKEAWAYS
* The S&P notched new record highs in five consecutive trading sessions but snapped the winning streak on Friday
* Investors still are complacent, as indicated by the CBOE Volatility index
* The benchmark 10-year Treasury yield remains within a 4% to 4.2% range
In the first...
READ MORE
MEMBERS ONLY
How to Avoid Huge Drawdowns from High-Flying Stocks
by David Keller,
President and Chief Strategist, Sierra Alpha Research
In this edition of StockCharts TV'sThe Final Bar, Dave hosts an all-mailbag episode, answering viewer questions on the Relative Strength Index (RSI), how ETFs like QTEC have outperformed benchmarks including the Nasdaq 100, and how to avoid painful losses in leading names like NVDA, PANW, and ADBE....
READ MORE
MEMBERS ONLY

IBM Stock Shatters Expectations, Hitting a New All-Time High: A Buying Opportunity?
by Karl Montevirgen,
The StockCharts Insider
KEY TAKEAWAYS
* IBM stock price hits a new 52-week high and moves above its upper Bollinger Band®
* IBM's share value could continue rising or pull back toward the middle Bollinger Band
* If IBM fills its post-earnings price gap it could present a more favorable entry point...
READ MORE
MEMBERS ONLY

Unlocking the Power of Technical Indicators
by David Keller,
President and Chief Strategist, Sierra Alpha Research
In this edition of StockCharts TV'sThe Final Bar, Dave breaks down the chart of Intel Corp (INTC) to demonstrate the benefits of three important technical indicators: Moving Averages, Relative Strength Index (RSI) and Relative Strength. He shares why a disciplined process of interpreting these indicators can help investors...
READ MORE
MEMBERS ONLY

SEC Greenlights Bitcoin ETFs: How This Major Move Could Skyrocket Coinbase Stock Price
by Karl Montevirgen,
The StockCharts Insider
KEY TAKEAWAYS
* Coinbase stock price is correlated with Bitcoin's price
* COIN's price level is getting close to an entry point for bullish investors
* An ideal entry point for COIN would be after you see a strong reversal candle with increasing momentum
Are you feeling a bit...
READ MORE
MEMBERS ONLY

PRICE IS KING in Stock Trading!
by Joe Rabil,
President, Rabil Stock Research
On this week's edition of Stock Talk with Joe Rabil, Joe shares his five steps to becoming a better stock picker. He emphasizes the importance of starting with price and using technical analysis to identify potential outperforming stocks. From analyzing monthly and weekly charts to looking at momentum...
READ MORE
MEMBERS ONLY

Macro Model Gives Mixed Signals as NFLX LIGHTS UP!
by David Keller,
President and Chief Strategist, Sierra Alpha Research
In this edition of StockCharts TV'sThe Final Bar, guest John Kosar, CMT of Asbury Research shares his proprietary Asbury Six macro model, which suggests caution based on weak fund flows and breadth conditions. Dave focuses in on crude oil and gold charts, and also reviews key earnings plays...
READ MORE
MEMBERS ONLY

What Does Dow Theory Say About This Market?
by Martin Pring,
President, Pring Research
Some tools in technical analysis are totally objective, such as a moving average crossover. It may be debatable whether it's a decisive signal or not, but a crossover is nevertheless a crossover. Dow Theory, on the other hand, is much more subjective and, therefore, open to interpretation. For...
READ MORE
MEMBERS ONLY

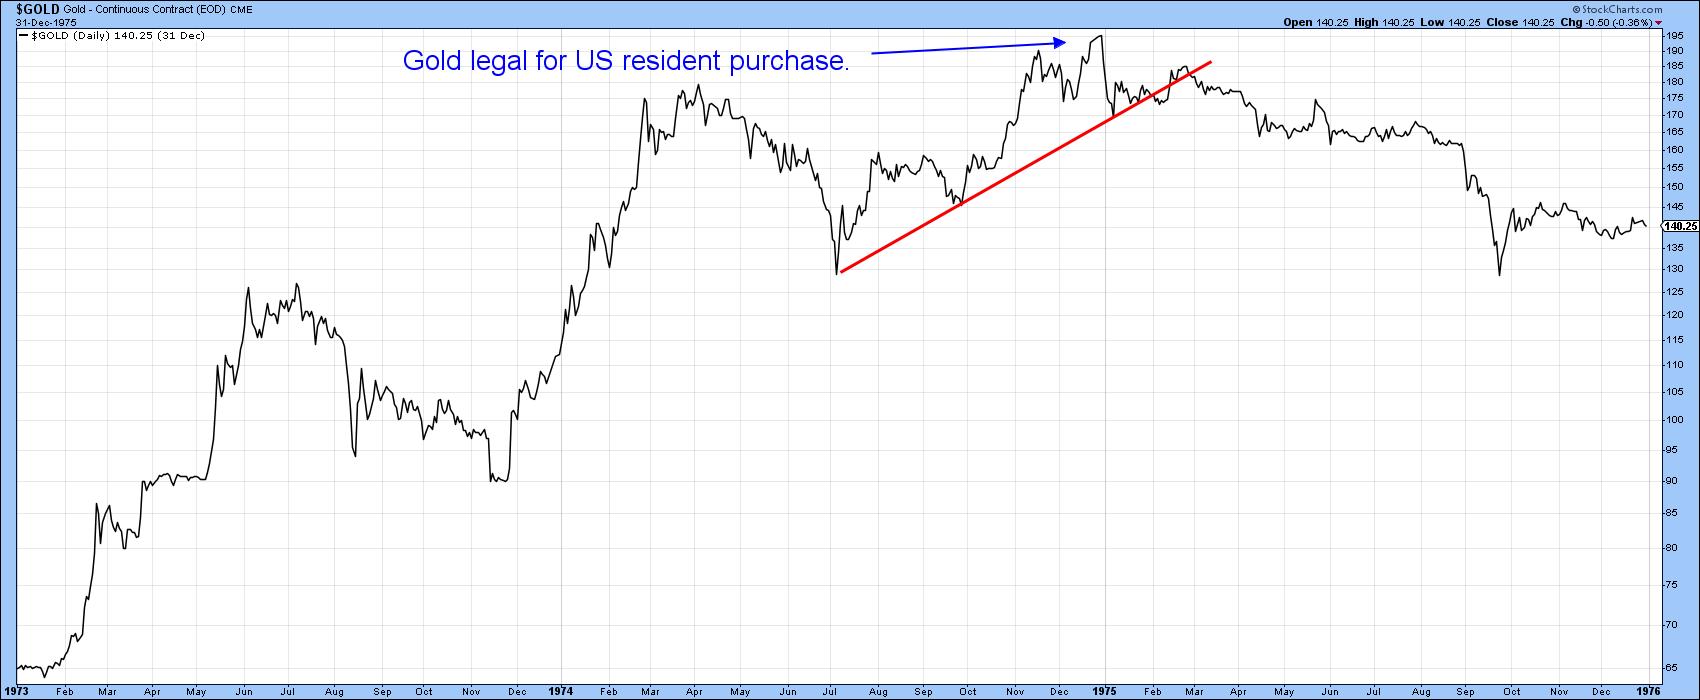
Remember Those 3 Signs of Inflation to Watch?
As a follow-up to a daily I wrote earlier in January called "Super Cycles Do Not Just Fade Away",yesterday'sJanuary 23rd dailywas all about one of the three indicators that can get us prepared for more inflation.
On January 5th, sugar was still trading under...
READ MORE
MEMBERS ONLY

AMD Stock Hits New 52-Week High: A Buying Opportunity?
by Jayanthi Gopalakrishnan,
Director of Site Content, StockCharts.com
KEY TAKEAWAYS
* AMD stock price hits a new 52-week high and moves above its upper Bollinger Band®
* AMD's share value could continue rising or pull back and go below the middle Bollinger Band
* Watch volume, relative strength index, and money flow index to identify a slowing down...
READ MORE
MEMBERS ONLY

Small Caps Surge Higher As S&P 500 Stalls
by David Keller,
President and Chief Strategist, Sierra Alpha Research
In this edition of StockCharts TV'sThe Final Bar, Dave observes the S&P 500 index pressing higher after achieving new all-time highs on Friday. While large caps have dominated small caps so far in January, days like today suggest small-cap strength as a potential emerging...
READ MORE
MEMBERS ONLY

A Biotech Stock with a Breakout on the Weekly and a Classic Retracement on the Daily
by Arthur Hill,
Chief Technical Strategist, TrendInvestorPro.com
This week's analysis will stick with the multiple timeframe approach. Today we are featuring a biotech stock with a channel breakout on the weekly chart and a classic retracement on the daily chart. Moreover, a larger bullish reversal pattern could be forming on the daily chart.
The weekly...
READ MORE
MEMBERS ONLY
Economic Modern Family's Engine Idles While Growth Goes Fast and Furious
Let's get right to it. The charts and our tools are telling.
To start, I always look at moving averages and phases. Then I look at Real Motion and momentum to see if there is a divergence to price. After that, I check out our Leadership indicator which...
READ MORE
MEMBERS ONLY

Viewer Questions: How Does the Fed Manipulate the Yield Curve?
by David Keller,
President and Chief Strategist, Sierra Alpha Research
In this edition of StockCharts TV'sThe Final Bar, Dave hosts a special all-mailbag edition, answering viewer questions on leading vs. lagging indicators, arithmetic vs. log scale charts, and how the Fed manipulates the yield curve. He digs into specific trading strategies using RSI, MACD, On Balance Volume,...
READ MORE
MEMBERS ONLY

Technology Stocks Rise, but Market Internals Look Vulnerable
by Jayanthi Gopalakrishnan,
Director of Site Content, StockCharts.com
KEY TAKEAWAYS
* Nasdaq Composite index rises 1.35% thanks to semiconductor stocks and an upgrade for Apple
* The Nasdaq Composite is trading close to its 52-week high, but market breadth isn't sharing the bullish sentiment
* Market breadth indicators, such as the advance-decline issues and percent above...
READ MORE
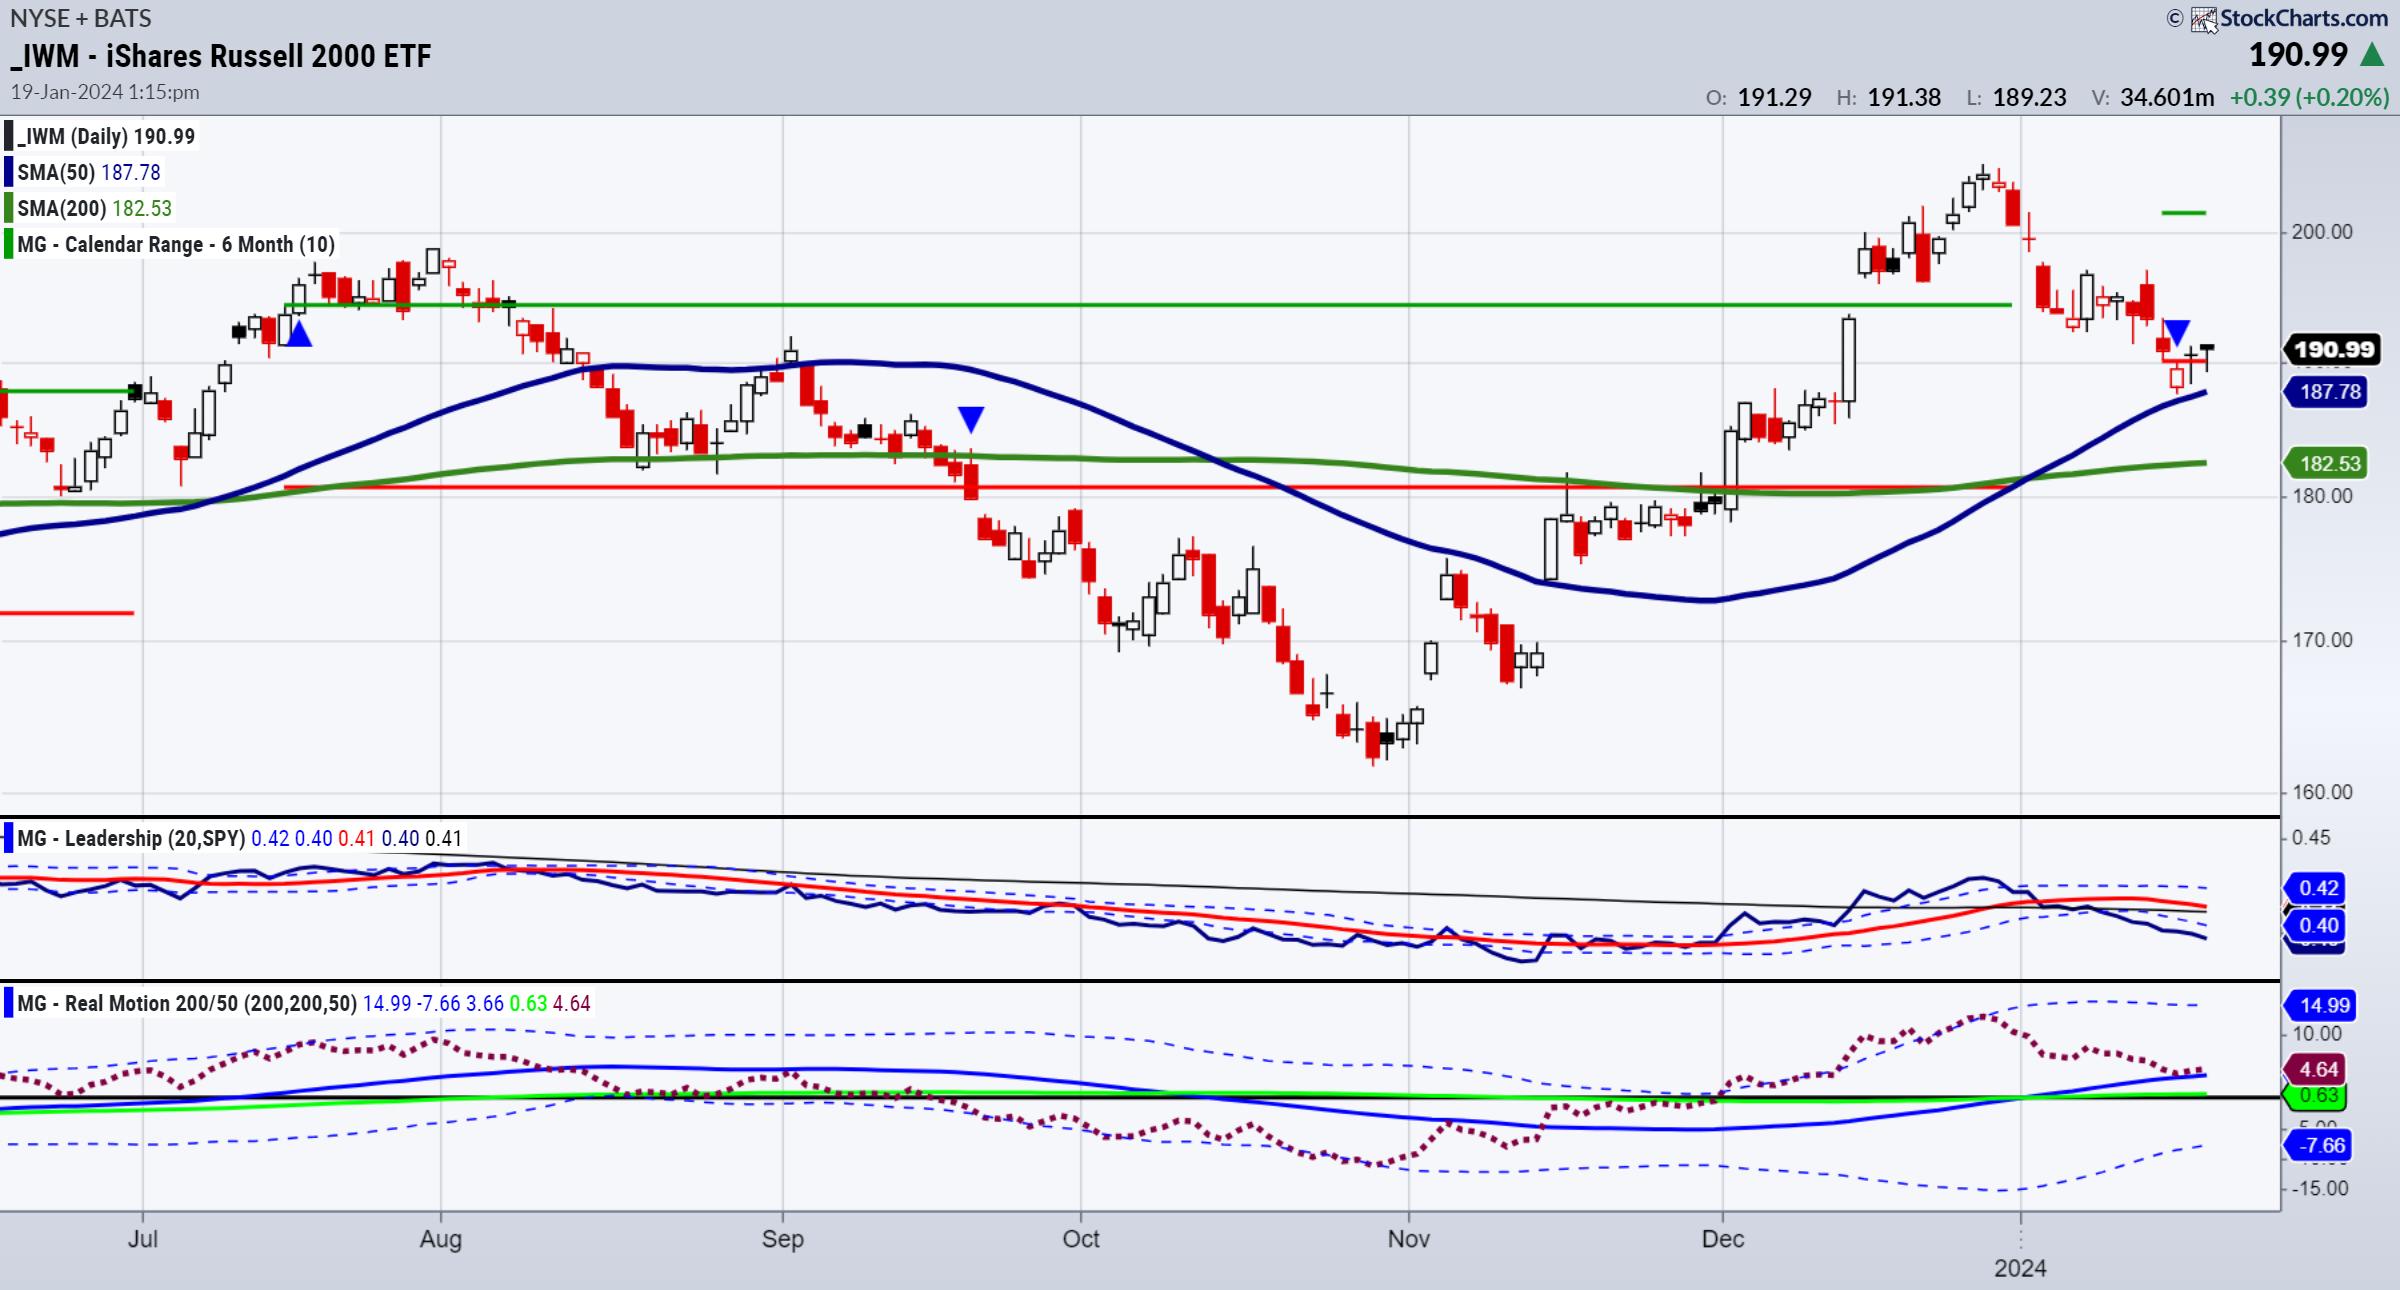
MEMBERS ONLY

Why SMALL CAPS MATTER in January 2024
by David Keller,
President and Chief Strategist, Sierra Alpha Research
In this edition of StockCharts TV'sThe Final Bar, guest John Kolovos, CFA CMT of Macro Risk Advisors describes how the market is reacting to "good overbought" conditions in late 2023, and why the Russell 2000 small cap ETF may be the chart to watch in Q1...
READ MORE
MEMBERS ONLY

Utilities' Unique Seasonal Powers: The Best Months to Invest
by Karl Montevirgen,
The StockCharts Insider
KEY TAKEAWAYS
* The Utilities sector has periods of cyclical outperformance
* Seasonality charts in StockCharts can identify which months Utilities are likely to outperform
* Analyzing a price chart of the XLU ETF can help time your entries so they coincide with seasonal patterns
The Utilities sector is known as a defensive...
READ MORE
MEMBERS ONLY

Has Rate Cut Anticipation Run Its Course?

by Carl Swenlin,
President and Founder, DecisionPoint.com
The Fed stopped raising rates in July, and, by mid-October, yields had peaked. Since then, yields have begun to decline in anticipation of the Fed beginning rate cuts this year. At this point, it appears that yields have found support and may possibly bounce, or begin moving sideways. This...
READ MORE
MEMBERS ONLY

The Case for a Tactical Stock Selloff
by David Keller,
President and Chief Strategist, Sierra Alpha Research
In this edition of StockCharts TV'sThe Final Bar, guest Adam Turnquist of LPL Financial lays out the case for a tactical selloff for stocks, as well as why long-term indicators remain constructive in early 2024. Dave breaks down the bearish momentum divergence prevalent in the technology sector,...
READ MORE
MEMBERS ONLY
Buying Bitcoin ETFs is the Easy Part, But What Comes Next?
by Martin Pring,
President, Pring Research
Last week, eight new Bitcoin-based ETFs began trading courtesy of recent SEC approval. This launch was well anticipated, as the price had already run up in the hope that these new buyers would push it to an even higher level. The thought occurred to me that the situation is...
READ MORE
MEMBERS ONLY

View The Large Cap - Small Cap Debate in a Direct Comparison on RRG

by Julius de Kempenaer,
Senior Technical Analyst, StockCharts.com
KEY TAKEAWAYS
* Using RRG to see Large-Cap vs Small-Cap sector rotation
* The current strength for Small-Cap stocks vs Large-Caps is evident
At the end of last year, I wrote a blog article about the relationship between Large-Cap and Equal-Weight sectors. It involved plotting the...
READ MORE
MEMBERS ONLY

The Secret Sauce! Expert Investors Use This to Anticipate Market Moves

by Grayson Roze,
Chief Strategist, StockCharts.com
On this week's edition of StockCharts TV'sStockCharts in Focus, Grayson shows you how to dig deeper into the markets like a true veteran chartist and put price history to work for you using Seasonality Charts. These simple, yet powerful historical charts let you see past price...
READ MORE
MEMBERS ONLY

S&P 4300 by End of February?
by David Keller,
President and Chief Strategist, Sierra Alpha Research
We kicked off the new year of 2024 with an overheated stock market, excessively bullish breadth indicators, and euphoric sentiment levels. While the first week in January felt like a "wake-up call" pullback for awestruck bulls, this last week saw the S&P 500 push right...
READ MORE
MEMBERS ONLY
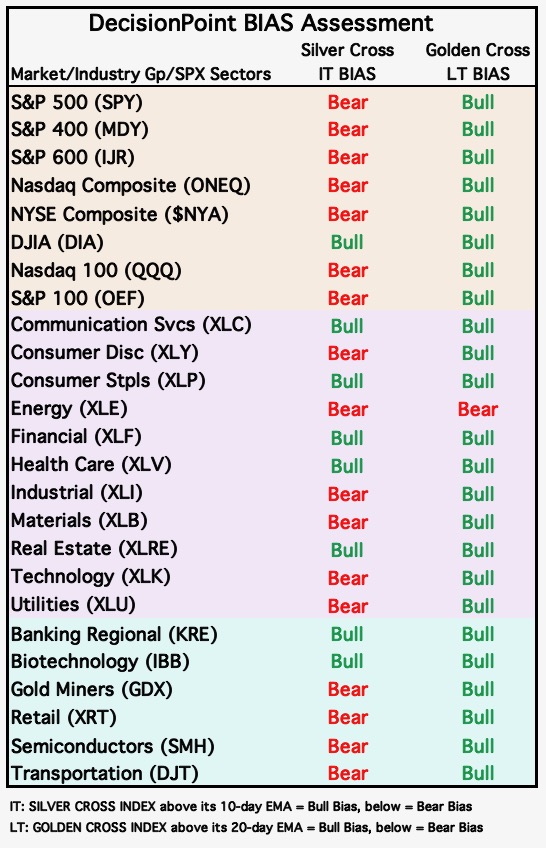
Dramatic Bearish Bias Shift on Major Market Indexes This Week
by Carl Swenlin,
President and Founder, DecisionPoint.com
by Erin Swenlin,
Vice President, DecisionPoint.com
(This is an excerpt from the subscriber-only DecisionPoint Alert on DecisionPoint.com)
This week, the markets experienced a dramatic bias shift. We measure the Intermediate-Term Bias using our Silver Cross Index (SCI). The SCI measures how many stocks within an index, sector, or industry group hold "silver...
READ MORE