MEMBERS ONLY
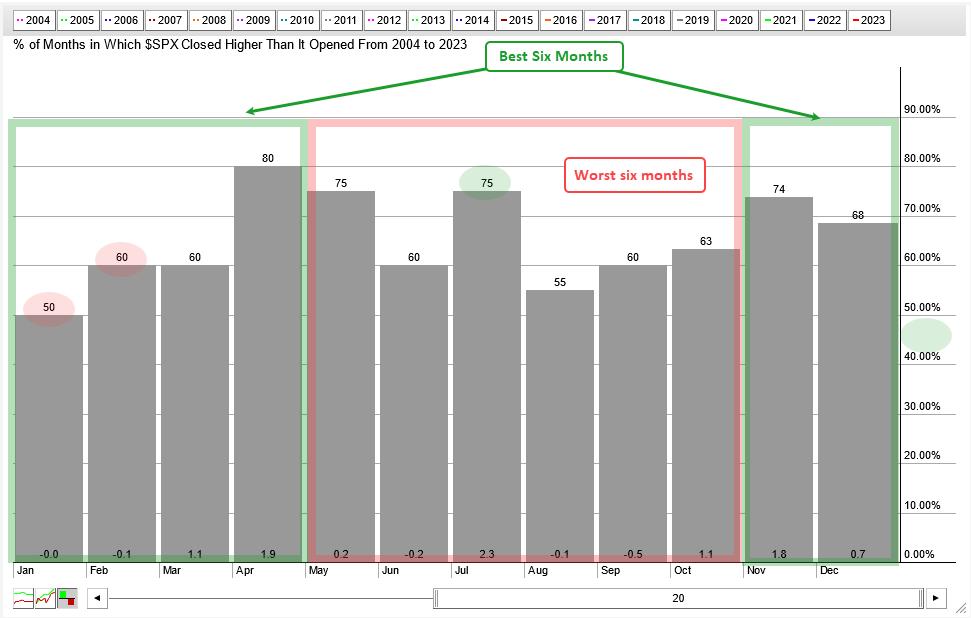
Seasonality versus Simply Market Timing

by Arthur Hill,
Chief Technical Strategist, TrendInvestorPro.com
There is some validity to the best six months strategy, but investors would probably be better off with a simple timing tool. According to the Stock Trader's Almanac, the best six-month period runs from November to April. The worst six-month period runs from May to October....
READ MORE
MEMBERS ONLY
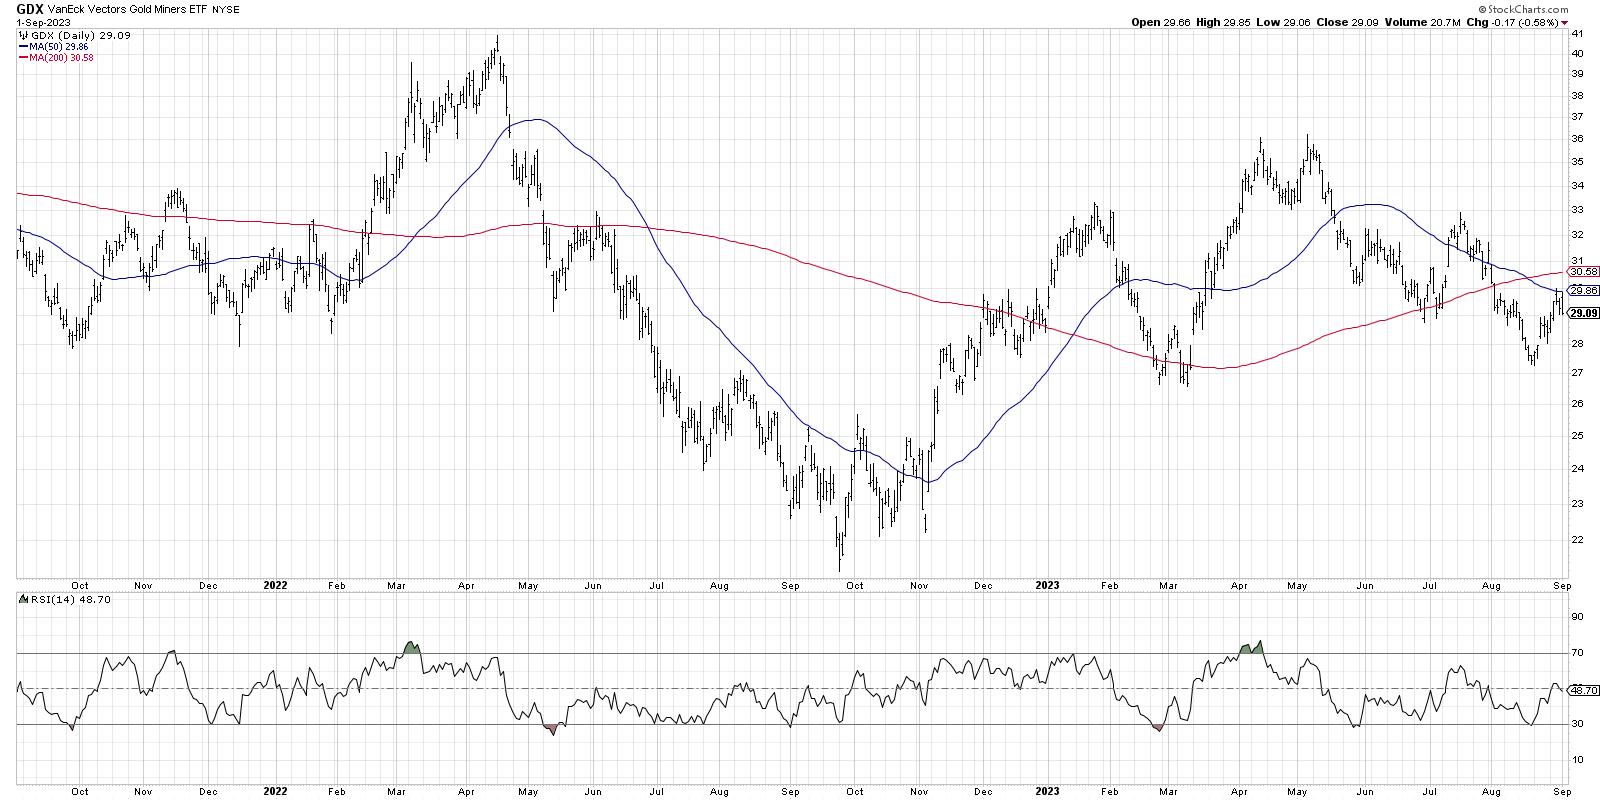
Three Ways I Use RSI To Analyze Trends

by David Keller,
President and Chief Strategist, Sierra Alpha Research
KEY TAKEAWAYS
* Momentum indicators like RSI can indicate overbought and oversold conditions, suggesting a short-term reversal.
* A bearish divergence, with higher prices and a lower RSI, often occur at the end of a bullish phase.
* By analyzing the range of the RSI, investors can confirm the overall trend phase...
READ MORE
MEMBERS ONLY

Typical Tesla STALLS Out at 50-Day Moving Average
by David Keller,
President and Chief Strategist, Sierra Alpha Research
In this edition of StockCharts TV'sThe Final Bar, Dave wraps the market week with a discussion of higher interest rates, their implication for growth stocks, and why charts like TSLA shouldn't get an "all clear" until they break above the 50-day moving average....
READ MORE
MEMBERS ONLY

Bottom-Up Stock Picking Made Easy with This Automated Scanning Set-Up

by Grayson Roze,
Chief Strategist, StockCharts.com
On this week's edition of StockCharts TV'sStockCharts in Focus, Grayson walks you through a "bottom-up" stock-picking approach that he uses daily on StockCharts, which helps him find the strongest stocks and best technical setups out there in the market. Learn how to...
READ MORE
MEMBERS ONLY

Trading Against the Crowd with the Williams Sentiment Index

by Karl Montevirgen,
The StockCharts Insider
KEY TAKEAWAYS
* Contrarian investing wisdom suggests that opposing the general market sentiment can lead to viable market opportunities
* The Williams Sentiment Index measures the prevailing opinions and sentiment of financial advisors and offers insights into potential market turns
* The Williams Sentiment Index indicates when investor sentiment is exceedingly bullish or...
READ MORE
MEMBERS ONLY

How to Spot the Early Signs of a Reversal Using ADX and DI Lines

by Joe Rabil,
President, Rabil Stock Research
On this week's edition of Stock Talk with Joe Rabil, Joe explains the importance of the DI lines when looking at the ADX indicator. He discusses how we can determine who is in control and when to be on the lookout for a reversal. Joe then analyses the...
READ MORE
MEMBERS ONLY

Find Reliable Entry Points With the Williams Insider Accumulation Index

by Jayanthi Gopalakrishnan,
Director of Site Content, StockCharts.com
KEY TAKEAWAYS
* Get a macro view of the market by analyzing the broader indexes
* Identify stocks which show a divergence between price and the Williams Insider Accumulation Index
* If accumulation is increasing and the stock price starts moving higher, it could be an ideal entry point
Whether you're...
READ MORE
MEMBERS ONLY

Trading With the Williams Money Flow Index
by Karl Montevirgen,
The StockCharts Insider
KEY TAKEAWAYS
* Large pools of "informed money" have a significant impact on price movements in the market
* The Williams Money Flow Index is designed to reveal "institutional" buying and selling activity that may sway the longer-term price direction
* The Williams Money Flow Index can be...
READ MORE