MEMBERS ONLY

Two Bullish Inter-Asset Relationships that Could Signal the Next Bear Market

by Martin Pring,
President, Pring Research
Martin Pring analyzes the behavior of two inter-asset relationships, namely Stocks vs. Commodities and Stocks vs. Bonds. Read about his insights and know how to uncover the clues going forward....
READ MORE
MEMBERS ONLY
This RSI Setup Could Be Your First Entry After the Breakout

by Joe Rabil,
President, Rabil Stock Research
Joe Rabil shows how a specific RSI setup can help traders identify the first pullback entry after a breakout. He also reviews S&P 500 volatility, sentiment, QQQ, IWM, and several stock setups....
READ MORE
MEMBERS ONLY

Is Distribution Hitting the S&P 500? What Traders Should Watch Now
As large-cap stocks dip to multi-month lows, some shifts are taking place that investors shouldn't ignore. Two indicators to watch are SPY distribution risk and the U.S. dollar's consolidation. Watch these charts closely....
READ MORE
MEMBERS ONLY
Top 10 Charts to Watch | March 2026 Breakouts & Inflection Points

by David Keller,
President and Chief Strategist, Sierra Alpha Research
With corporate earnings now behind us, investors can shift their focus to the trends taking shape in Q1.
In this video, David Keller, CMT, shares the top 10 charts he's watching for March 2026, and more importantly, why they matter right now. Dave organizes his charts into three...
READ MORE
MEMBERS ONLY
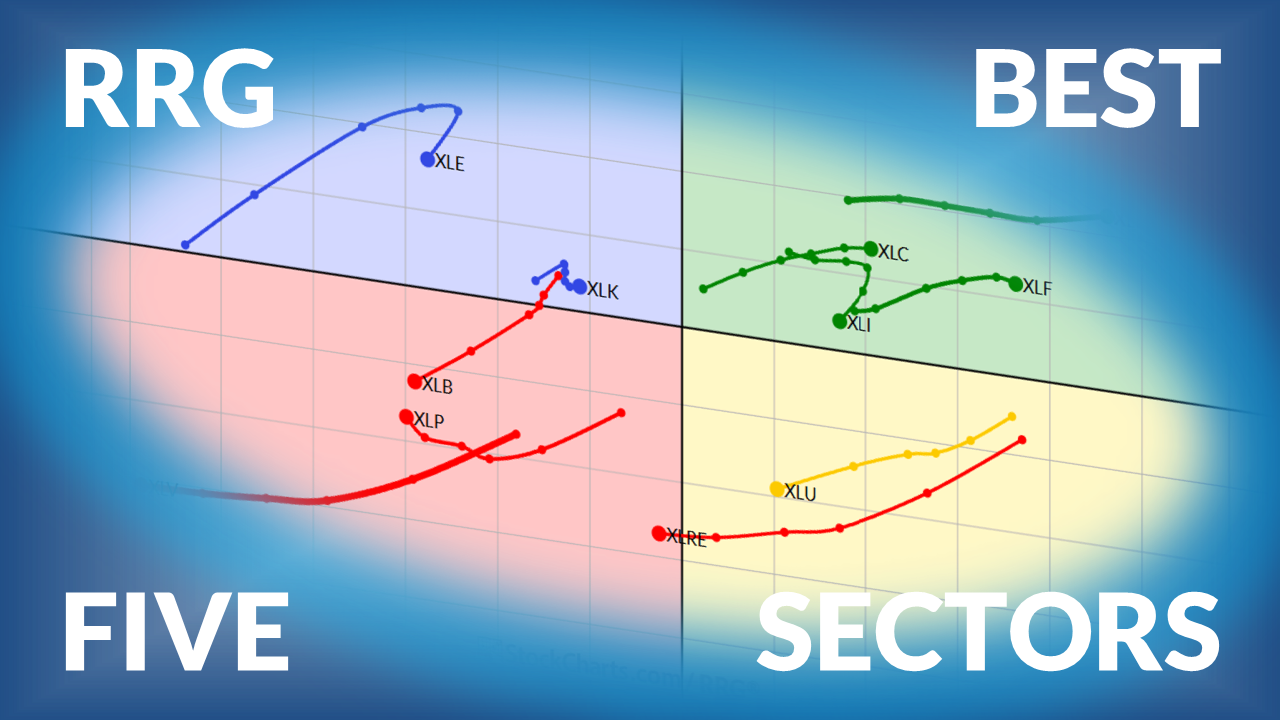
The Best Five Sectors This Week #55

by Julius de Kempenaer,
Senior Technical Analyst, StockCharts.com
Weekly update on sector rotation for US sectors using Relative Rotation Graphs®....
READ MORE
MEMBERS ONLY

Oil Soars After Iran Strikes: Are More Gains to Come in Energy?
Geopolitical tensions resulted in a surge in oil prices. Here's a technical look at the charts and potential target prices....
READ MORE
MEMBERS ONLY

Week Ahead: NIFTY Drags Its Resistance Lower, Need To Move Past These Levels To Rise Again

by Milan Vaishnav,
Founder and Technical Analyst, EquityResearch.asia and ChartWizard.ae
With Nifty hovering about its 50-week moving average but trading below the 20-week, price action suggests a loss of upside momentum. What could it take to open the door for an up move?...
READ MORE
MEMBERS ONLY

The Stock Market’s Tone Is Changing: Are You Prepared?

by Jayanthi Gopalakrishnan,
Director of Site Content, StockCharts.com
The stock market is consolidating, not collapsing. Here's what sector rotation, moving averages, and the VIX reveal about what may come next....
READ MORE
MEMBERS ONLY

Mag 7 Leaders and Laggards; 3 Trend Reversals; Analysis and Key Levels for Apple

by Arthur Hill,
Chief Technical Strategist, TrendInvestorPro.com
The Mag 7 stocks have lost steam since November. However, four of the seven are showing long-term uptrends. Arthur Hill analyzes each of these charts and identifies potential reversal or continuation levels....
READ MORE
MEMBERS ONLY
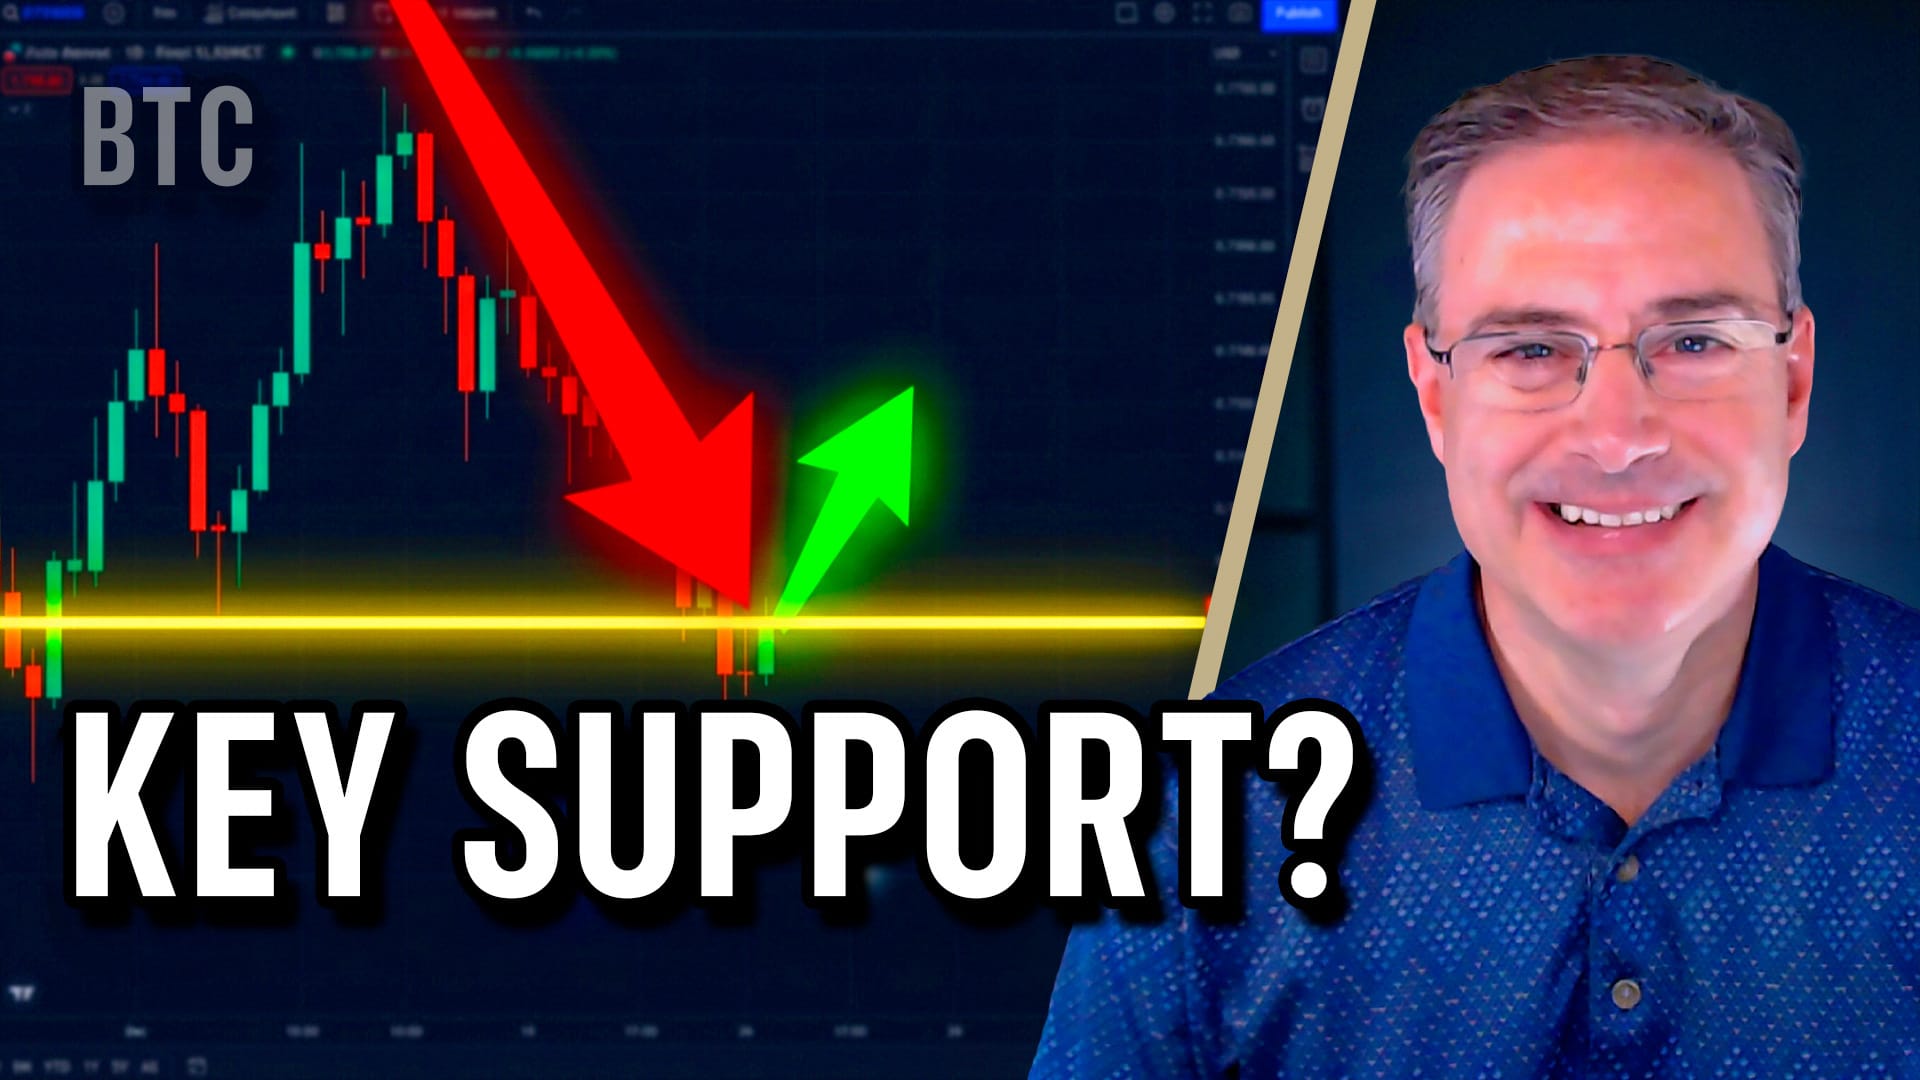
Bitcoin at Key Support — Is an Interim Low Forming?
by Joe Rabil,
President, Rabil Stock Research
Joe Rabil explains why Bitcoin is sitting at key support near a major retracement level and what would confirm an interim low. He also reviews SPY volatility, sentiment, ADX conditions, and several stock setups....
READ MORE
MEMBERS ONLY

March Volatility Ahead? Watching Yields, the Dollar, and the S&P 500
The 10-Year Treasury yield is close to a key support level, the S&P 500 is showing signs of weakening momentum, and the US dollar could see some upside movement. Add these charts to your StockCharts ChartLists as we enter a volatile period....
READ MORE
MEMBERS ONLY

2026 Starts With a Big Rotational Change
by Martin Pring,
President, Pring Research
There has been a shift in market leadership, suggesting that we may be in the later stages of a business cycle. Martin Pring's analysis of these rotations uncovers the scenarios we can expect during this stage....
READ MORE
MEMBERS ONLY
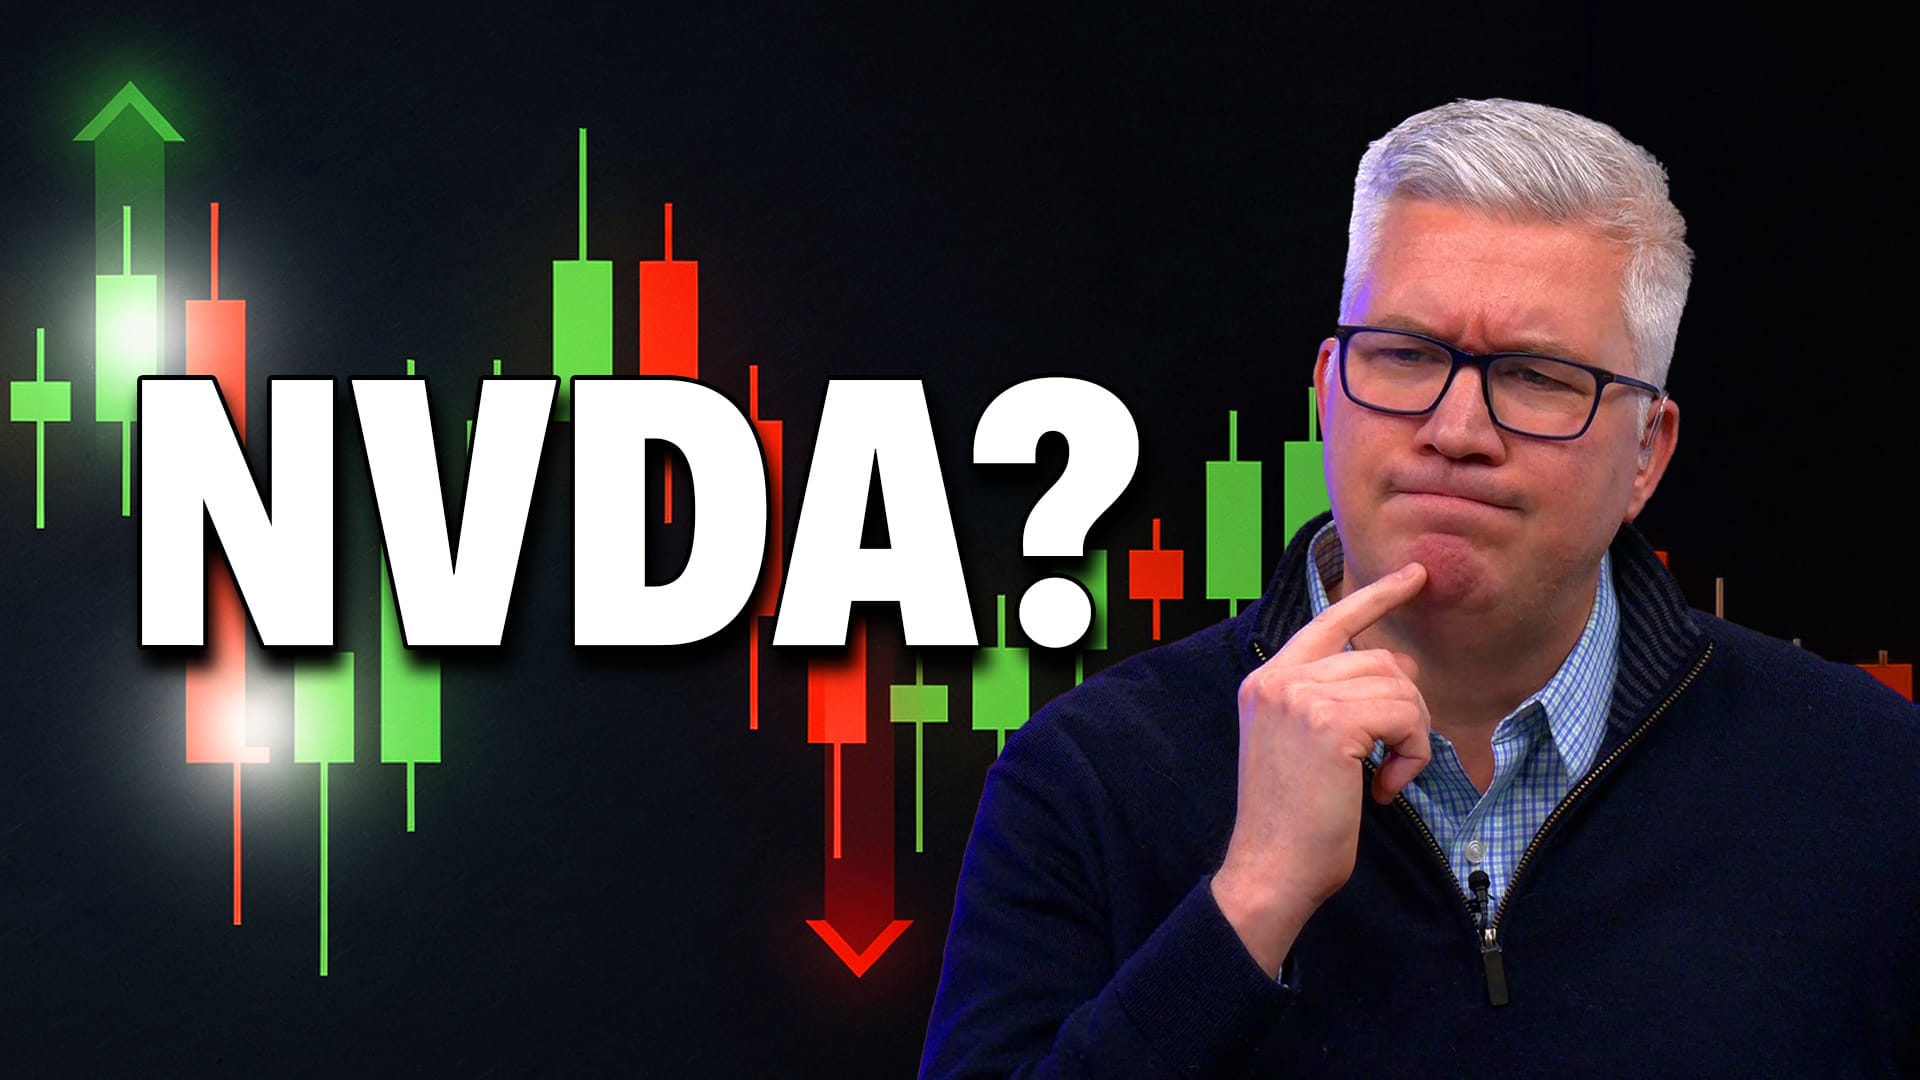
NVDA Earnings Preview: 5 Charts That Could Define the Next Major Move
by David Keller,
President and Chief Strategist, Sierra Alpha Research
With NVIDIA earnings having the potential to trigger a major move, Dave Keller takes a close look at it’s chart across multiple timeframes. From long-term PPO signals to key support and resistance, he explains the critical features that could confirm a breakout or breakdown....
READ MORE
MEMBERS ONLY

JPMorgan Crumbles as AI Disruption Hit Wall Street's Fortress

by Tony Zhang,
Chief Strategist, OptionsPlay
JPM's stock price is showing technical weakness. Here's a bearish options strategy setup with a compelling risk/reward structure. Explore how you can take advantage of it....
READ MORE
MEMBERS ONLY

The Best Five Sectors This Week #54
by Julius de Kempenaer,
Senior Technical Analyst, StockCharts.com
Julius presents his weekly update on Sector Rotation for US sectors using Relative Rotation Graphs....
READ MORE
MEMBERS ONLY

Tariff Relief Rally? Why Retail Charts Tell a Mixed Story
Retail stocks rose after the recent tariff ruling, but the charts give a mixed story. Here's a look at four retail stocks with support, resistance, and congestion zones....
READ MORE
MEMBERS ONLY

Rangebound Market: How to Trade the S&P 500’s Next Move
by David Keller,
President and Chief Strategist, Sierra Alpha Research
The S&P 500 remains locked in a multi-month consolidation as leadership rotates from growth into value. Dave Keller, CMT, updates key support and resistance levels and explains how momentum signals, especially RSI, could confirm the S&P 500's next breakout or breakdown....
READ MORE
MEMBERS ONLY
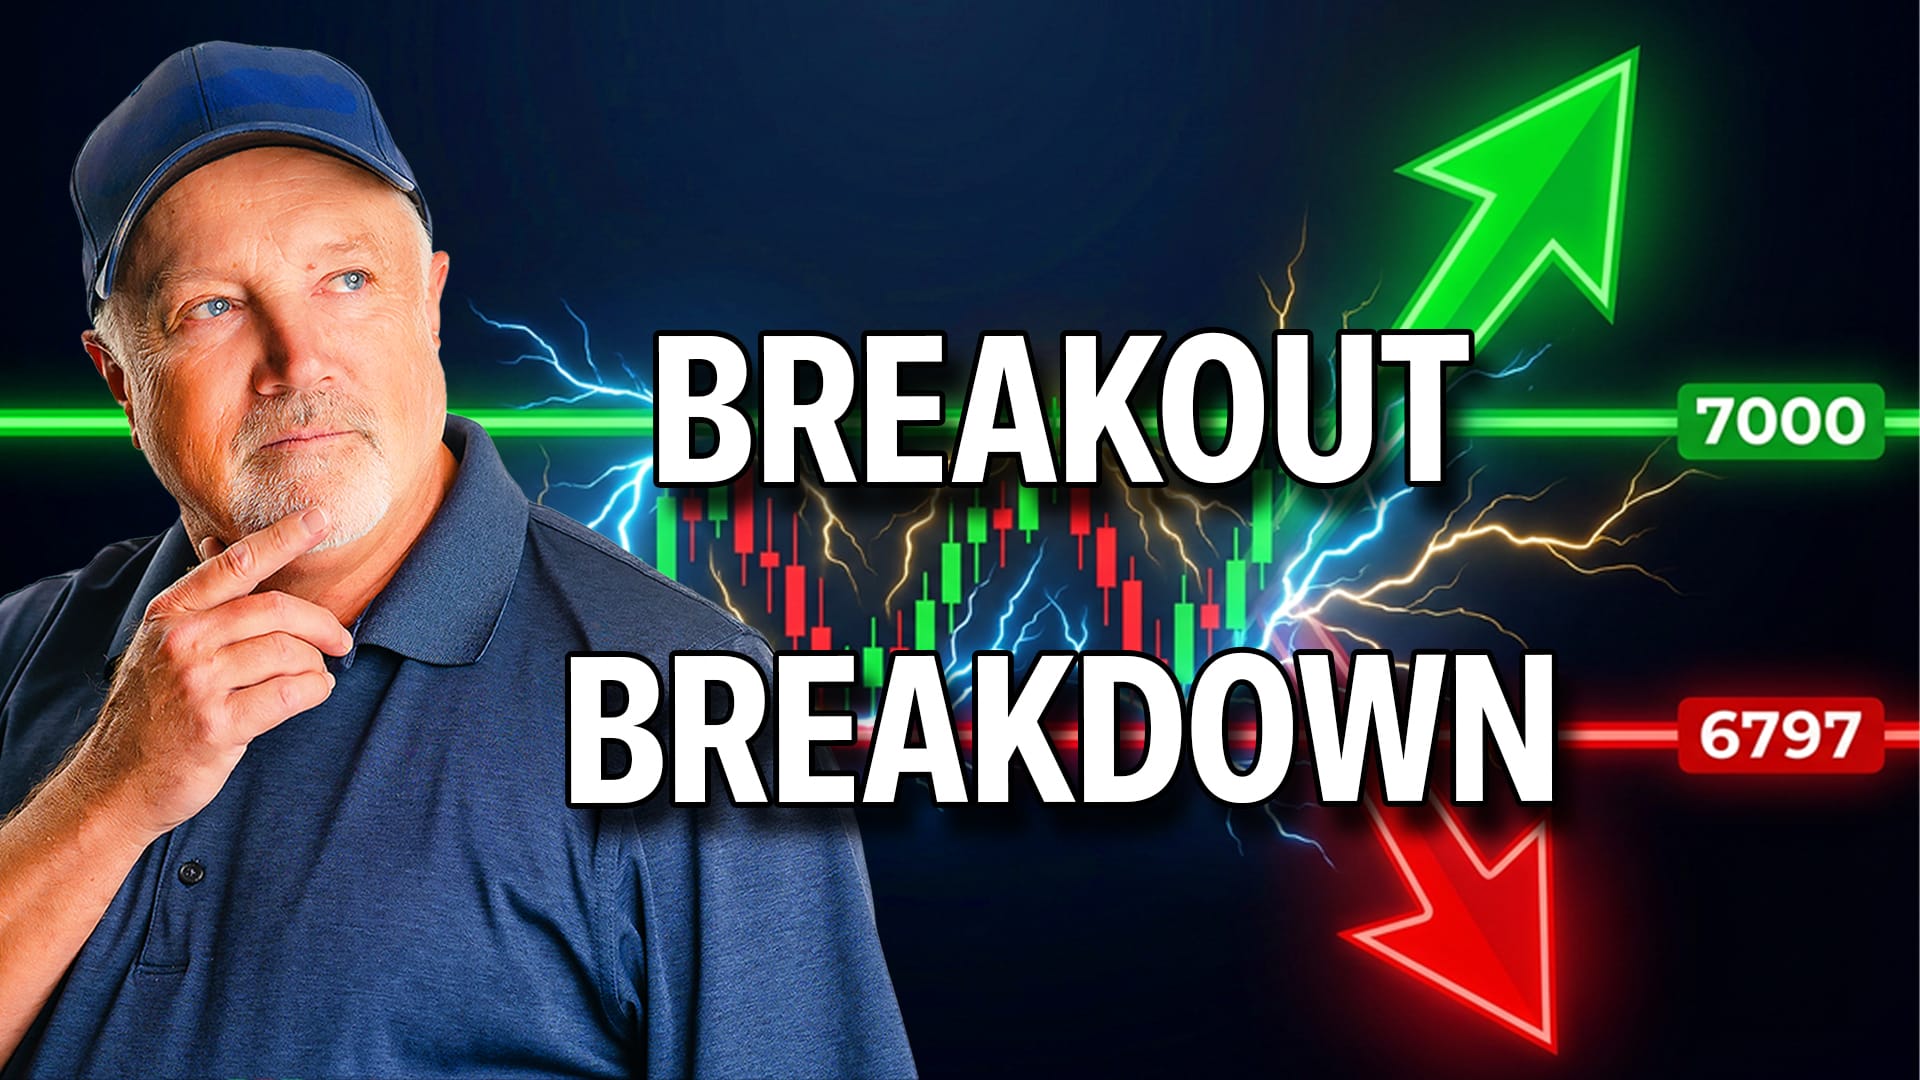
S&P 500 Trapped Between 6797 and 7000 — Which Breaks First?

by Tom Bowley,
Chief Market Strategist, EarningsBeats.com
Markets whipsawed again this week as the S&P 500 continues testing critical support at 6797. Tom Bowley reviews the major indices, highlights stocks that have crushed the S&P 500 over the past three months, and launches his new “Stock Wars” segment....
READ MORE
MEMBERS ONLY

Sector Momentum Favors Defense; QQQ Yet To Break; Split NDX Breadth
by Arthur Hill,
Chief Technical Strategist, TrendInvestorPro.com
The stock market is clearly in defensive mode but QQQ is still holding up, and its long-term breadth still hasn't turned bearish. Arthur Hill's analysis identifies the key levels to watch....
READ MORE
MEMBERS ONLY
The S&P 500 Has a Big Problem — And It’s Not Commodities
by Julius de Kempenaer,
Senior Technical Analyst, StockCharts.com
Commodities remain strong, but the S&P 500 is facing pressure from weakening large-cap sectors. In this video, Julius de Kempenaer walks through asset classes, bond maturities, and sector rotation to explain why momentum is fading — and why 675 on SPY matters more than 700....
READ MORE
MEMBERS ONLY

Think the Unthinkable: The Dollar May Go Up!
by Martin Pring,
President, Pring Research
How weak is the US dollar looking? Martin Pring analyzes the US Dollar Index and shows us that the dollar may not be in as bad a position as many think....
READ MORE
MEMBERS ONLY
RSI Divergences Can Signal Major Tops — But Only If Confirmed!
by David Keller,
President and Chief Strategist, Sierra Alpha Research
RSI divergences can warn of potential major tops, but only if confirmed by breakdown signals. David Keller walks through DG, GOOGL, AT&T, and the S&P 500 to show what must happen before a divergence becomes actionable....
READ MORE
MEMBERS ONLY

Bottom Fishing or Breakdown? How to Spot a True Trend Reversal
by David Keller,
President and Chief Strategist, Sierra Alpha Research
When high-flying stocks tumble, is it a buying opportunity or the start of a deeper decline? Dave Keller, CMT, uses Alaska Air as a case study to show how momentum divergences and moving averages can confirm a true bottom—then applies the framework to PLTR and COIN....
READ MORE
MEMBERS ONLY
Sector Strength Is Building Even as the Market Stalls
by Joe Rabil,
President, Rabil Stock Research
Joe Rabil highlights improving sector strength and internal breadth, even as the broader market remains stuck in a range. He also reviews SPY conditions, volatility, sentiment, IWM relative strength, and select stock setups....
READ MORE
MEMBERS ONLY

The Best Five Sectors This Week #53
by Julius de Kempenaer,
Senior Technical Analyst, StockCharts.com
Julius de Kempenaer presents his weekly update on sector rotation ranking using Relative Rotation Graphs....
READ MORE
MEMBERS ONLY

Week Ahead: Nifty Stares At A Major Medium-Term Support Zone; Avoid Aggressive Positioning
by Milan Vaishnav,
Founder and Technical Analyst, EquityResearch.asia and ChartWizard.ae
With India VIX rising sharply and the Nifty slipping below its 20-week moving average, what does this week hold for the Indian markets? Milan Vaishnav takes to the charts to analyze this question....
READ MORE
MEMBERS ONLY

Defensive Sectors Surge as Hindenburg Omen Flashes Warning
by David Keller,
President and Chief Strategist, Sierra Alpha Research
A confirmed Hindenburg Omen signal and renewed rotation into defensive sectors are raising caution flags for US equities. While the S&P 500 remains in a neutral range, Dave Keller, CMT, highlights key support levels and breadth signals investors should monitor closely....
READ MORE
MEMBERS ONLY

This Sector Is Making Its First Relative Breakout in 8 Years
by Tom Bowley,
Chief Market Strategist, EarningsBeats.com
Industrials are starting to outperform the S&P 500; Tom Bowley analyzes the relative strength of the sector and the industry groups within....
READ MORE
MEMBERS ONLY

Large-Cap Dominoes are Falling; XLF Joins the Fray; Money Moves into Utes and Bonds
by Arthur Hill,
Chief Technical Strategist, TrendInvestorPro.com
The large-cap tech universe is struggling; Arthur Hill analyzes how the weakness is spreading into the broader market and other sectors. Meanwhile, investors are moving money into bonds and utilities....
READ MORE
MEMBERS ONLY

Stock Market Bounce or Breakdown? These Charts Hold the Clues
by Jayanthi Gopalakrishnan,
Director of Site Content, StockCharts.com
The stock market is stalling at critical levels. Discover what the S&P 500, Nasdaq, and mrket breadth signals mean for investors....
READ MORE
MEMBERS ONLY

Semiconductors vs. Software: The Battle Driving This Market
by Tom Bowley,
Chief Market Strategist, EarningsBeats.com
Though the market remains range-bound, a growing split inside technology could decide the next move. Follow along as Tom Bowley breaks down the semiconductor breakout attempt, software weakness, and the key levels shaping this battle....
READ MORE
MEMBERS ONLY
These Breakout Setups Are Forming — Here’s What to Watch
by Joe Rabil,
President, Rabil Stock Research
Joe Rabil highlights breakout setups that are forming and explains what to watch for in a quality breakout entry. He also takes a look at SPY market conditions, volatility, sentiment, and Bitcoin’s technical outlook....
READ MORE
MEMBERS ONLY

The Best Five Sectors This Week #52
by Julius de Kempenaer,
Senior Technical Analyst, StockCharts.com
Julius de Kempenaer presents his weekly update on sector rotation using Relative Rotation Graphs....
READ MORE
MEMBERS ONLY
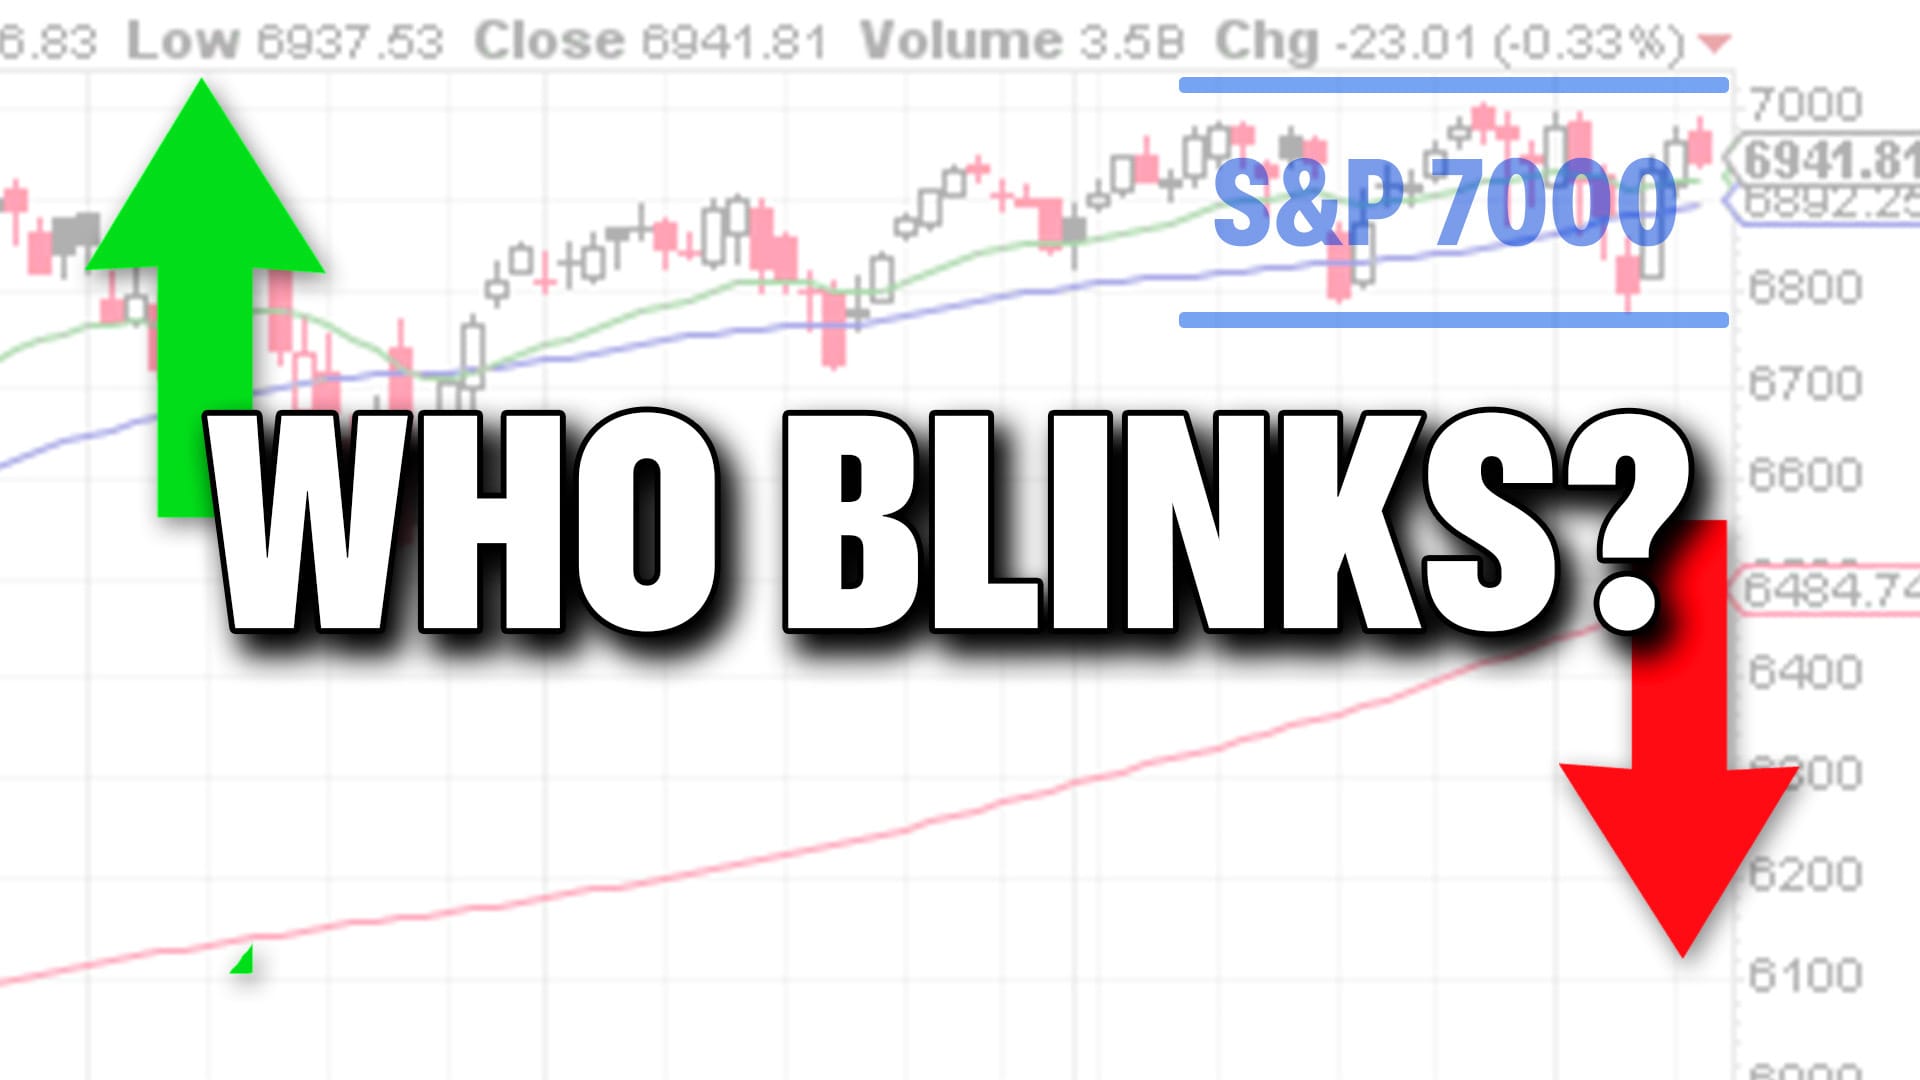
S&P 500 Can’t Clear 7000. Who Blinks First?

by Frank Cappelleri,
Founder & President, CappThesis, LLC
The S&P 500 keeps testing 7000, but follow-through has been elusive. Frank Cappelleri breaks down the breakout attempts, failed bearish signals, and internal strength that could determine who gives way first....
READ MORE
MEMBERS ONLY

This Sector Looks Ready to Break Out Big Time
by Martin Pring,
President, Pring Research
Martin takes a look at some important signs that suggest the Real Estate sector has reached the end of a corrective period and could be poised for a major breakout....
READ MORE