MEMBERS ONLY

These HOT Industry Groups are Fueling This Secular Bull Market

by Tom Bowley,
Chief Market Strategist, EarningsBeats.com
Join Tom as he covers key inflation data, earnings season highlights, and sector rotation trends. He breaks down recent price action in major indexes like the S&P 500 and Nasdaq, with a close look at the 20-day moving average as a support gauge. Tom spotlights standout industry groups...
READ MORE
MEMBERS ONLY
30 Dow Stocks in 20 Minutes: Joe Rabil's Mid-Year Technical Check

by Joe Rabil,
President, Rabil Stock Research
This week, Joe analyzes all 30 Dow Jones Industrial Average stocks in a rapid-fire format, offering key technical takeaways and highlighting potential setups in the process. Using his multi-timeframe momentum and trend approach, Joe shows how institutional investors assess relative strength, chart structure, ADX signals, and support zones. From Boeing&...
READ MORE
MEMBERS ONLY
Four Symbols, One Big Message: What the Charts are Telling Us

by Frank Cappelleri,
Founder & President, CappThesis, LLC
From the S&P 500's pause within a bullish trend, to critical support levels in semiconductors, plus bullish breakouts in Ethereum and Bitcoin, Frank highlights how the market's recent consolidation may lead to major upside. In this video, Frank explores how to use StockCharts to...
READ MORE
MEMBERS ONLY

Bitcoin Breaks to an All-Time High; Should We Uncork the Champagne?

by Martin Pring,
President, Pring Research
Bitcoin broke out to a new all-time high last week, so it seemed to me that it would be a good time to come out with a bullish article. After all, Chart 1 shows that a solid breakout came from a one-year reverse head-and-shoulders pattern, which was also accompanied by...
READ MORE
MEMBERS ONLY

From Hammer to Harami: Using StockCharts to Crack the Candlestick Code

by David Keller,
President and Chief Strategist, Sierra Alpha Research
Join Dave as he reviews three common candle patterns traders can use to identify potential turning points. From bullish engulfing patterns to evening star patterns, Dave gives insights on how to leverage these powerful candle signals to anticipate market shifts. He also shows combining candle patterns with conventional technical analysis...
READ MORE
MEMBERS ONLY
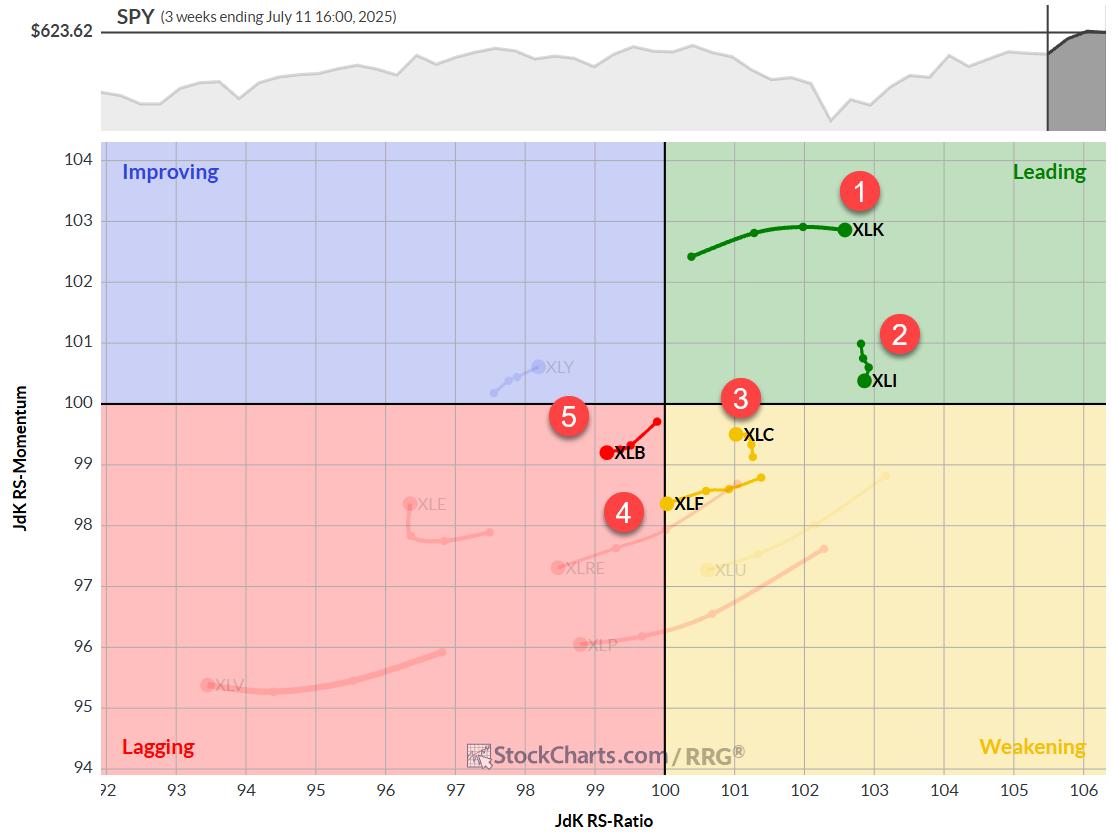
The Best Five Sectors, #27

by Julius de Kempenaer,
Senior Technical Analyst, StockCharts.com
KEY TAKEAWAYS
* Materials sector climbs to #5 in rankings, displacing Utilities
* Technology maintains leadership, but Communication Services and Financials show weakness
* Daily RRG reveals potential for Materials, caution needed for Comm Services and Financials
* Portfolio drawdown continues, currently 8% behind S&P 500 YTD
After a relatively quiet week...
READ MORE
MEMBERS ONLY
Here's What's Fueling the Moves in Bitcoin, Gaming, and Metals

by Mary Ellen McGonagle,
President, MEM Investment Research
Is the market flashing early signs of a shift?
In this week's video, Mary Ellen McGonagle breaks down the subtle but telling moves happening under the surface. From strength in semiconductors, home builders, and energy to surging momentum in Bitcoin and silver, Mary Ellen highlights the sectors gaining...
READ MORE
MEMBERS ONLY
What Happens Next for the S&P 500? Pick Your Path!
by David Keller,
President and Chief Strategist, Sierra Alpha Research
The S&P continues to push higher, with the equity benchmark almost reaching 6300 this week for the first time in history. With so many potential macro headwinds still surrounding us, how can the market continue to reflect so much optimism? On the other hand, when will bulls wake...
READ MORE
MEMBERS ONLY
These 25 Stocks Drive the Market: Are You Watching Them?

by Grayson Roze,
Chief Strategist, StockCharts.com
If you're serious about trading or investing, establishing a weekly market routine is a must. But where do you begin?
In this eye-opening video, Grayson Roze, Chief Strategist at StockCharts, shares the method he uses every week to stay aligned with the market's biggest drivers — the...
READ MORE
MEMBERS ONLY
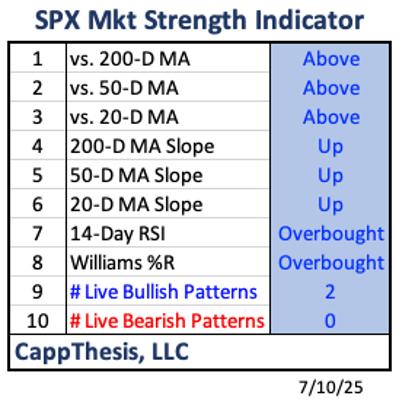
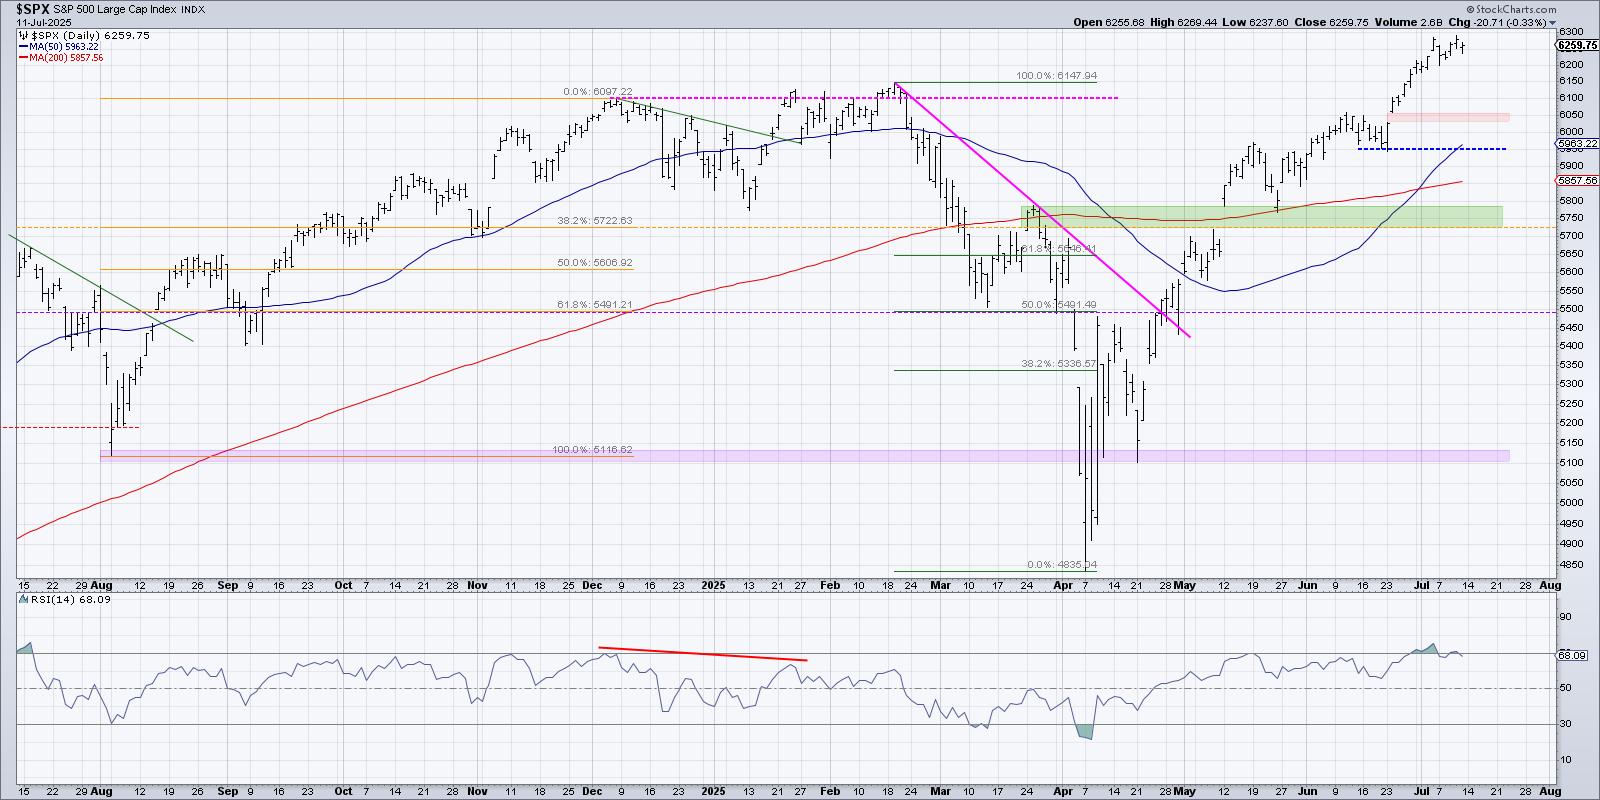
The CappThesis Market Strength Indicator: What It's Telling Us Now
by Frank Cappelleri,
Founder & President, CappThesis, LLC
KEY TAKEAWAYS
* The S&P 500 has been holdign above 6.200 for a week and hte Market Strength Indicator (MSI) is showing strong bullish momentum.
* While the MSI is highly bullish, history tells us that extreme readings often precede a pause or short-term pullback.
* Even with the potential...
READ MORE
MEMBERS ONLY

The Small Cap 'Early Warning' System: Use StockCharts to Time Pullbacks and Protect Profits

by Jayanthi Gopalakrishnan,
Director of Site Content, StockCharts.com
The stock market continued to push higher with the S&P 500 ($SPX) and Nasdaq Composite ($COMPQ) closing at record highs on Thursday. The Dow Jones Industrial Average ($INDU) tacked on a solid 192 points (+0.43%). There was a pullback on Friday, but July is a seasonally strong...
READ MORE
MEMBERS ONLY

How I Triple My Returns With 3x Leveraged ETFs!
by Tom Bowley,
Chief Market Strategist, EarningsBeats.com
Investing in triple-leveraged ETFs may not be on your radar. But that may change after you watch this video.
Tom Bowley of EarningsBeats shares how he uses the 3x leveraged ETFs to take advantage of high probability upside moves. Tom shows charts of 3x leveraged ETFs that mirror their benchmark...
READ MORE
MEMBERS ONLY
Want Faster, Lower Risk Trades? Use This Setup
by Joe Rabil,
President, Rabil Stock Research
A good trade starts with a well-timed entry and a confident exit. But that's easier said than done.
In this video, Joe Rabil of Rabil Stock Research reveals his go-to two-timeframe setup he uses to gain an edge in his entry and exit timings and reduce his investment...
READ MORE
MEMBERS ONLY
Small Caps Are Rotating In — Here's Why It Matters
by Julius de Kempenaer,
Senior Technical Analyst, StockCharts.com
After months of whiplash sector swings, the market may finally be showing signs of settling down.
In this video, Julius de Kempenaer uses Relative Rotation Graphs (RRG) to analyze asset class rotation at a high level and then dives into sectors and factors. Julius highlights the rotation into cryptocurrencies and...
READ MORE
MEMBERS ONLY

The Battle Between Fed Chairman and the President Will Ultimately Be Won by the Market!
by Martin Pring,
President, Pring Research
The President and the Fed Chair have been in a battle over lower rates for some time. One has been pressuring for easy money to boost the economy, the other prefers to hold off for a while to see what effects the tariffs and other factors might have on inflation....
READ MORE
MEMBERS ONLY

Tariff Shock Spurs "Buy-the-Dip" Setups in Tesla and ON Semiconductor
by Jayanthi Gopalakrishnan,
Director of Site Content, StockCharts.com
Just when we thought tariff talk had gone quiet, it's back on center stage. With the reciprocal tariff deadline landing this Wednesday, President Trump has mailed out notices that new duties will kick in on August 1. Countries such as Japan, South Korea, Malaysia, and Kazakhstan face a...
READ MORE
MEMBERS ONLY

The Best Five Sectors, #26
by Julius de Kempenaer,
Senior Technical Analyst, StockCharts.com
The past week has been relatively stable in terms of sector rankings, with no new entrants or exits from the top five. However, we're seeing some interesting shifts within the rankings that warrant closer examination. Let's dive into the details and see what the Relative Rotation...
READ MORE
MEMBERS ONLY
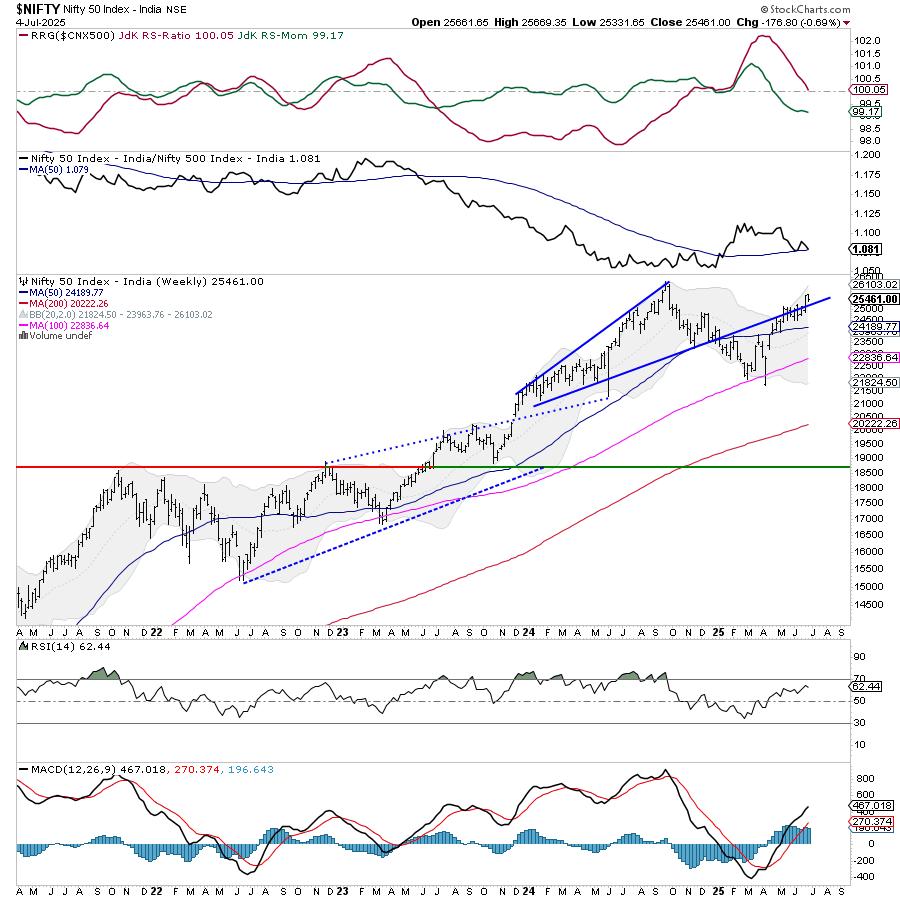
Week Ahead: NIFTY Set To Stay In A Defined Range Unless These Levels Are Taken Out; Drags Support Higher

by Milan Vaishnav,
Founder and Technical Analyst, EquityResearch.asia and ChartWizard.ae
After a strong move in the week before this one, the Nifty spent the last five sessions largely consolidating in a very defined range. The markets traded with a weak underlying bias and lost ground gradually over the past few days; however, the drawdown remained quite measured and within the...
READ MORE
MEMBERS ONLY

From Oversold to Opportunity: Small Caps on the Move
by Mary Ellen McGonagle,
President, MEM Investment Research
This holiday-shortened week was anything but short on action! The S&P 500 and Nasdaq Composite closed at record highs, but what is really driving the market?
In this essential recap, expert Mary Ellen McGonagle dives into the sectors and stocks making big moves. She'll reveal why...
READ MORE
MEMBERS ONLY

Money's Not Leaving the Market - It's Rotating!
by Tom Bowley,
Chief Market Strategist, EarningsBeats.com
Feeling a little anxious about the market, even with a strong economy? The truth is, money isn't fleeing the market; it's simply moving around, creating fresh opportunities.
In this must-watch video, Tom Bowley of EarningsBeats eases those anxieties by providing charts that show this rotation. Tom...
READ MORE
MEMBERS ONLY

MACD Crossovers: Why Most Traders Get It Wrong
by Joe Rabil,
President, Rabil Stock Research
Joe presents a deep dive into MACD crossovers, demonstrating how to use them effectively across multiple timeframes, establish directional bias, and improve trade timing. He explains why price action should confirm indicator signals, sharing how to identify "pinch plays" and zero-line reversals for higher-quality setups. Joe then analyzes...
READ MORE
MEMBERS ONLY

Market Signals Align - Is a Bigger Move Ahead?
by Frank Cappelleri,
Founder & President, CappThesis, LLC
This week, Frank analyzes recent technical signals from the S&P 500, including overbought RSI levels, key price target completions, and the breakout potential of long-term bullish patterns. He examines past market breakouts and trend shifts, showing how overbought conditions historically play out. Frank also walks through a compelling...
READ MORE
MEMBERS ONLY

The Dollar Index Just Gave a Major Sell Signal - Does That Mean It's About to Implode?
by Martin Pring,
President, Pring Research
Last month, the Dollar Index triggered a number of sell signals confirming that it is in a bear market. Chart 1, for instance, shows that the red up trendline emanating in 2011 has been decisively ruptured, thereby pushing the Index further below its moving average. The Coppock Curve, seen in...
READ MORE
MEMBERS ONLY
Top 10 July 2025 Stock Picks You Shouldn't Miss
by Grayson Roze,
Chief Strategist, StockCharts.com
Join Grayson for a solo show as he reveals his top 10 stock charts to watch this month. From breakout strategies to moving average setups, he walks through technical analysis techniques using relative strength, momentum, and trend-following indicators. As a viewer, you'll also gain insight into key market...
READ MORE
MEMBERS ONLY

Tech Stocks Lead the Charge: What's Driving the Momentum?
by Jayanthi Gopalakrishnan,
Director of Site Content, StockCharts.com
The last day of trading for the first half of 2025 ended with a bang. The S&P 500 ($SPX) and Nasdaq Composite ($COMPQ) closed at record highs - an impressive finish, given the year has seen significant swings.
We saw signs of investors rotating into technology stocks last...
READ MORE
MEMBERS ONLY
Pullbacks & Reversals: Stocks Setting Up for Big Moves!
by Mary Ellen McGonagle,
President, MEM Investment Research
In this video, Mary Ellen spotlights key pullback opportunities and reversal setups in the wake of a strong market week, one which saw all-time highs in the S&P 500 and Nasdaq. She breaks down the semiconductor surge and explores the bullish momentum in economically-sensitive sectors, including software, regional...
READ MORE
MEMBERS ONLY

The Best Five Sectors, #25
by Julius de Kempenaer,
Senior Technical Analyst, StockCharts.com
A Greek Odyssey
First of all, I apologize for any potential delays or inconsistencies this week. I'm currently writing this from a hotel room in Greece, surrounded by what I can only describe as the usual Greek chaos. Our flight back home was first delayed, then canceled, then...
READ MORE
MEMBERS ONLY

Week Ahead: As NIFTY Breaks Out, Change of Leadership Likely to Keep the Index Moving
by Milan Vaishnav,
Founder and Technical Analyst, EquityResearch.asia and ChartWizard.ae
After six weeks of consolidation and trading in a defined range, the markets finally broke out from this formation and ended the week with gains. Over the past five sessions, the markets have largely traded with a positive undercurrent, continuing to edge higher. The trading range was wider than anticipated;...
READ MORE
MEMBERS ONLY
Fibonacci Retracements: The Key to Identifying True Breakouts
by David Keller,
President and Chief Strategist, Sierra Alpha Research
If you've looked at enough charts over time, you start to recognize classic patterns that often appear. From head-and-shoulders tops to cup-and-handle patterns, they almost jump off the page when you bring up the chart. I would definitely include Fibonacci Retracements on that list, because before I ever...
READ MORE
MEMBERS ONLY

NEW! 5 Significant Additions to Our Professionally-Curated Market Summary Dashboard
by Grayson Roze,
Chief Strategist, StockCharts.com
Take a tour of the FIVE latest updates and additions to our fan-favorite, professionally-curated Market Summary dashboard with Grayson!
In this video, Grayson walks viewers through the new charts and indexes that have been added to multiple panels on the page. These include mini-charts for the S&P sectors,...
READ MORE
MEMBERS ONLY

Breakdown of NVDA's Stock Price and S&P 500: Actionable Technical Insights
by Frank Cappelleri,
Founder & President, CappThesis, LLC
The S&P 500 ($SPX) just logged its second consecutive 1% gain on Tuesday. That's three solid 1% advances so far in June. And with a few trading days remaining in the month, the index has recorded only one 1% decline so far.
A lot can still...
READ MORE
MEMBERS ONLY

Shifting Tides in the Stock Market: A New Era for Bulls?
by Jayanthi Gopalakrishnan,
Director of Site Content, StockCharts.com
The stock market has been on quite the rollercoaster of late, thanks to news headlines. But investors seem to have shrugged off the past weekend's geopolitical tensions, at least for now.
On Tuesday, we saw a surge of enthusiasm. Investors were diving back into stocks and selling off...
READ MORE
MEMBERS ONLY
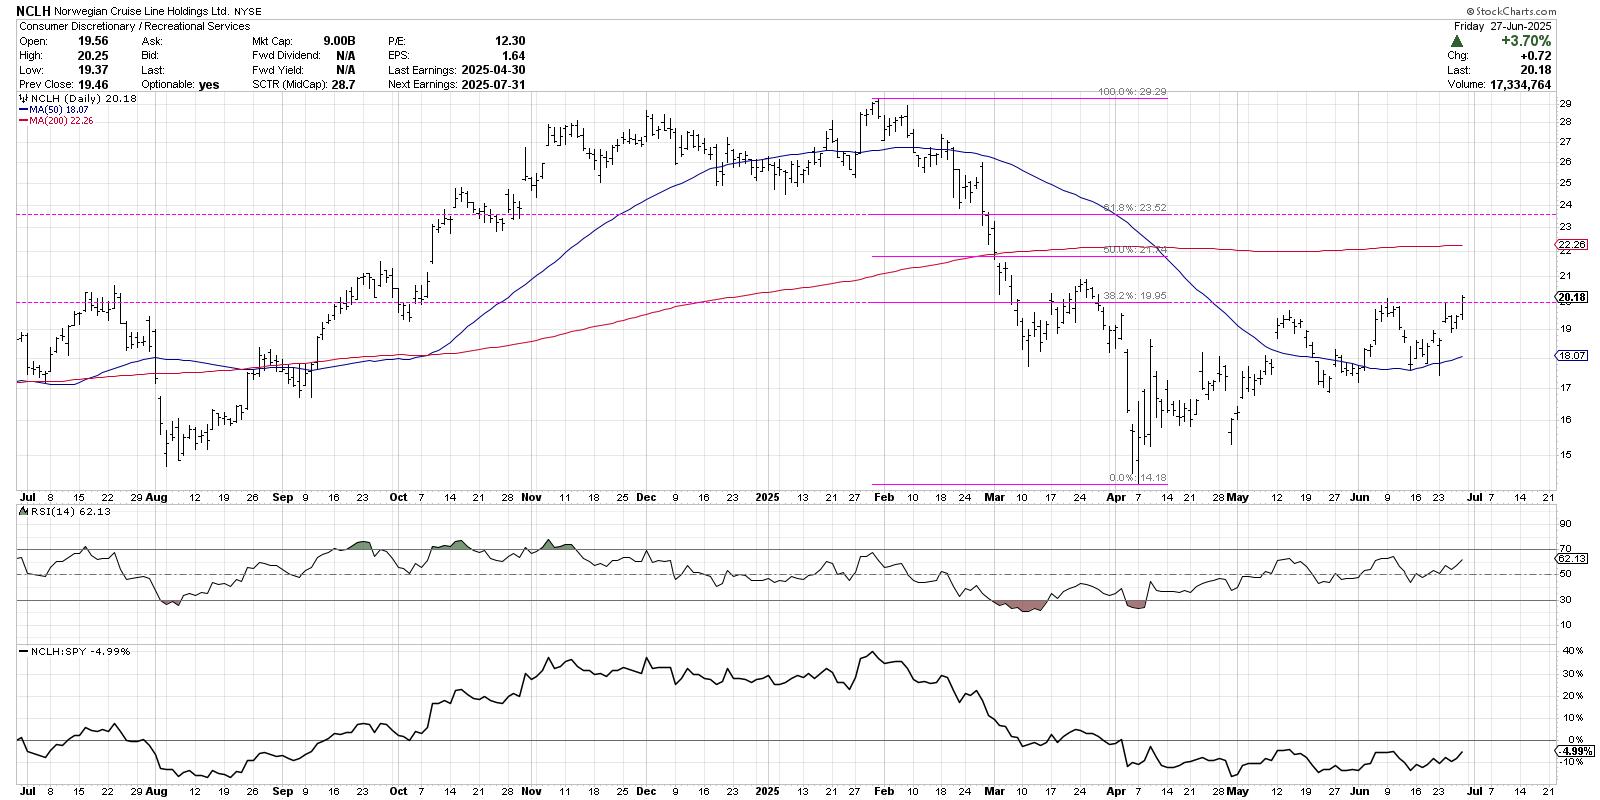
How to Use Fibonacci Retracements to Spot Key Levels
by David Keller,
President and Chief Strategist, Sierra Alpha Research
Join Dave as he shares how he uses the power of Fibonacci retracements to anticipate potential turning points. He takes viewers through the process of determining what price levels to use to set up a Fibonacci framework, and, from there, explains what Fibonacci retracements are telling him about the charts...
READ MORE
MEMBERS ONLY

Never Easy to Predict, the Price of Crude Just Got Harder
by Martin Pring,
President, Pring Research
Earlier in the month, I wrote an article pointing out that gold and copper typically move ahead of oil. It's true, the leads and lags between these three entities differ from cycle to cycle. However, since gold momentum turned up in early 2023 and copper in early 2022,...
READ MORE
MEMBERS ONLY

Offense vs. Defense: How Geopolitical Tensions Shape Market Trends

by Karl Montevirgen,
The StockCharts Insider
As the cycle of uncertainty continues to yield confusion than clarity, investors are again caught having to decide between taking an offensive and defensive posture in the market. The tough part in today's market environment is how fast situations can shift. With headlines driving the action, sentiment can...
READ MORE
MEMBERS ONLY

AI Stocks Ignite Again—Where Smart Money is Heading Next
by Mary Ellen McGonagle,
President, MEM Investment Research
In this video, Mary Ellen opens with a look at the S&P 500, noting that the index remains above its 10-day average despite a brief pullback—a sign of healthy market breadth. She points to ongoing sector leadership in technology, while observing that energy and defense stocks are...
READ MORE
MEMBERS ONLY
The Best Five Sectors, #24
by Julius de Kempenaer,
Senior Technical Analyst, StockCharts.com
Some Sector Reshuffling, But No New Entries/Exits
Despite a backdrop of significant geopolitical events over the weekend, the market's reaction appears muted -- at least, in European trading. As we assess the RRG best five sectors model based on last Friday's close, we're...
READ MORE
MEMBERS ONLY

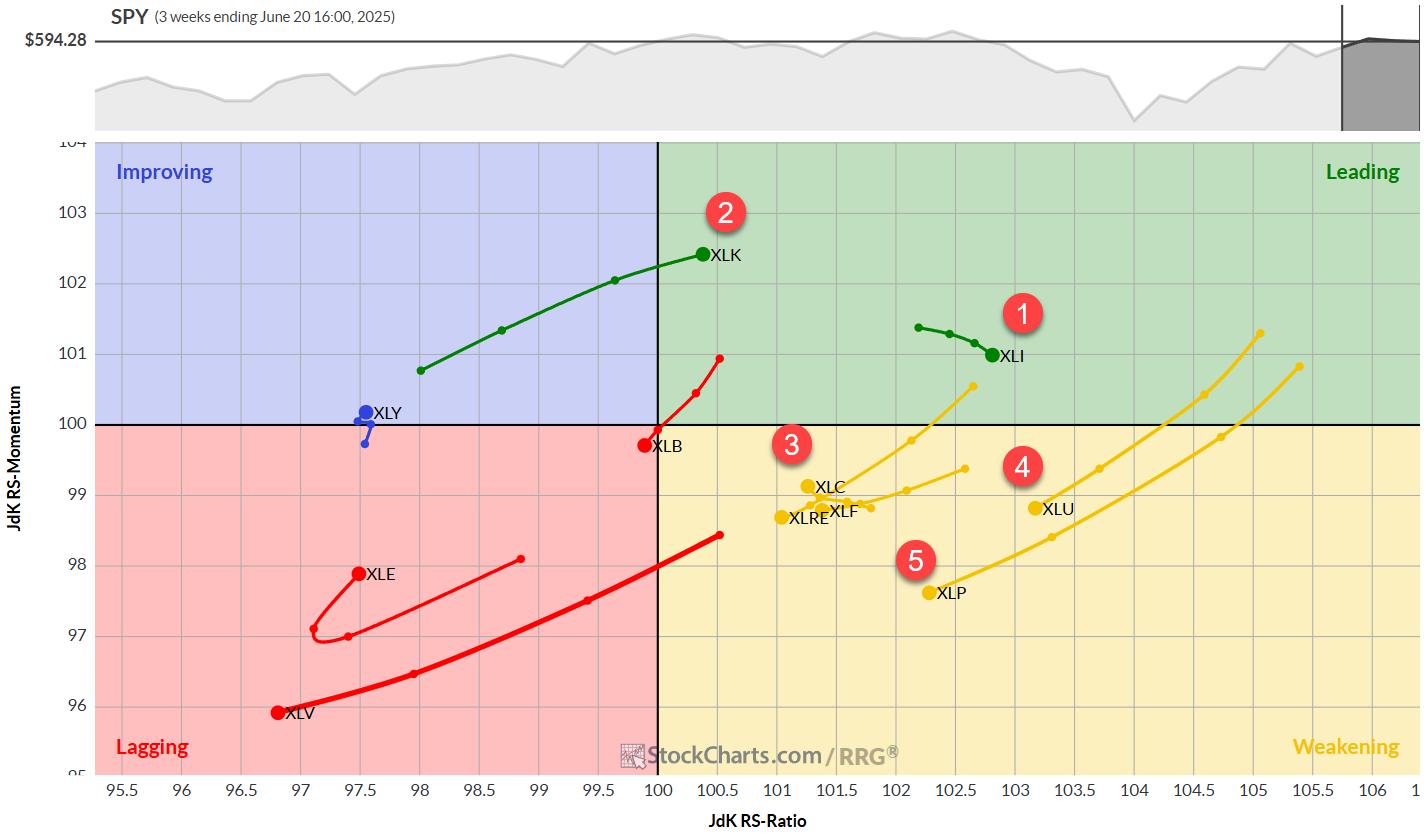
RRG Alert Tech Vaults to ‘Leading'—Is XLK Signaling a New Rally?
by Julius de Kempenaer,
Senior Technical Analyst, StockCharts.com
This week, Julius breaks down the current sector rotation using his signature Relative Rotation Graphs, with XLK vaulting into the leading quadrant while utilities and staples fade. He spotlights strength in the technology sector, led by semiconductors and electronic groups that are outpacing the S&P 500. Microchip heavyweights...
READ MORE
MEMBERS ONLY

Feeling Unsure About the Stock Market's Next Move? These Charts Can Help
by Jayanthi Gopalakrishnan,
Director of Site Content, StockCharts.com
When the stock market seems to be drifting sideways without displaying a clear bullish or bearish bias, it's normal for investors to get anxious. It's like being at a crossroads, wondering whether to go left, right, or stay put.
The truth is nobody has a crystal...
READ MORE
MEMBERS ONLY
Joe Rabil's Undercut & Rally Pattern: From DROP to POP
by Joe Rabil,
President, Rabil Stock Research
Joe presents his game-changing "undercut and rally" trading pattern, which can be found in high volatility conditions and observed via RSI, MACD and ADX signals. Joe uses the S&P 500 ETF as a live case study, with its fast shake-out below support followed by an equally...
READ MORE