MEMBERS ONLY

DP Trading Room: Does This Rally Have Legs?

by Erin Swenlin,
Vice President, DecisionPoint.com
In today's free DP Trading Room Carl and Erin discuss whether this market rally can get legs and push the market even higher? Mega-caps are looking very positive with the Magnificent Seven leading the charge. Technology is showing new strength along with Communication Services.
Carl starts the trading...
READ MORE
MEMBERS ONLY

These Riskier Areas Start the New Year RALLY!

by Mary Ellen McGonagle,
President, MEM Investment Research
In this video, Mary Ellen analyzes the divergence between the S&P 500 and the Nasdaq while highlighting some of the areas driving Growth stocks. She also talks about the continuation rally in Energy and Utility stocks and shares which stocks are driving these areas higher.
This video originally...
READ MORE
MEMBERS ONLY

Stock Market Ends the Week Strong: Could It Spark a Bullish January?

by Jayanthi Gopalakrishnan,
Director of Site Content, StockCharts.com
KEY TAKEAWAYS
* No Santa Claus Rally this year, but the stock market's optimistic price action on Friday lifted investors' moods.
* Stocks like TSLA and NVDA had big gains while X, CVNA, and alcoholic beverages had big declines.
* Treasury yields and the US dollar remain high, and oil...
READ MORE
MEMBERS ONLY
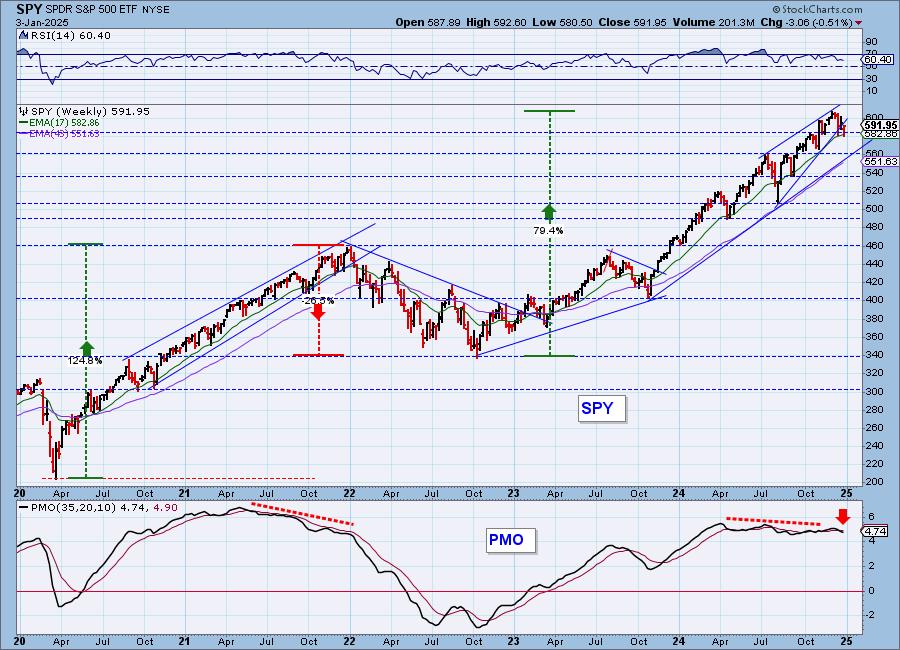
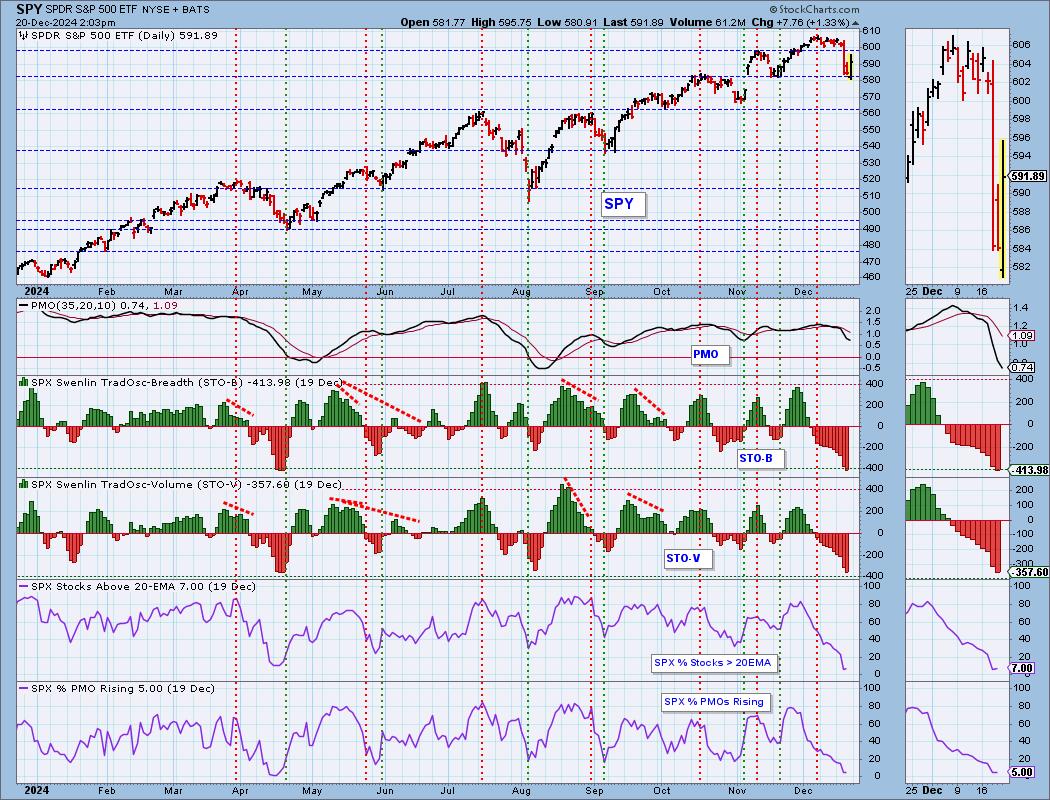
SPY Weekly Chart Breaking Down
by Erin Swenlin,
Vice President, DecisionPoint.com
We monitor the weekly SPY chart and present it to our subscribers every Friday in our DP Weekly Wrap. We have been watching a bearish rising wedge on the weekly chart. The rising wedge pattern implies that you will get a breakdown from the rising bottoms trendline. That is exactly...
READ MORE
MEMBERS ONLY
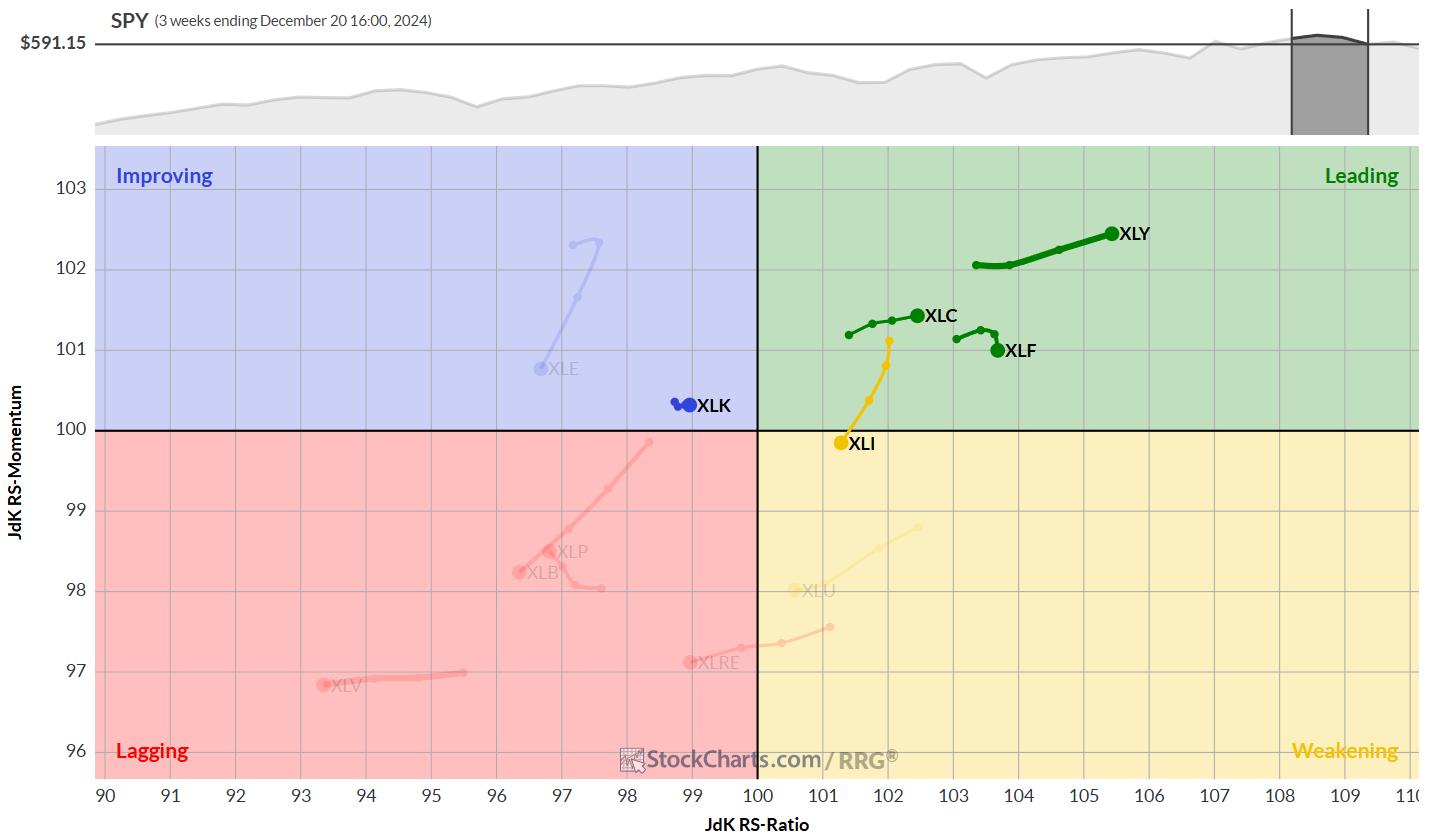
The Best Five Sectors, #1

by Julius de Kempenaer,
Senior Technical Analyst, StockCharts.com
HAPPY NEW YEAR!!!
Ever since the introduction of RRG back in 2011, many people have asked me questions like: "What is the track record for RRG" or "What are the trading rules for RRG"?
My answers have always been, and will continue to be, "There...
READ MORE
MEMBERS ONLY
Is This ADX Pattern a Warning Sign for Investors?

by Joe Rabil,
President, Rabil Stock Research
In this exclusive StockCharts video, Joe shares a specific ADX pattern that's signaling potential exhaustion in the momentum right now. Joe analyzes three other market periods that displayed this pattern and the resulting correction which followed. He then discusses some of the most attractive looking cryptos, as well...
READ MORE
MEMBERS ONLY

These Bars and Candles May Hold the Key for 2025

by Martin Pring,
President, Pring Research
Most of the time, when we study bars or candlesticks, our attention is focused on daily and intraday charts, since they give early warnings of a possible change in the short-term trend. Nonetheless, it occasionally makes sense to step back and take a look at monthly bars and candlesticks. Not...
READ MORE
MEMBERS ONLY

DP Trading Room: Natural Gas (UNG) Breaks Out!
by Erin Swenlin,
Vice President, DecisionPoint.com
It's an interesting market day with the market moving lower despite positive seasonality. Natural Gas (UNG) broke out in a big way up over 15% at the time of writing. Is it ready to continue its big run higher?
Carl took the day off so Erin gave us...
READ MORE
MEMBERS ONLY

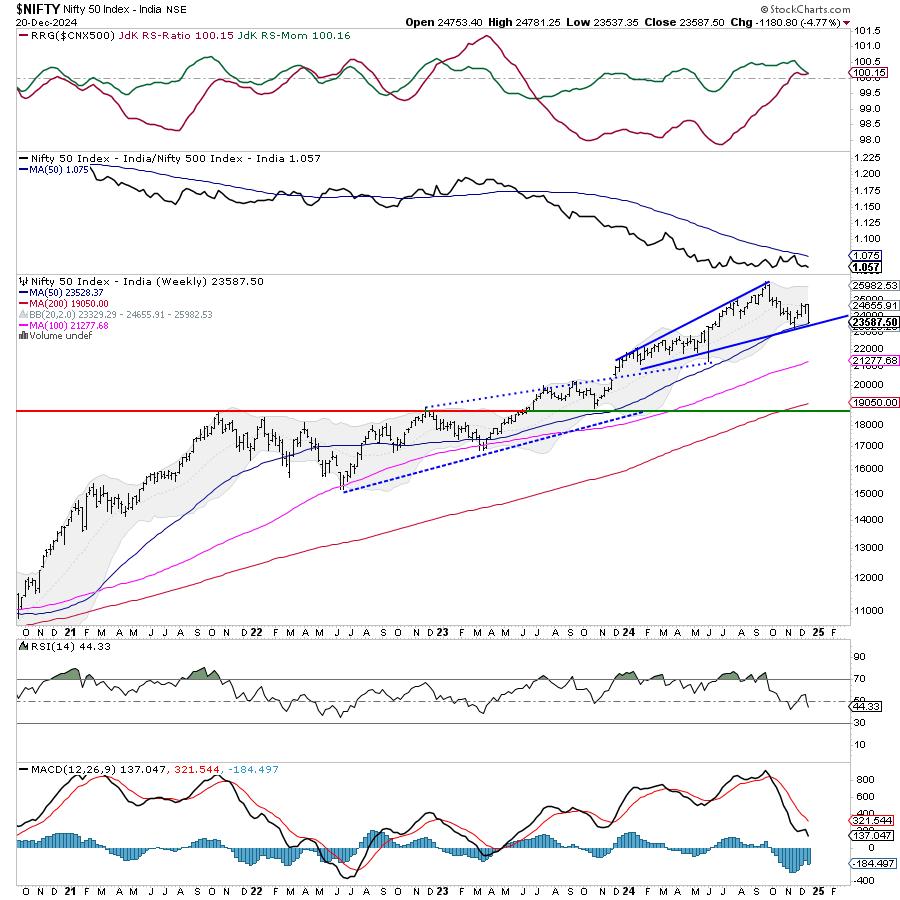
Week Ahead: NIFTY Consolidates, Must Close Above This Level Crucial to Avoid Weakness

by Milan Vaishnav,
Founder and Technical Analyst, EquityResearch.asia and ChartWizard.ae
After suffering a brutal selloff in the week before this one, the Nifty spent the truncated week struggling to stay afloat just below the key resistance levels. With just four working days, the Nifty resisted each day to the 200-DMA and failed to close above that point. The trading range...
READ MORE
MEMBERS ONLY

Trump's Policy Shift Reveals Potential Big Winner!
by Mary Ellen McGonagle,
President, MEM Investment Research
In this video, Mary Ellen highlights whether to buy last week's pullback. She discusses the rise in interest rates and why, as well as which areas are being most impacted. Last up, she reviews potential winners with new Trump policy, how to spot a downtrend reversal, and the...
READ MORE
MEMBERS ONLY

Is this Bounce a Robust Rebound or a Dead-Cat Bounce?

by Arthur Hill,
Chief Technical Strategist, TrendInvestorPro.com
KEY TAKEAWAYS
* Short-term breadth becomes most oversold in a year.
* Bounce ensues, but has yet to show material increase in participation.
* Setting key levels to identify a robust rebound.
Breadth became oversold last week and stocks rebounded this week. Is this a robust rebound or a dead cat bounce? Today&...
READ MORE
MEMBERS ONLY

DP Trading Room: Deceptive Volume Spikes
by Erin Swenlin,
Vice President, DecisionPoint.com
In today's free DecisionPoint Trading Room Carl discusses volume spikes and how we have to analyze big volume spikes carefully to determine whether they express a confirmation of a move or whether they are a special case and do not really provide insight.
Carl goes over the signal...
READ MORE
MEMBERS ONLY
Week Ahead: NIFTY's Behavior Against This Level To Influence Trends For The Coming Weeks
by Milan Vaishnav,
Founder and Technical Analyst, EquityResearch.asia and ChartWizard.ae
After staying in the green following a sharp rebound the week before this one, the markets finally succumbed to selling pressure after failing to cross above crucial resistance levels. The Nifty stayed under strong selling pressure over the past five sessions and violated key support levels on the daily charts....
READ MORE
MEMBERS ONLY

Will the Stock Market's Santa Rally Bring Holiday Cheer to Investors?
by Jayanthi Gopalakrishnan,
Director of Site Content, StockCharts.com
KEY TAKEAWAYS
* The broader stock market indexes closed higher on Friday but lower for the week.
* Market breadth continues to be weak despite Friday's rally.
* More follow-through next week is required to confirm a reversal and the hope for a Santa Claus rally.
A smart investor listens to...
READ MORE
MEMBERS ONLY
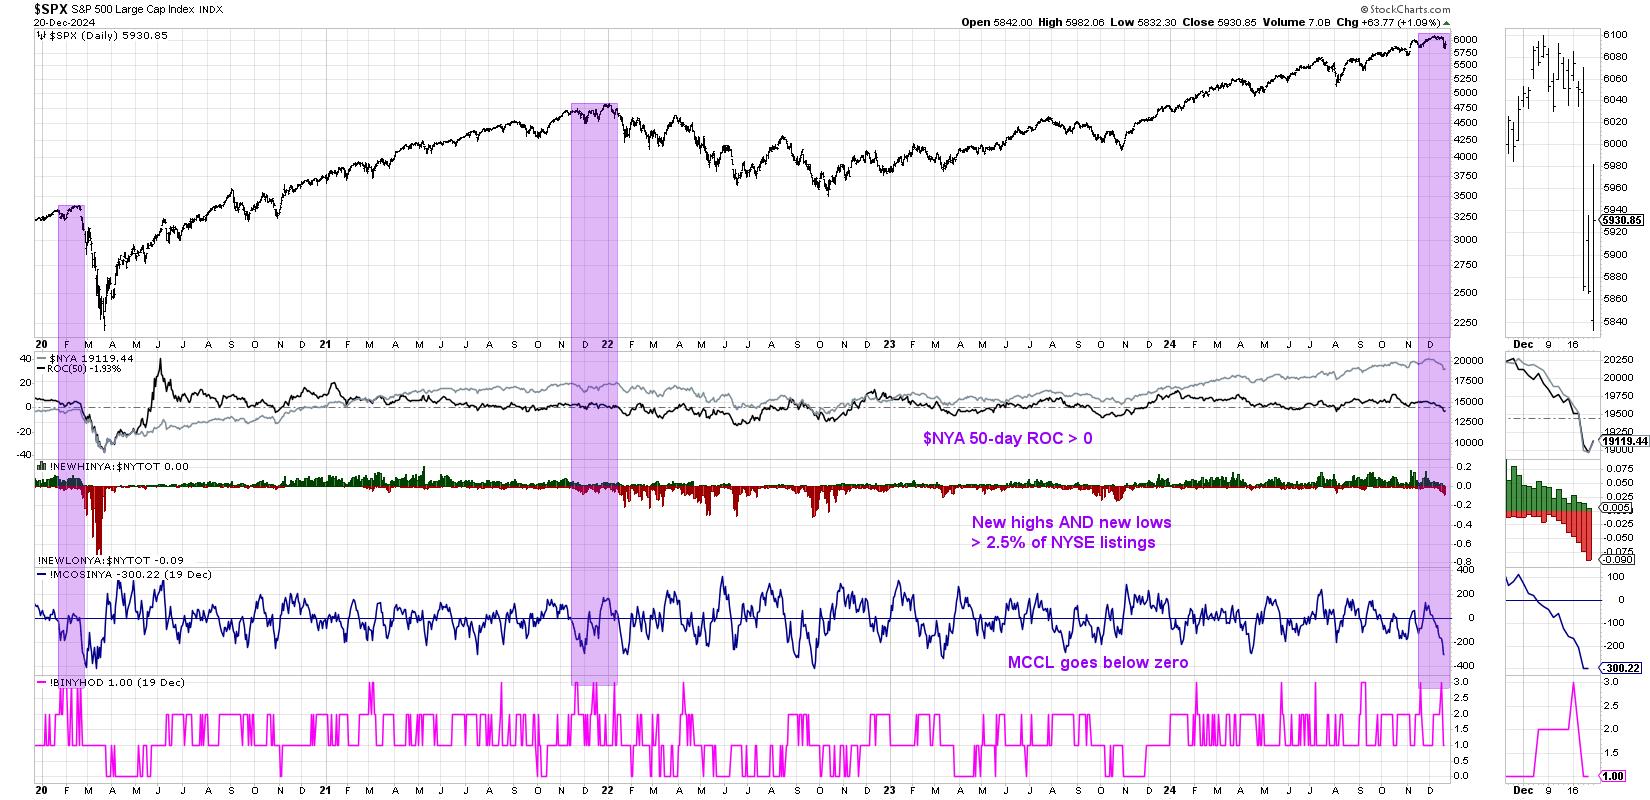
2024's Big Bang: A Deeper Dive Into the Hindenburg Omen

by David Keller,
President and Chief Strategist, Sierra Alpha Research
KEY TAKEAWAYS
* The Hindenburg Omen looks for patterns that have consistently shown at major market tops.
* Using trend-following techniques like support and resistance levels can help to improve accuracy of macro indicators.
* S&P 5850 remains the most important level in our view going into year-end 2024.
This week...
READ MORE
MEMBERS ONLY
Oversold Conditions Not Always a Friend
by Erin Swenlin,
Vice President, DecisionPoint.com
Nearly all of our charts currently show deeply oversold conditions. While this is usually a good thing, in a market downturn, it isn't necessarily your friend. As you can guess, we believe that Wednesday's big decline was the beginning of something more serious. But the question...
READ MORE
MEMBERS ONLY
The Trump Trade? Not All as MAGA as You Might Think
by Martin Pring,
President, Pring Research
The "Trump Trade" refers to the market reaction and investment strategies that emerged following Donald Trump's election victories and his economic policies. It describes the shift in market sentiment driven by anticipated pro-business policies, tax cuts, and deregulation under his administration.
Investors initially rushed into sectors...
READ MORE
MEMBERS ONLY
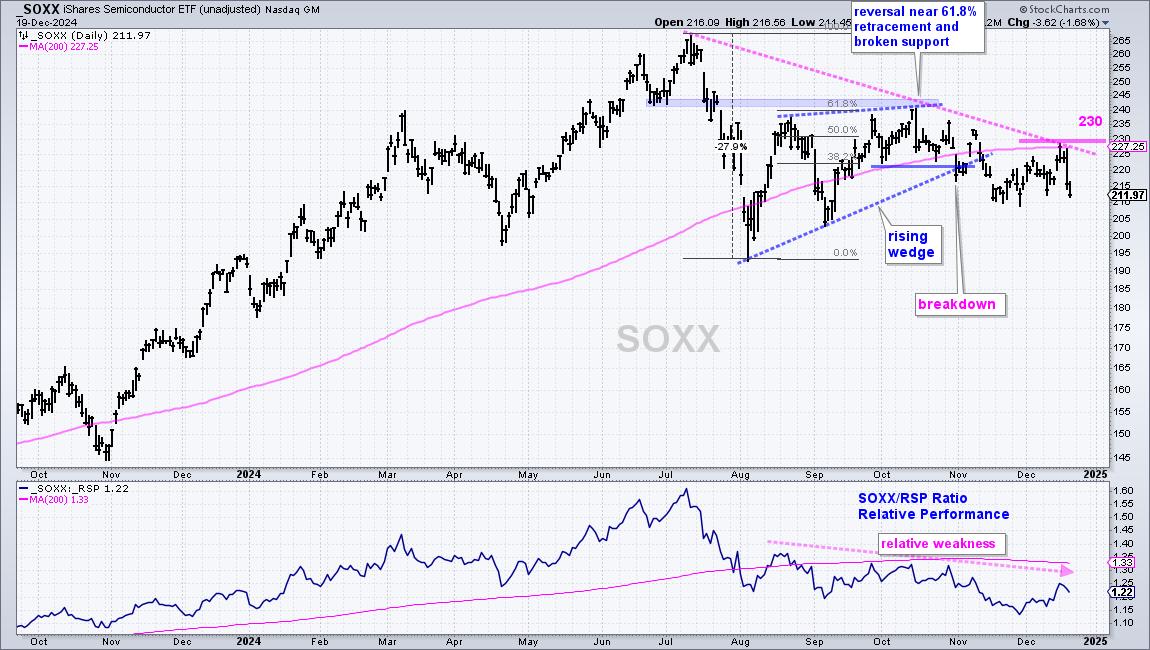
Three Big Negatives Overshadow the Uptrends in SPY and QQQ
by Arthur Hill,
Chief Technical Strategist, TrendInvestorPro.com
KEY TAKEAWAYS
* SPY and QQQ are still in long-term uptrends, but the red flags are rising.
* Housing and semis, two key cyclical groups, are in downtrends.
* Interest rates are rising as the 10-yr Yield reversed a 13 month downtrend.
SPY and QQQ remain in long-term uptrends, but three big negatives...
READ MORE
MEMBERS ONLY
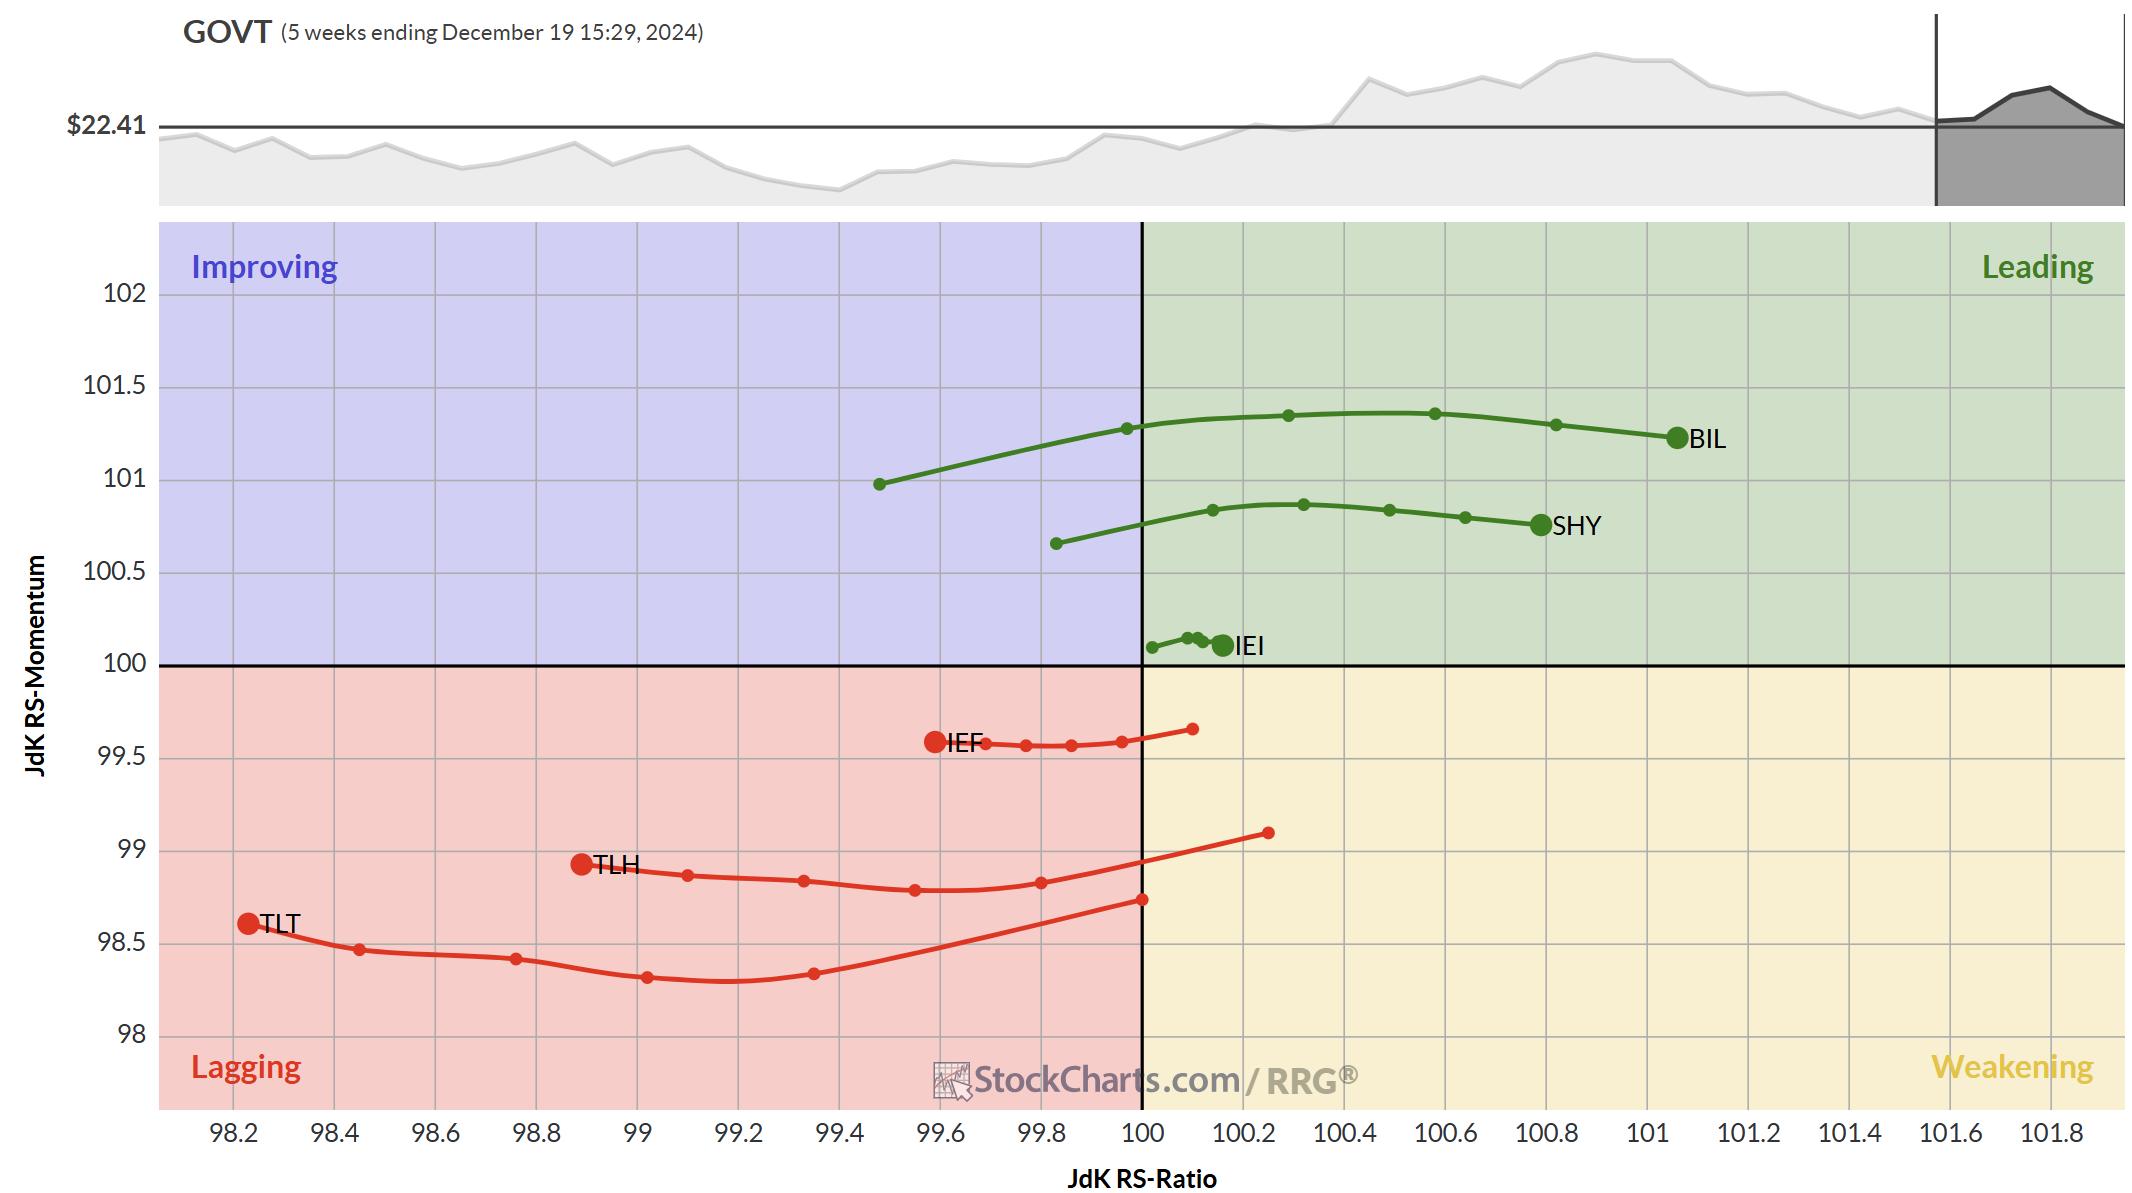
Three RRGs to Keep You on Track
by Julius de Kempenaer,
Senior Technical Analyst, StockCharts.com
KEY TAKEAWAYS
* Track the Yield curve moving back to normal on RRG
* USD showing massive strength against all currencies
* Stock market drop not affecting sector rotation (yet)
The Yield Curve
The RRG above shows the rotations of the various maturities on the US-Yield Curve.
What we see at the moment...
READ MORE
MEMBERS ONLY

Stock Market Sell-Off: Is the Bull Market Over?
by Jayanthi Gopalakrishnan,
Director of Site Content, StockCharts.com
KEY TAKEAWAYS
* Broader stock market indexes got a bearish jolt on Wednesday.
* Gold, silver, and cryptocurrencies joined the equity selloff.
* Treasury yields and the US dollar jump higher.
Uncertainty in the stock market makes it difficult to make investment decisions. When investors sell off stocks, everyone follows without giving it...
READ MORE
MEMBERS ONLY

The Big Divergence in Bullish Percents
by David Keller,
President and Chief Strategist, Sierra Alpha Research
While the S&P 500 and Nasdaq 100 have been holding steady into this week's Fed meeting, warning signs under the hood have suggested one of two things is likely to happen going into Q1. Either a leadership rotation is amiss, with mega-cap growth stocks potentially taking...
READ MORE
MEMBERS ONLY

Don't Be Surprised by an Early 2025 Pullback
by Martin Pring,
President, Pring Research
This year has been a very good one for stockholders. Come to think of it, 2023 wasn't so bad either. After an extended period of gains, it's natural for investors to become complacent, especially as they head home for the holidays.
This is the kind of...
READ MORE
MEMBERS ONLY

DP Trading Room: Is Broadcom (AVGO) the New NVIDA (NVDA)?
by Erin Swenlin,
Vice President, DecisionPoint.com
Today Erin looks at the Broadcom (AVGO) chart and compares it to the NVIDIA (NVDA) chart. She shows us the differences between the two and tells you whether she believes AVGO will be the new NVDA, meaning it will perform as NVDA used to perform with a concerted move up...
READ MORE
MEMBERS ONLY
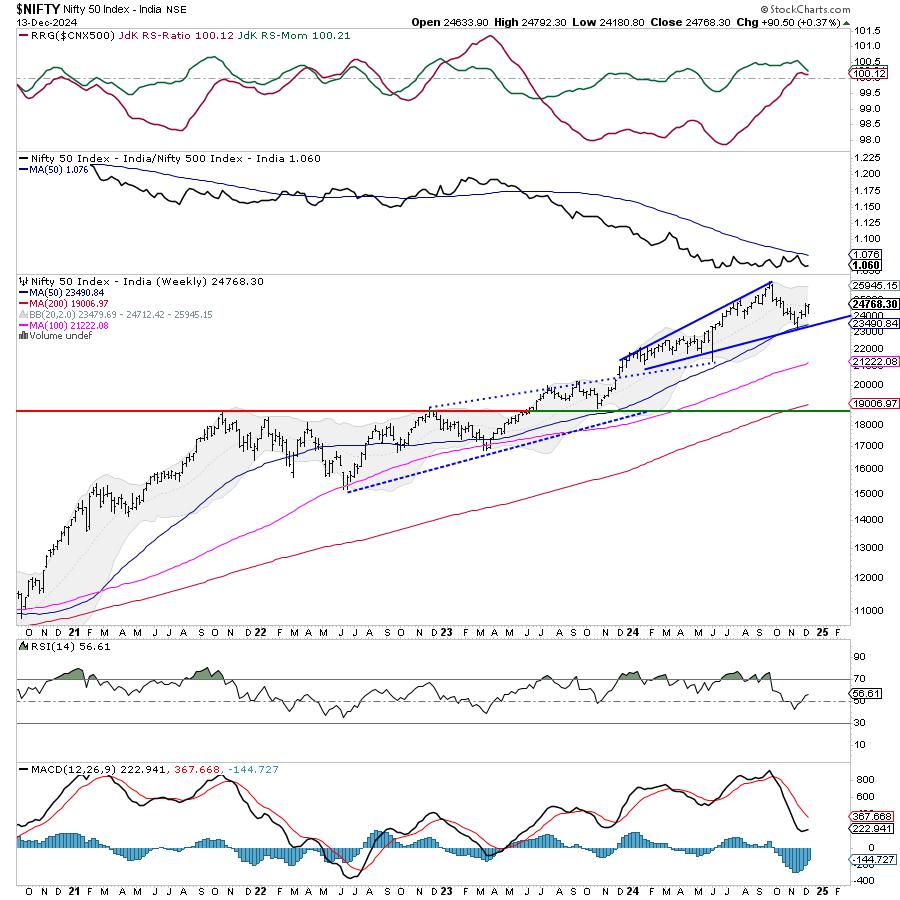
Week Ahead: NIFTY Halts at Crucial Levels; Staying Above This Point Necessary to Extend The Move
by Milan Vaishnav,
Founder and Technical Analyst, EquityResearch.asia and ChartWizard.ae
The markets had a wide-ranging week once again; however, they ended near its high point this time. The Nifty had ranged sessions for four out of five days; the last trading day of the week saw the Nifty swinging wildly before closing near its high point. The trading range also...
READ MORE
MEMBERS ONLY

How to Buy WINNERS When They Pull Back!
by Mary Ellen McGonagle,
President, MEM Investment Research
In this video, Mary Ellen highlights how select M7 stocks, mostly TSLA, propped the markets up while some sectors continued to trend lower. She reviews how to find entry points in winning stocks, and also discusses why Small Caps are falling.
This video originally premiered December 13, 2024. You can...
READ MORE
MEMBERS ONLY
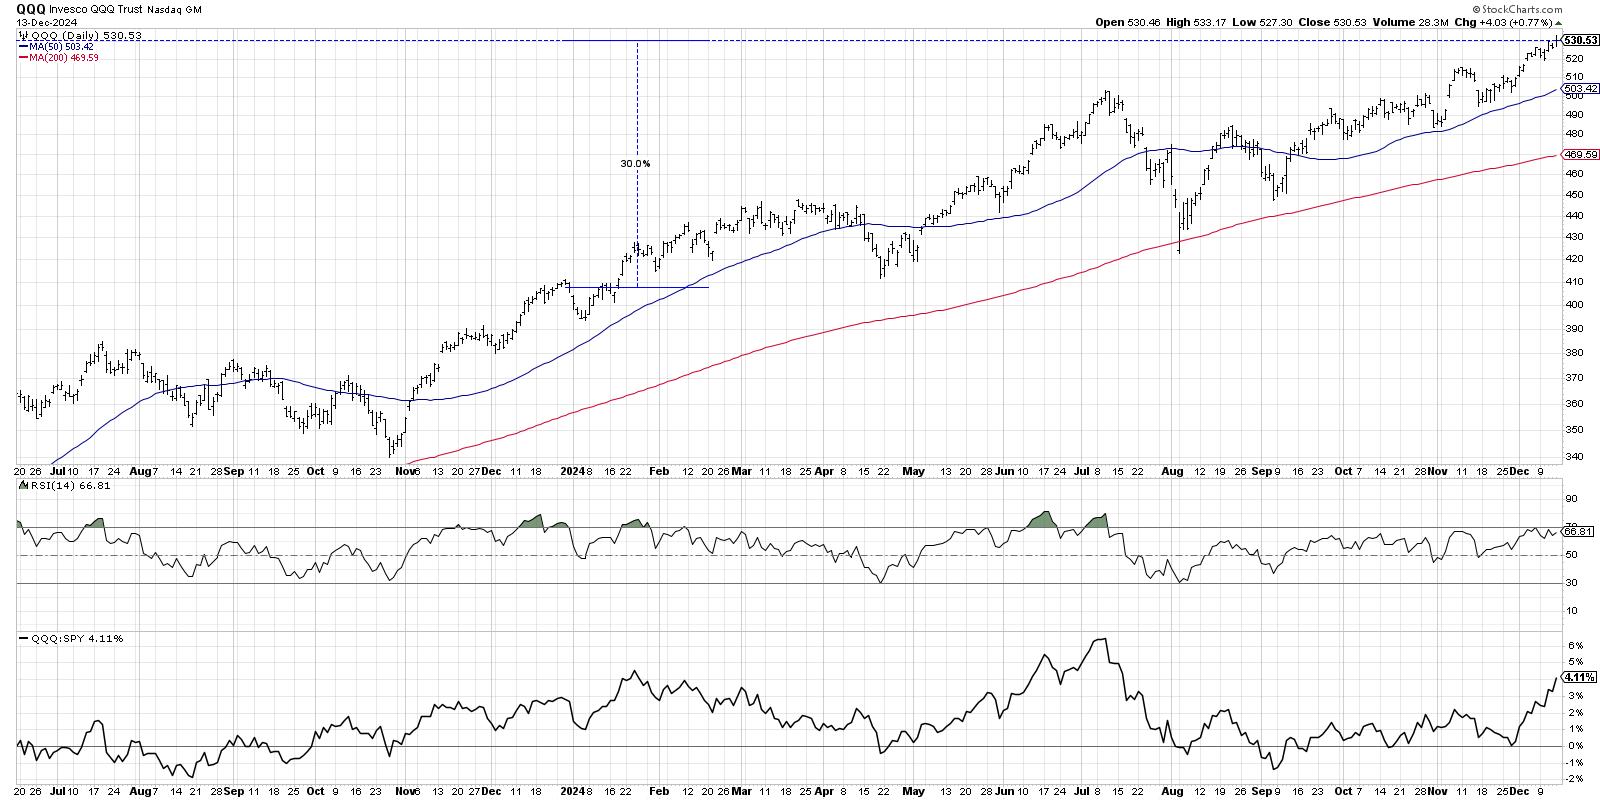
Will the QQQ Sell Off in January? Here's How It Could Happen
by David Keller,
President and Chief Strategist, Sierra Alpha Research
In recent interviews for my Market Misbehavior podcast, I've asked technical analysts including Frank Cappelleri, TG Watkins, and Tom Bowley what they see happening as we wrap a very successful 2024. With the Nasdaq 100 logging about a 30% gain for 2024, it's hard to imagine...
READ MORE
MEMBERS ONLY
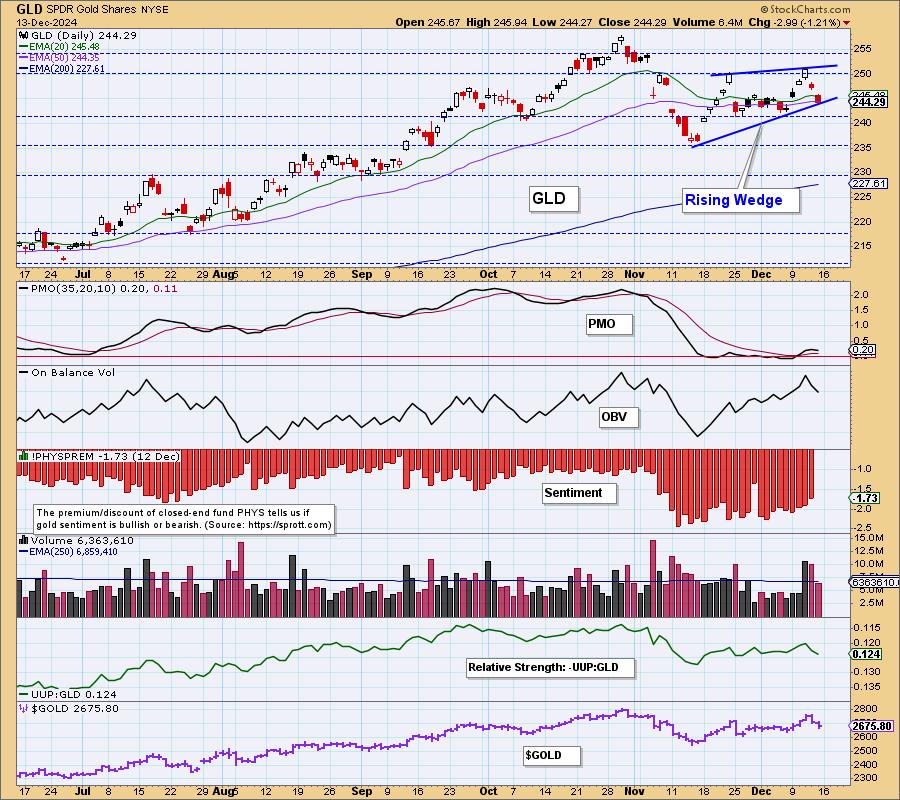
Bearish Formation Threatens Gold's Advance

by Carl Swenlin,
President and Founder, DecisionPoint.com
After the November pullback, GLD began to rally again. This week, on Wednesday, price exceeded the nearest November top, which made official the new rising trend from the November low. Brief celebration ends the following day as GLD tops, setting the top boundary for a bearish rising wedge formation. Rising...
READ MORE
MEMBERS ONLY
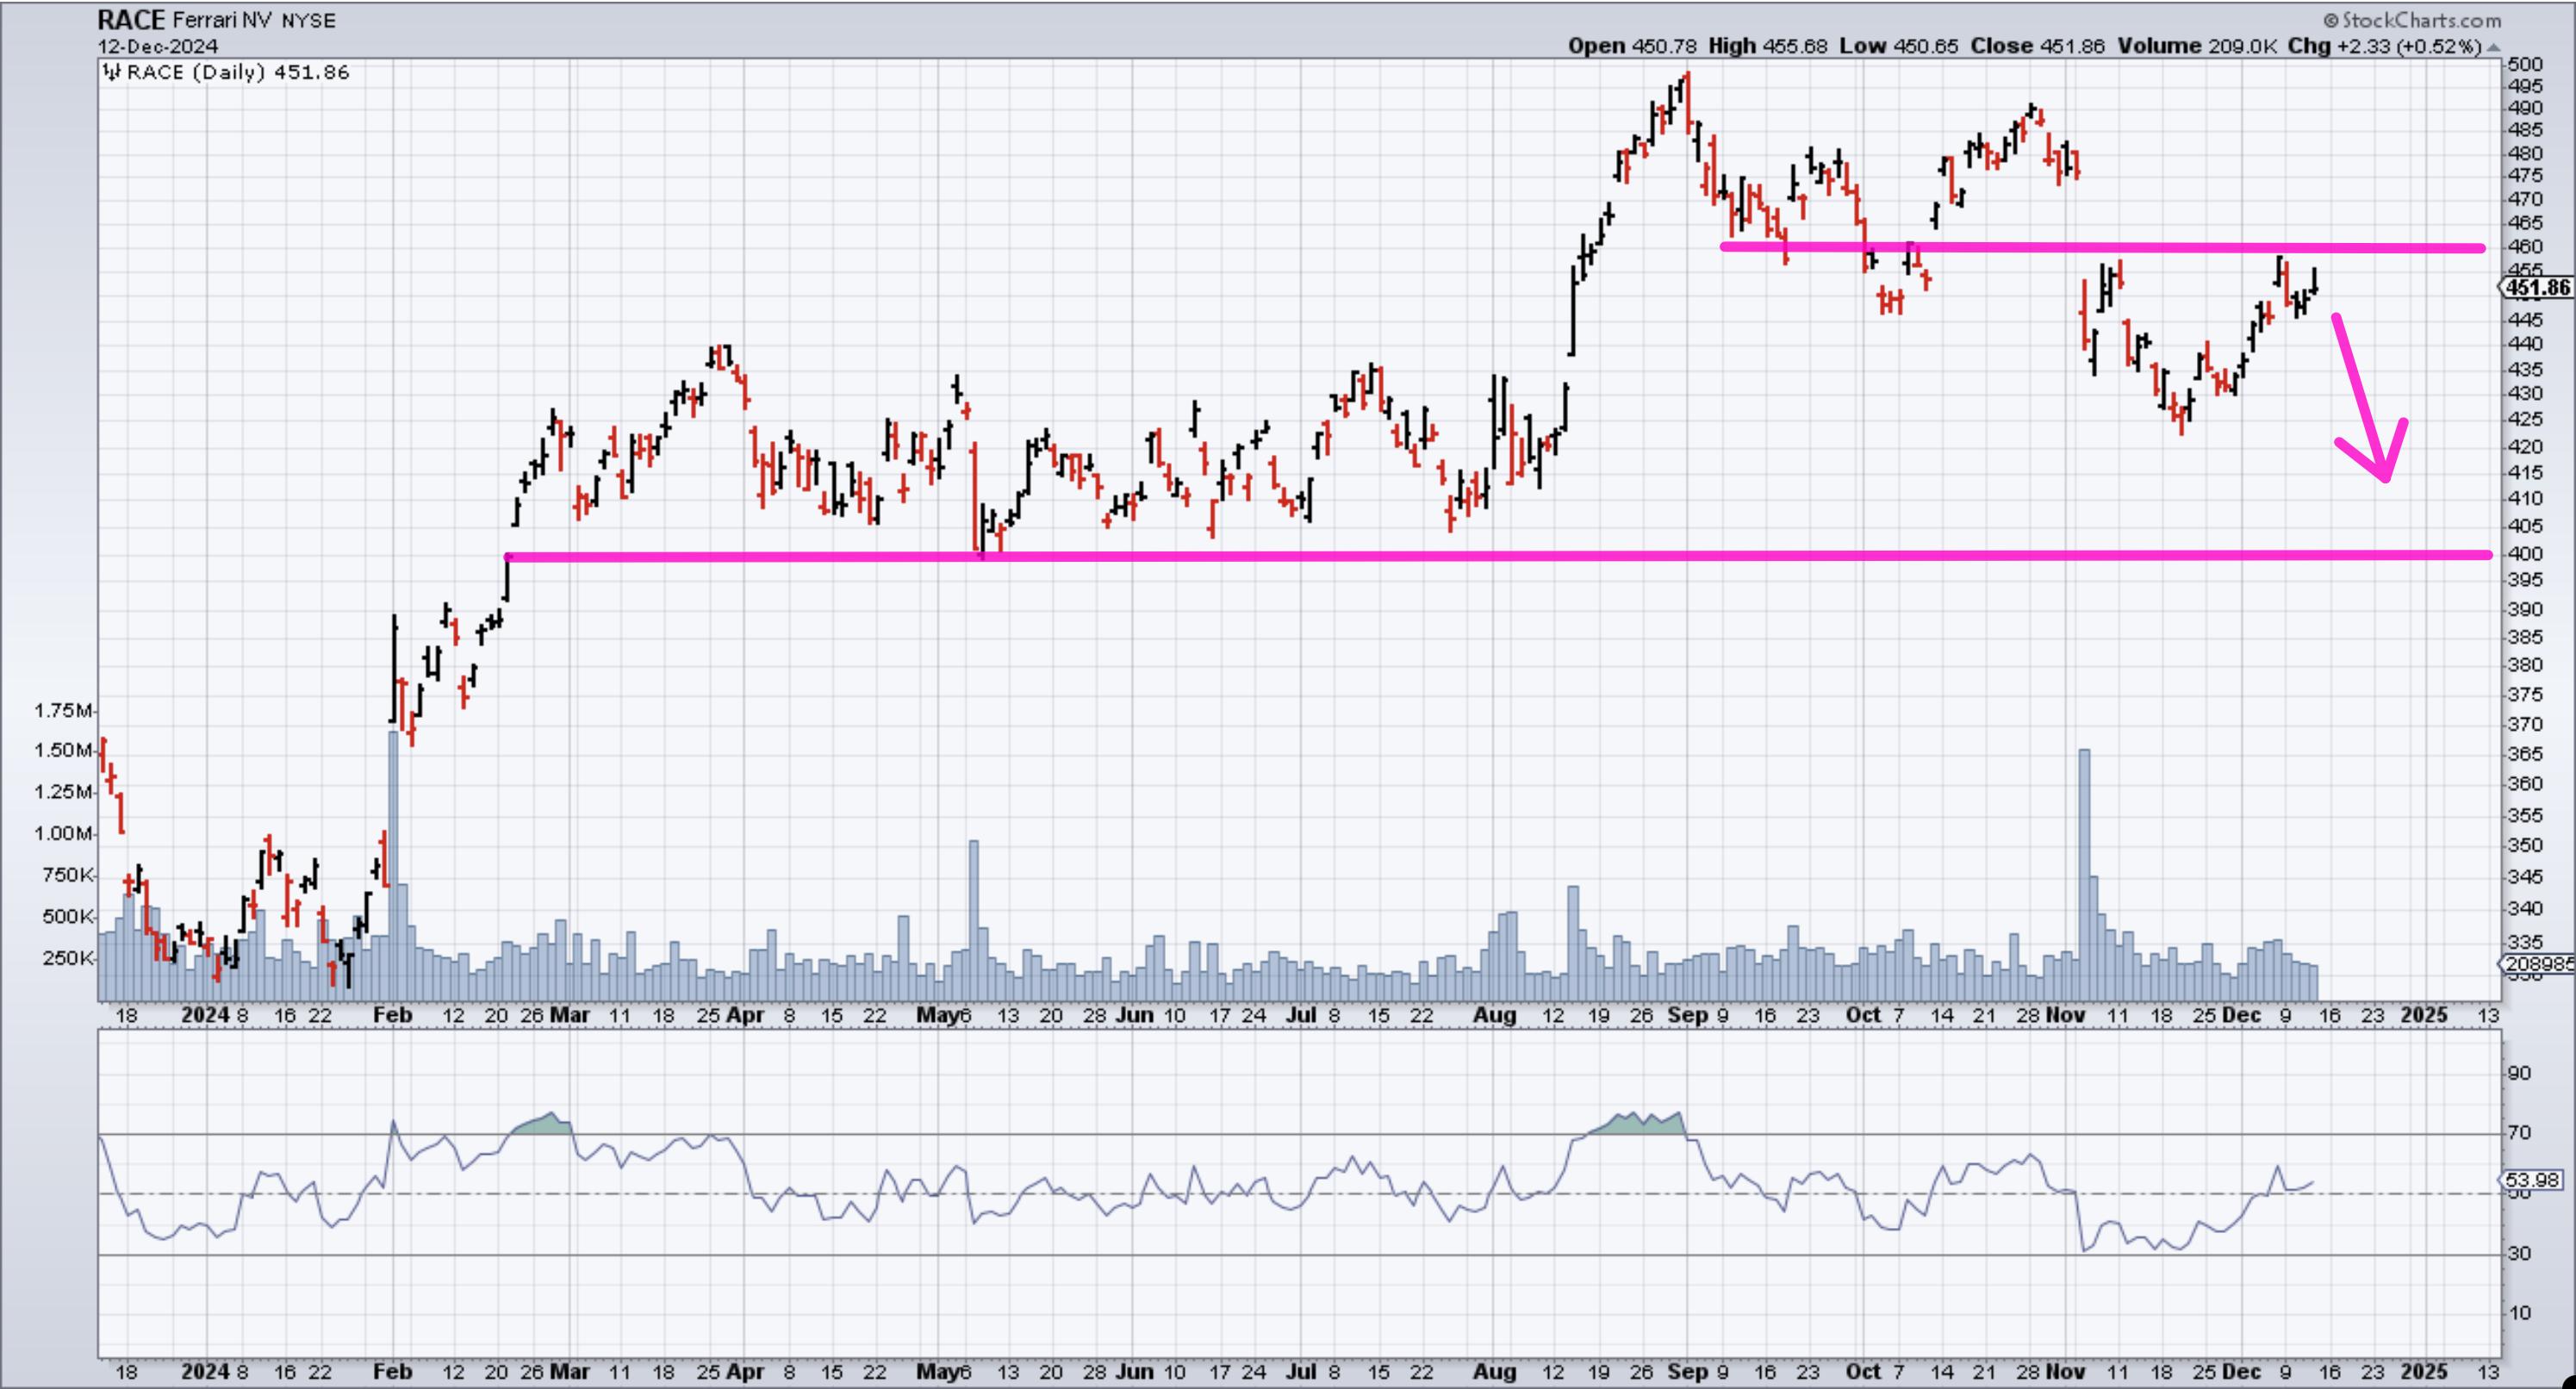
Pumping the Brakes on Ferrari (RACE)

by Tony Zhang,
Chief Strategist, OptionsPlay
Despite its position as a luxury automaker synonymous with prestige and performance, Ferrari N.V. (RACE) may be showing signs of a near-term downturn. Recent price action, coupled with stretched valuations and slowing shipment trends, suggests that RACE may face potential downside.
By incorporating both technical and fundamental analysis, we...
READ MORE
MEMBERS ONLY

Small Caps are Set to Skyrocket in 2025—Here's What You Need to Know

by Karl Montevirgen,
The StockCharts Insider
KEY TAKEAWAYS
* Small caps tend to outperform following an election year.
* In most annual cycles, small caps also have their seasonal tendencies.
* The chart of the iShares Russell 2000 ETF (IWM) is worth monitoring, especially as it approaches a buy point.
With an new administration inbound in Washington, D.C....
READ MORE
MEMBERS ONLY
Master the MACD Zero Line for a Trading Edge!
by Joe Rabil,
President, Rabil Stock Research
In this exclusive StockCharts video, Joe shows how to use the MACD zero line as a bias for a stock. As opposed to offering a buy signal, this Zero line level can provide insight into a market or stock's underlying condition; Joe shows how to refine that information...
READ MORE
MEMBERS ONLY
Unlock Options Trading Opportunities with StockCharts & OptionsPlay
by Tony Zhang,
Chief Strategist, OptionsPlay

by Grayson Roze,
Chief Strategist, StockCharts.com
Tony and Grayson are back with another informative video highlighting the opportunities the OptionsPlay add-on brings to the StockCharts platform. Tony highlights income generation ideas you can find with the add on. Together, the duo also cover the strategy center, and the SharpCharts and ACP widgets.
This video premiered on...
READ MORE
MEMBERS ONLY

Stock Market Sells Off Ahead of CPI: Charts You Should Be Watching
by Jayanthi Gopalakrishnan,
Director of Site Content, StockCharts.com
KEY TAKEAWAYS
* The S&P 500 and Nasdaq Composite are inching toward key support levels.
* Gold prices have risen on news of China's central bank's decision to buy gold.
* NVDA is under investigation for antitrust activities, and its stock price is declining.
The Tuesday afternoon...
READ MORE
MEMBERS ONLY

Several Intermarket Relationships Precariously Positioned for Stocks
by Martin Pring,
President, Pring Research
Chart 1 compares the S&P Composite with the NYSE A/D Line and its Common Stock counterpart. These, of course, are not intermarket relationships, but the chart does show that some near-term weakness would violate their bull market trendlines. Violating a trendline is not necessarily the end of...
READ MORE
MEMBERS ONLY
3 WAYS to Pinpoint When a Stocks Uptrend is Ending
by David Keller,
President and Chief Strategist, Sierra Alpha Research
In this video, Dave unveils his "line in the sand" technique to help determine when stocks in established uptrends may be near the end of the bullish phase. He'll share specific levels he's watching for the S&P 500, AMZN, TMUS, and KR,...
READ MORE
MEMBERS ONLY

Market As Good As It Gets
by Erin Swenlin,
Vice President, DecisionPoint.com
Today Carl looks at the 26 indexes, sectors and groups in a CandleGlance to see how the indexes stack up. It is clear that all of the indexes are as good as they can get. Carl warns that when things are as good as they can get, the only place...
READ MORE
MEMBERS ONLY

Week Ahead: Consolidation Likely as NIFTY Tests Crucial Levels; Guard Profits Mindfully
by Milan Vaishnav,
Founder and Technical Analyst, EquityResearch.asia and ChartWizard.ae
The markets closed with gains for the third week in a row, as key indices posting gains while extending their technical rebound. The Nifty trended higher most of the week. The volatility was largely absent, but the Indices stayed quite choppy on most days except the last, where it remained...
READ MORE
MEMBERS ONLY

The Stock Market's Simmering Rally: Indexes Keep Setting New Highs
by Jayanthi Gopalakrishnan,
Director of Site Content, StockCharts.com
KEY TAKEAWAYS
* The broader stock market indexes continue to notch new record highs.
* Risk appetite is strong as Bitcoin rises while Treasury yields and volatility retreat.
* Earnings from Oracle, Adobe, Broadcom, and Costco may move the stock market next week.
The first trading week in December started on a positive...
READ MORE
MEMBERS ONLY
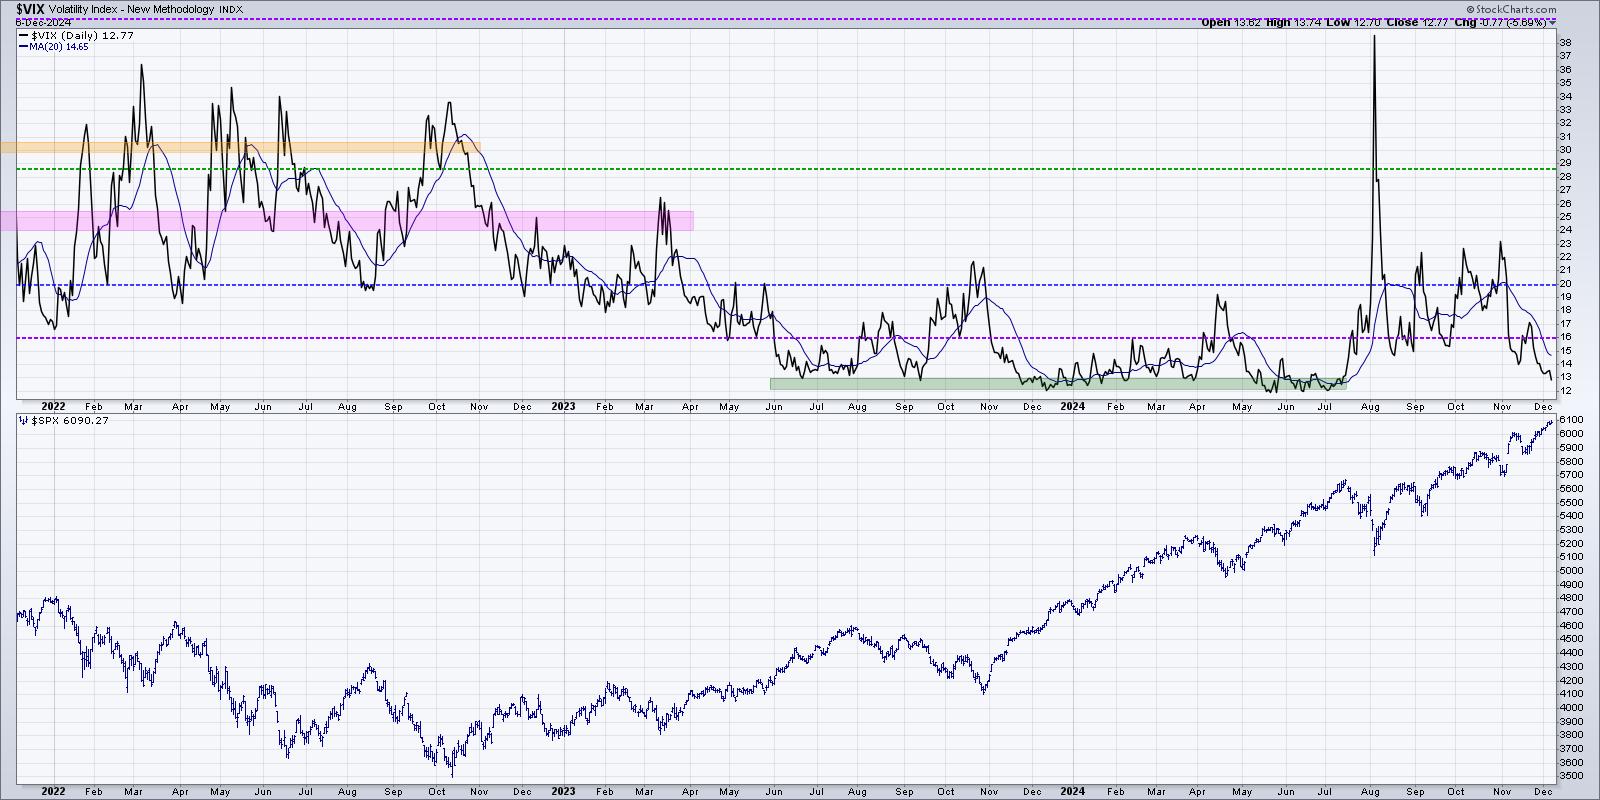
The Most Important Chart to Watch Into Year-End 2024
by David Keller,
President and Chief Strategist, Sierra Alpha Research
KEY TAKEAWAYS
* Low VIX reading implies that conditions are favorable for stocks.
* The MOVE index is basically a VIX for bonds, and can help to corroborate volatility readings across asset classes.
* High yield spreads remain quite narrow, implying bond investors perceive a low risk environment.
"The market goes up...
READ MORE
MEMBERS ONLY
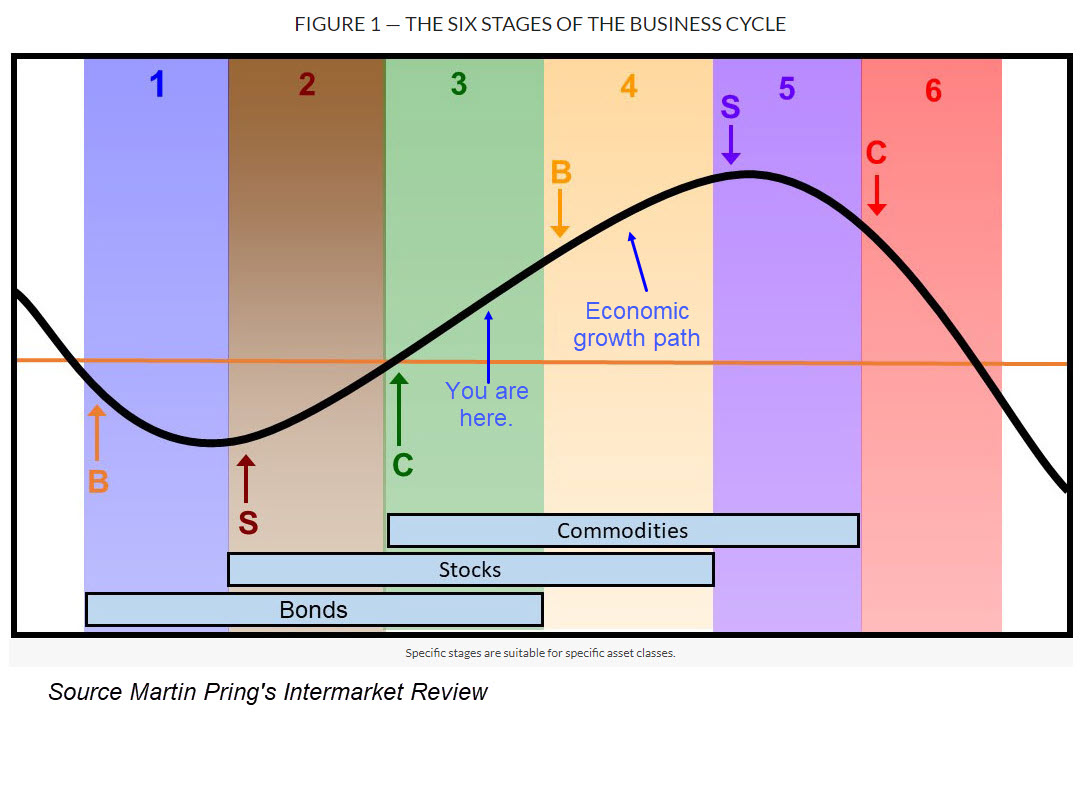
What the Economic Indicators are Saying About Stocks and Commodities
by Martin Pring,
President, Pring Research
You may not know it, but StockCharts' library of economic indicators has recently been enlarged. It's not as extensive as, say, the stock coverage, but it does include a lot of indicators that actually work, in the sense of helping identify major reversals in stock, bond, and...
READ MORE
MEMBERS ONLY
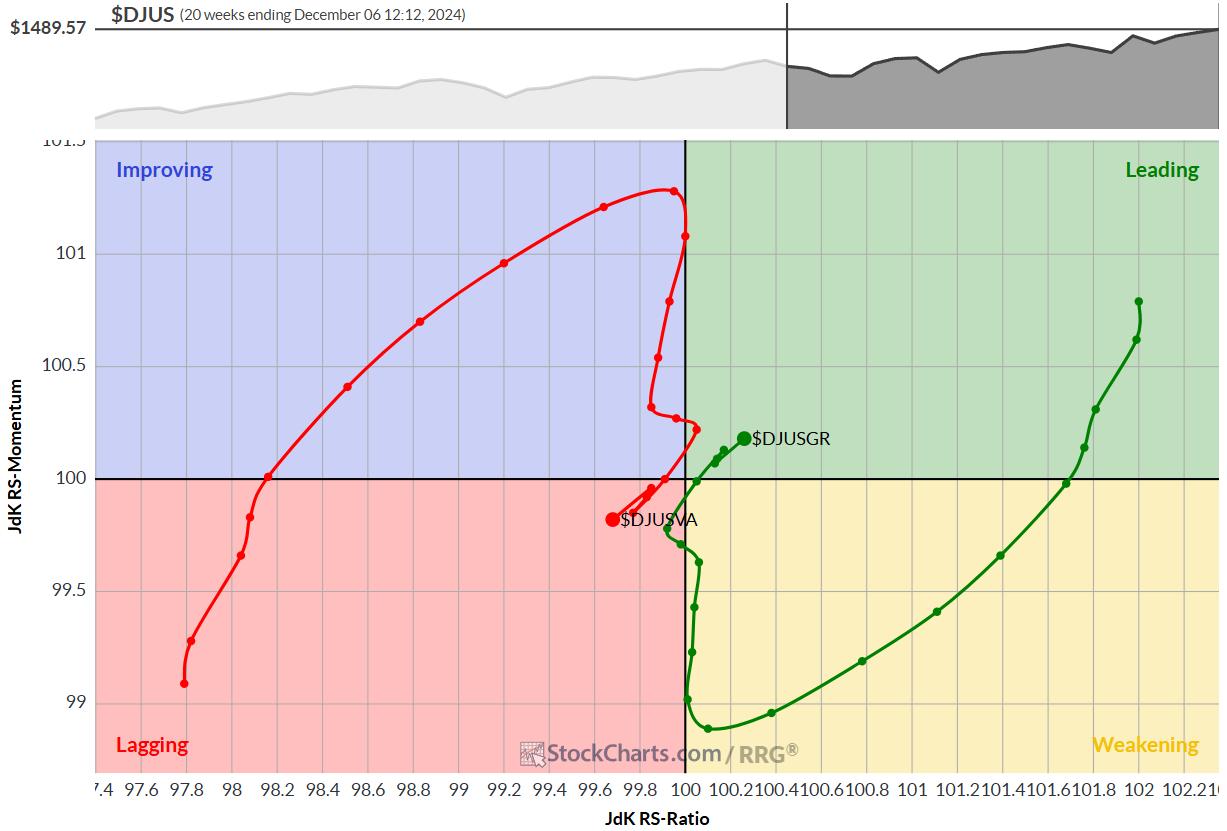
Stay Away from Large-Cap Value Stocks
by Julius de Kempenaer,
Senior Technical Analyst, StockCharts.com
KEY TAKEAWAYS
* Growth stocks are regaining leadership over value.
* Small and mid-cap growth sectors are leading the charge.
* Large-cap value is currently the weakest market segment.
Growth vs. Value Rotation: The Pendulum Swings Again
Relative Rotation Graphs (RRG) are not just good tools to use in analyzing sector rotation; they&...
READ MORE