MEMBERS ONLY

Sector Momentum Favors Defense; QQQ Yet To Break; Split NDX Breadth

by Arthur Hill,
Chief Technical Strategist, TrendInvestorPro.com
The stock market is clearly in defensive mode but QQQ is still holding up, and its long-term breadth still hasn't turned bearish. Arthur Hill's analysis identifies the key levels to watch....
READ MORE
MEMBERS ONLY
The S&P 500 Has a Big Problem — And It’s Not Commodities

by Julius de Kempenaer,
Senior Technical Analyst, StockCharts.com
Commodities remain strong, but the S&P 500 is facing pressure from weakening large-cap sectors. In this video, Julius de Kempenaer walks through asset classes, bond maturities, and sector rotation to explain why momentum is fading — and why 675 on SPY matters more than 700....
READ MORE
MEMBERS ONLY
RSI Divergences Can Signal Major Tops — But Only If Confirmed!

by David Keller,
President and Chief Strategist, Sierra Alpha Research
RSI divergences can warn of potential major tops, but only if confirmed by breakdown signals. David Keller walks through DG, GOOGL, AT&T, and the S&P 500 to show what must happen before a divergence becomes actionable....
READ MORE
MEMBERS ONLY

VIX Near 20: Is the Stock Market Entering the Danger Zone?
With several event catalysts now within the 30-day VIX window, it's time to ask: Does the market have a volatility problem? Mike Zaccardi breaks down the charts and assesses the danger....
READ MORE
MEMBERS ONLY
Sector Strength Is Building Even as the Market Stalls

by Joe Rabil,
President, Rabil Stock Research
Joe Rabil highlights improving sector strength and internal breadth, even as the broader market remains stuck in a range. He also reviews SPY conditions, volatility, sentiment, IWM relative strength, and select stock setups....
READ MORE
MEMBERS ONLY

StockCharts Insider: A Practical Guide to the Ichimoku Kijun-sen Pullback

by Karl Montevirgen,
The StockCharts Insider
Before We Dive In…
Ichimoku often gets dismissed for a number of reasons. Maybe it looks too complicated. Maybe it’s too slow. Not surprisingly, a lot of traders will fail with it when they go against its design and try to speed it up, "forcing" signals that...
READ MORE
MEMBERS ONLY
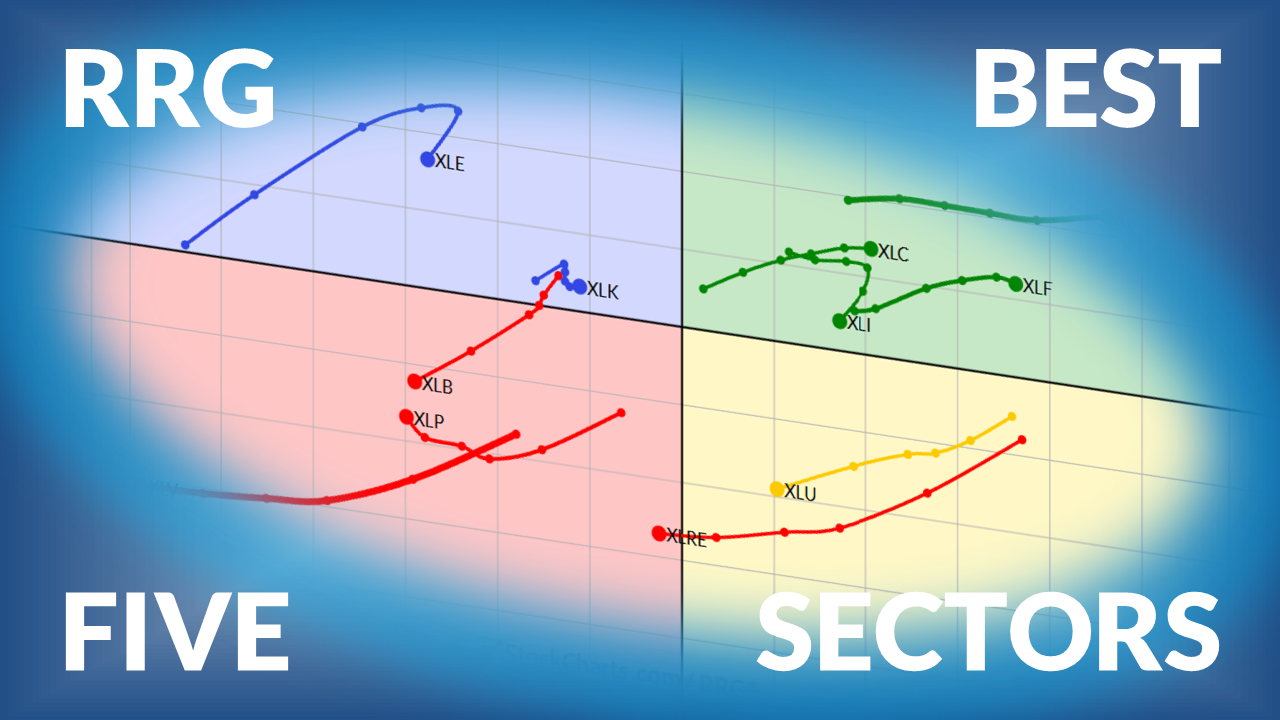
The Best Five Sectors This Week #53
by Julius de Kempenaer,
Senior Technical Analyst, StockCharts.com
Julius de Kempenaer presents his weekly update on sector rotation ranking using Relative Rotation Graphs....
READ MORE
MEMBERS ONLY

Week Ahead: Nifty Stares At A Major Medium-Term Support Zone; Avoid Aggressive Positioning

by Milan Vaishnav,
Founder and Technical Analyst, EquityResearch.asia and ChartWizard.ae
With India VIX rising sharply and the Nifty slipping below its 20-week moving average, what does this week hold for the Indian markets? Milan Vaishnav takes to the charts to analyze this question....
READ MORE
MEMBERS ONLY

AI Fears Introduce a New Wave of Market Volatility: Here’s How To Combat It

by Mary Ellen McGonagle,
President, MEM Investment Research
As the market experiences significant turbulence, Mary Ellen McGonagle talks ways to strategize beyond buy-and-hold. She also takes a look at EWJ in the wake of Japan's general election....
READ MORE
MEMBERS ONLY

Defensive Sectors Surge as Hindenburg Omen Flashes Warning
by David Keller,
President and Chief Strategist, Sierra Alpha Research
A confirmed Hindenburg Omen signal and renewed rotation into defensive sectors are raising caution flags for US equities. While the S&P 500 remains in a neutral range, Dave Keller, CMT, highlights key support levels and breadth signals investors should monitor closely....
READ MORE
MEMBERS ONLY
AI Fears Are Driving Rotation as Short Covering Is Fueling the Bounce!
by Mary Ellen McGonagle,
President, MEM Investment Research
Mary Ellen McGonagle breaks down how AI disruption fears are driving defensive rotation, along with how elevated short interest is fueling sharp short-covering bounces. She highlights what’s behind the volatility and what investors should watch for as positioning shifts intensify....
READ MORE
MEMBERS ONLY

Large-Cap Dominoes are Falling; XLF Joins the Fray; Money Moves into Utes and Bonds
by Arthur Hill,
Chief Technical Strategist, TrendInvestorPro.com
The large-cap tech universe is struggling; Arthur Hill analyzes how the weakness is spreading into the broader market and other sectors. Meanwhile, investors are moving money into bonds and utilities....
READ MORE
MEMBERS ONLY

Stock Market Bounce or Breakdown? These Charts Hold the Clues

by Jayanthi Gopalakrishnan,
Director of Site Content, StockCharts.com
The stock market is stalling at critical levels. Discover what the S&P 500, Nasdaq, and mrket breadth signals mean for investors....
READ MORE
MEMBERS ONLY

Semiconductors vs. Software: The Battle Driving This Market

by Tom Bowley,
Chief Market Strategist, EarningsBeats.com
Though the market remains range-bound, a growing split inside technology could decide the next move. Follow along as Tom Bowley breaks down the semiconductor breakout attempt, software weakness, and the key levels shaping this battle....
READ MORE
MEMBERS ONLY
These Breakout Setups Are Forming — Here’s What to Watch
by Joe Rabil,
President, Rabil Stock Research
Joe Rabil highlights breakout setups that are forming and explains what to watch for in a quality breakout entry. He also takes a look at SPY market conditions, volatility, sentiment, and Bitcoin’s technical outlook....
READ MORE
MEMBERS ONLY
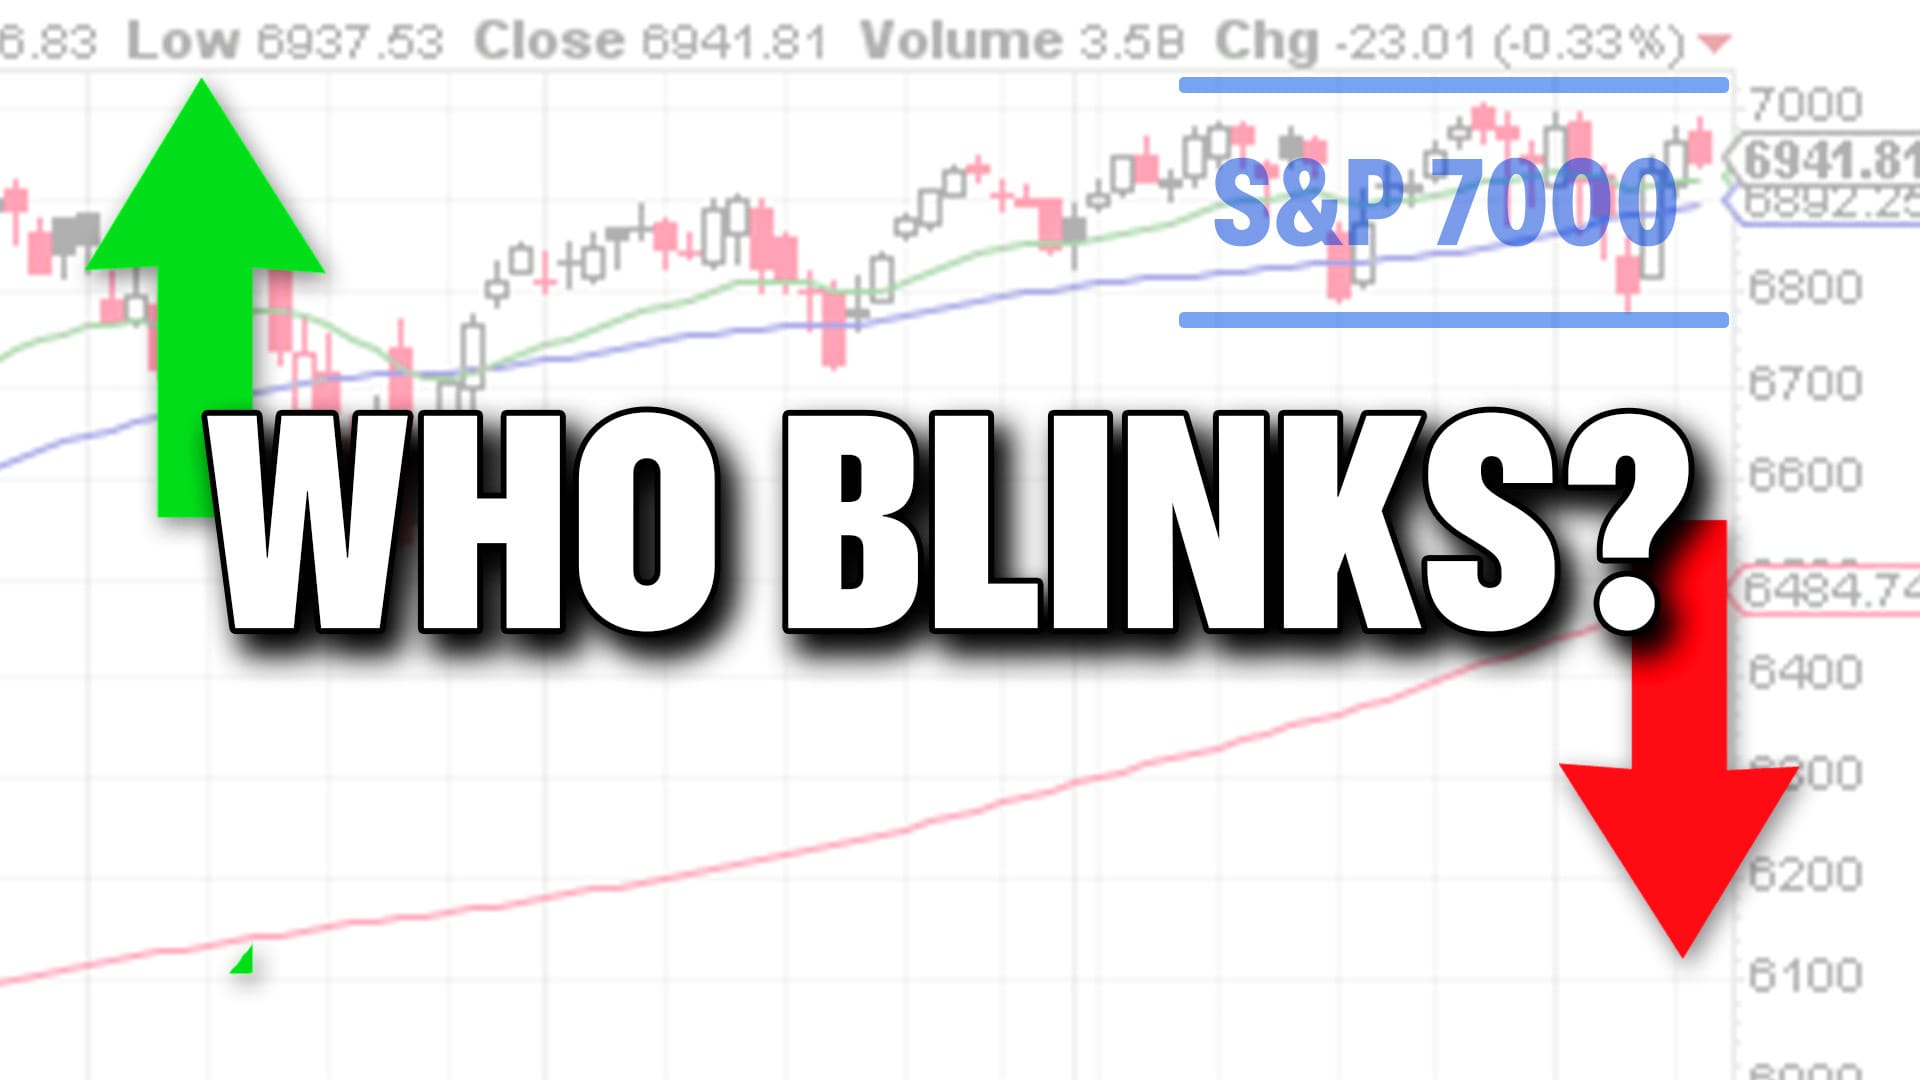
S&P 500 Can’t Clear 7000. Who Blinks First?

by Frank Cappelleri,
Founder & President, CappThesis, LLC
The S&P 500 keeps testing 7000, but follow-through has been elusive. Frank Cappelleri breaks down the breakout attempts, failed bearish signals, and internal strength that could determine who gives way first....
READ MORE
MEMBERS ONLY

This Sector Looks Ready to Break Out Big Time

by Martin Pring,
President, Pring Research
Martin takes a look at some important signs that suggest the Real Estate sector has reached the end of a corrective period and could be poised for a major breakout....
READ MORE
MEMBERS ONLY

Week Ahead: Nifty Near a Tactical Inflection Point
by Milan Vaishnav,
Founder and Technical Analyst, EquityResearch.asia and ChartWizard.ae
After a week of heightened volatility, the Nifty ended the week with gains and a positive broader trend. What will it take to reassert upside momentum -- or a correction?...
READ MORE
MEMBERS ONLY

AI Infrastructure Is Leading — Not the Headlines!
by Mary Ellen McGonagle,
President, MEM Investment Research
Mary Ellen McGonagle breaks down why AI infrastructure continues to lead even as headline tech stocks struggle with earnings volatility. She highlights where capital is flowing under the surface and why long-term demand themes are holding up against short-term noise....
READ MORE
MEMBERS ONLY

The Market Just Made a Powerful Shift: These Stocks Poised to Rise the Highest
by Mary Ellen McGonagle,
President, MEM Investment Research
With tech companies making significant increases in their AI capex, investment patterns could shift. How do you position your portfolio around this shift? These two stocks are likely to benefit from the increased AI investment. ...
READ MORE
MEMBERS ONLY

Dow Theory Confirmed: Technology Holds Critical Support
by Tom Bowley,
Chief Market Strategist, EarningsBeats.com
The Dow Jones Industrial Average and Dow Jones Transportation Average notched record closes, indicating that economic conditions are strong. Even the S&P 500 and XLK bounced off key support levels. Does this mean we're out of the woods? Find out here....
READ MORE
MEMBERS ONLY

Avoiding Confirmation Bias: Four Paths for the S&P 500 Into March
by David Keller,
President and Chief Strategist, Sierra Alpha Research
As volatility picks up, the S&P 500 sits in a crucial neutral zone. Dave Keller, CMT, uses probabilistic analysis to outline four possible paths for the index into late March—from a renewed bull run to a deeper correction—helping investors prepare for multiple outcomes....
READ MORE
MEMBERS ONLY

Bearish Reversal for QQEW, New Highs Surge as Low Vol Leads, Strength in EW Sectors
by Arthur Hill,
Chief Technical Strategist, TrendInvestorPro.com
Money is moving into stocks with relatively low volatility, most equal-weight sectors are up, and QQEW reversed its long-term uptrend. What does Arthur Hill make of this? Find out here....
READ MORE
MEMBERS ONLY

As Fear Rises, Cracks Are Forming Beneath the Market!
by Tom Bowley,
Chief Market Strategist, EarningsBeats.com
Markets are testing key support levels as volatility rises and growth stocks come under pressure. Tom Bowley breaks down the cracks forming beneath the surface and what they may signal in the weeks ahead....
READ MORE
MEMBERS ONLY
Sector Rotation Is Picking Up — Here’s What’s Improving
by Joe Rabil,
President, Rabil Stock Research
Joe Rabil highlights sector rotation and shows which sectors and industry groups are improving based on relative strength. He also reviews SPY market conditions, rising volatility, sentiment, and recent symbol requests like KO and DG....
READ MORE
MEMBERS ONLY

The Claude Crash: How AI Triggered a Historic Selloff in Software Stocks
With technology stocks, especially software, under selling pressures, is it time to write off these large-cap stocks? Mike Zaccardi talks what's working and what isn't....
READ MORE
MEMBERS ONLY

Equal Weight vs. Cap Weight: Why One Choice Changed the Outcome
by Julius de Kempenaer,
Senior Technical Analyst, StockCharts.com
Julius de Kempenaer breaks down a real-world portfolio experiment from 2025 that shows how weighting decisions can dramatically change performance. See how equal- and cap-weight approaches produced very different results and why it matters for portfolio construction today....
READ MORE
MEMBERS ONLY

Nifty Awaits Budget Trigger as Consolidation Narrows
by Milan Vaishnav,
Founder and Technical Analyst, EquityResearch.asia and ChartWizard.ae
With the Union Budget coming up, Milan Vaishnav analyzes the state of the Nifty ahead of the special session and what could be expected....
READ MORE
MEMBERS ONLY

Earnings Shocks Aren’t Ending This Trend!
by Mary Ellen McGonagle,
President, MEM Investment Research
Mary Ellen McGonagle breaks down how sharp earnings reactions are driving volatility without breaking the broader market trend. She explains why recent pullbacks have been more about profit-taking and expectations than a meaningful shift in trend....
READ MORE
MEMBERS ONLY

Risk Assets Are Under Siege; Beware!
by Tom Bowley,
Chief Market Strategist, EarningsBeats.com
These charts indicate the stock market is showing warning signs. Tom Bowley analyzes the price action in semiconductors, cryptocurrencies, rotation away from growth, and sentiment measures to make his case. ...
READ MORE
MEMBERS ONLY

7000 Is Historic — But the REAL Story Is What’s Improving Underneath!
by Tom Bowley,
Chief Market Strategist, EarningsBeats.com
The S&P 500 reached 7000 for the first time ever, but the bigger story is happening below the surface. Tom Bowley breaks down what’s improving in market leadership, sector rotation, and early earnings reactions as the next phase of earnings season unfolds....
READ MORE
MEMBERS ONLY

Tech Takes the Lead Again, but Market Breadth Raises Questions
by Jayanthi Gopalakrishnan,
Director of Site Content, StockCharts.com
The Nasdaq leads with tech and semis, but weakening breadth raises questions. Learn which indicators and support levels to watch next....
READ MORE
MEMBERS ONLY

The Dollar Yo-Yo: What a Weak USD and Currency Wars Mean for Investors
As the U.S. dollar weakens, price action, not macro narratives, reveals shifting leadership across sectors and global markets....
READ MORE
MEMBERS ONLY
These Low ADX and Price Patterns Could Lead to the Next Breakouts!
by Joe Rabil,
President, Rabil Stock Research
Joe Rabil of Rabil Stock Research breaks down how low ADX and price patterns can signal emerging breakout setups. He also reviews SPY market conditions, rising bullish sentiment, and some recent symbol requests....
READ MORE
MEMBERS ONLY
Tech Leadership Is Rotating. What’s Working Right Now?
by Frank Cappelleri,
Founder & President, CappThesis, LLC
Frank Cappelleri analyzes how leadership within tech is starting to rotate, with some areas holding breakouts while others struggle. Discover which parts of large-cap tech are still working and what patterns investors should be watching....
READ MORE
MEMBERS ONLY
Failed Breakouts: How to Spot Them, Manage Risk, and Stay with Strong Charts
by David Keller,
President and Chief Strategist, Sierra Alpha Research
Markets are feeling uncertain as earnings season unfolds and the Fed meeting approaches, yet overall trends remain surprisingly strong. This week, Dave Keller explores the concept of failed breakouts and why managing risk is just as important as identifying new opportunities....
READ MORE