MEMBERS ONLY

China Stimulus Energizes Stocks, Commodities; Will The Energy Sink?

by Jayanthi Gopalakrishnan,
Director of Site Content, StockCharts.com
KEY TAKEAWAYS
* Stocks, commodities, and crypto prices soared after China announced its stimulus package, but pulled back slightly after the news.
* Metal prices are still holding strong while oil prices pulled back.
* Escalating geopolitical tensions don't seem to be impacting the stock market much at the moment.
Tuesday&...
READ MORE
MEMBERS ONLY

How to Use the ADX Indicator (Trend Strength Explained)

by Joe Rabil,
President, Rabil Stock Research
In this exclusive StockCharts TV video, Joe presents an introduction to the Average Directional Index (ADX), sharing how it is calculated and how to use it. He highlights some of the strengths, and weaknesses, of this powerful indicator. He then analyzes Bitcoin, NVDA, and AVGO, and finishes up the show...
READ MORE
MEMBERS ONLY

Why the Stock Market is SO Confusing Right Now

by Julius de Kempenaer,
Senior Technical Analyst, StockCharts.com
In this video from StockCharts TV,Julius assesses current rotations in asset classes and US sectors using Relative Rotation Graphs, finding a lot of contradictory behavior. Taking a step back, he focuses on the weekly timeframe to find some more meaningful trends and shy away from day-to-day noise. He then...
READ MORE
MEMBERS ONLY

The Dollar Index is Down, But Is It Out?

by Martin Pring,
President, Pring Research
The Dollar Index has been selling off sharply in the last few weeks and has now reached critical support in the form of the lower part of its recent trading range. The big question is whether it will break below the range or extend it in any way.
Chart 1...
READ MORE
MEMBERS ONLY

DP Trading Room: Analyzing Two New Stocks in SP500 (DELL, PLTR)

by Erin Swenlin,
Vice President, DecisionPoint.com
In today's free DP Trading Room Carl reviews the charts of two new members to the SP500, Dell (DELL) and Palantir (PLTR). Are they poised to break out on this news?
Carl also discussed the inflation on housing prices to open the show. Before going over the signal...
READ MORE
MEMBERS ONLY

Bullish or Bearish? The Truth About Rate Cuts and Stock Performance

by David Keller,
President and Chief Strategist, Sierra Alpha Research
So the first Fed rate cut is behind us, and we are no longer in a "higher for longer" period, but in a new rate cut cycle which will most likely last well into 2025. So that's good news for stocks, right? Well, not necessarily.
The...
READ MORE
MEMBERS ONLY

Strategy After Rate Cuts: Best Areas to BUY!

by Mary Ellen McGonagle,
President, MEM Investment Research
In this StockCharts TV video, Mary Ellen reviews the broader markets after last week's rate-cut induced rally. She also shares stocks that are breaking out of bases and poised to trade higher. The "nuclear renaissance" is also discussed, as well as stocks that will benefit the...
READ MORE
MEMBERS ONLY

Dow Jones in the Spotlight, Bonds Stabilize, Tech Plays Catch-Up
by Jayanthi Gopalakrishnan,
Director of Site Content, StockCharts.com
KEY TAKEAWAYS
* The Dow Jones Industrial Average closed at a new all-time high.
* Stock market indexes still have bullish momentum in spite of up and down movement.
* Bond prices could stabilize after digesting the interest rate cut.
The Federal Reserve's interest rate cut decision on Wednesdaywas like receiving...
READ MORE
MEMBERS ONLY

A Sector Rotation Dilemma ...
by Julius de Kempenaer,
Senior Technical Analyst, StockCharts.com
KEY TAKEAWAYS
* Sector Rotation remains defensive
* S&P chart showing resemblence to late 2021
* Negative divergences still in play
First of all, I apologize for my absence this week. I caught something that looked like Covid, and felt like Covid, but it did not identify (pun intended) as Covid....
READ MORE
MEMBERS ONLY

This S&P 500 Rally is Defying the Experts – Here's What You Need to Know

by Karl Montevirgen,
The StockCharts Insider
KEY TAKEAWAYS
* Wells Fargo analysts issued a warning about the current rally.
* Their last warning in November 2023 may have caused many investors to have missed out on a huge move.
* Analysts can be right or wrong, so it's important to watch key technical levels.
If you logged...
READ MORE
MEMBERS ONLY

The Fed Cut Discount Rate | Larry's "Family Gathering" September 19, 2024 Recording

by Larry Williams,
Veteran Investor and Author
Interest rates have been cut -- what now? Larry presents his thoughts in this edition of the Family Gathering video.
In this month's Family Gathering video, Larry begins with what he calls the "Fed Cut Discount Rate" and what it means. What does history make of...
READ MORE
MEMBERS ONLY

"Family Gathering" Meeting Today at 2 PM Eastern
Today, Larry Williams will be hosting a "Family Gathering" meeting at 2pm Eastern Daylight Time (11am Pacific). Sign-in in begins 5 minutes prior. The show, which will include both a presentation from Larry and a viewer Q&A session, will be recorded and posted online for those...
READ MORE
MEMBERS ONLY

Stock Market Today: Fed Cuts Rates and Market Makes Last Minute U-Turn
by Jayanthi Gopalakrishnan,
Director of Site Content, StockCharts.com
KEY TAKEAWAYS
* The Fed cut interest rates by 50 basis points and shifts focus to the economy.
* Stock market rallied after the Fed's interest rate cut decision but closed lower.
* Treasury yields rose while bond prices fell.
The stock market received what it expected from the Federal Reserve—...
READ MORE
MEMBERS ONLY

The Secret to Perfecting SPY Entry Points? RSI!
by Joe Rabil,
President, Rabil Stock Research
In this exclusive StockCharts TV video, Joe shows how to use RSI in multiple timeframes to identify the next buying opportunity in the SPY. Joe thinks this rally is important; he uses the ADX to distinguish between the strength in different indices. Joe demonstrates how he moves quickly around ACP,...
READ MORE
MEMBERS ONLY

Investors Hesitant Ahead of Fed Meeting: How to Prepare
by Jayanthi Gopalakrishnan,
Director of Site Content, StockCharts.com
KEY TAKEAWAYS
* Broader stock market indexes went above resistance levels, but retreated by the close.
* Small-cap stocks took the lead in Tuesday's trading.
* The Fed's decision on interest rates could make for a volatile trading day.
The broader stock market indexes are still in a holding...
READ MORE
MEMBERS ONLY

DP Trading Room: Tracking Gold Sentiment
by Erin Swenlin,
Vice President, DecisionPoint.com
As part of Carl's review of Gold charts, he explained how we use the close-ended fund, Sprott Physical Gold Trust (PHYS) to measure sentiment for Gold. Depending on how PHYS trades, it trades at a discount or premium based on the physical Gold that it holds. These discounts...
READ MORE
MEMBERS ONLY

These Stocks are Just Beginning Their Move Higher!
by Mary Ellen McGonagle,
President, MEM Investment Research
In this StockCharts TV video, Mary Ellen reviews the broader markets and highlights pockets of strength that are starting to trend higher. She also shares add-on plays to the move into home construction stocks, and shows key characteristics needed to confirm a downtrend reversal in select stocks.
This video originally...
READ MORE
MEMBERS ONLY
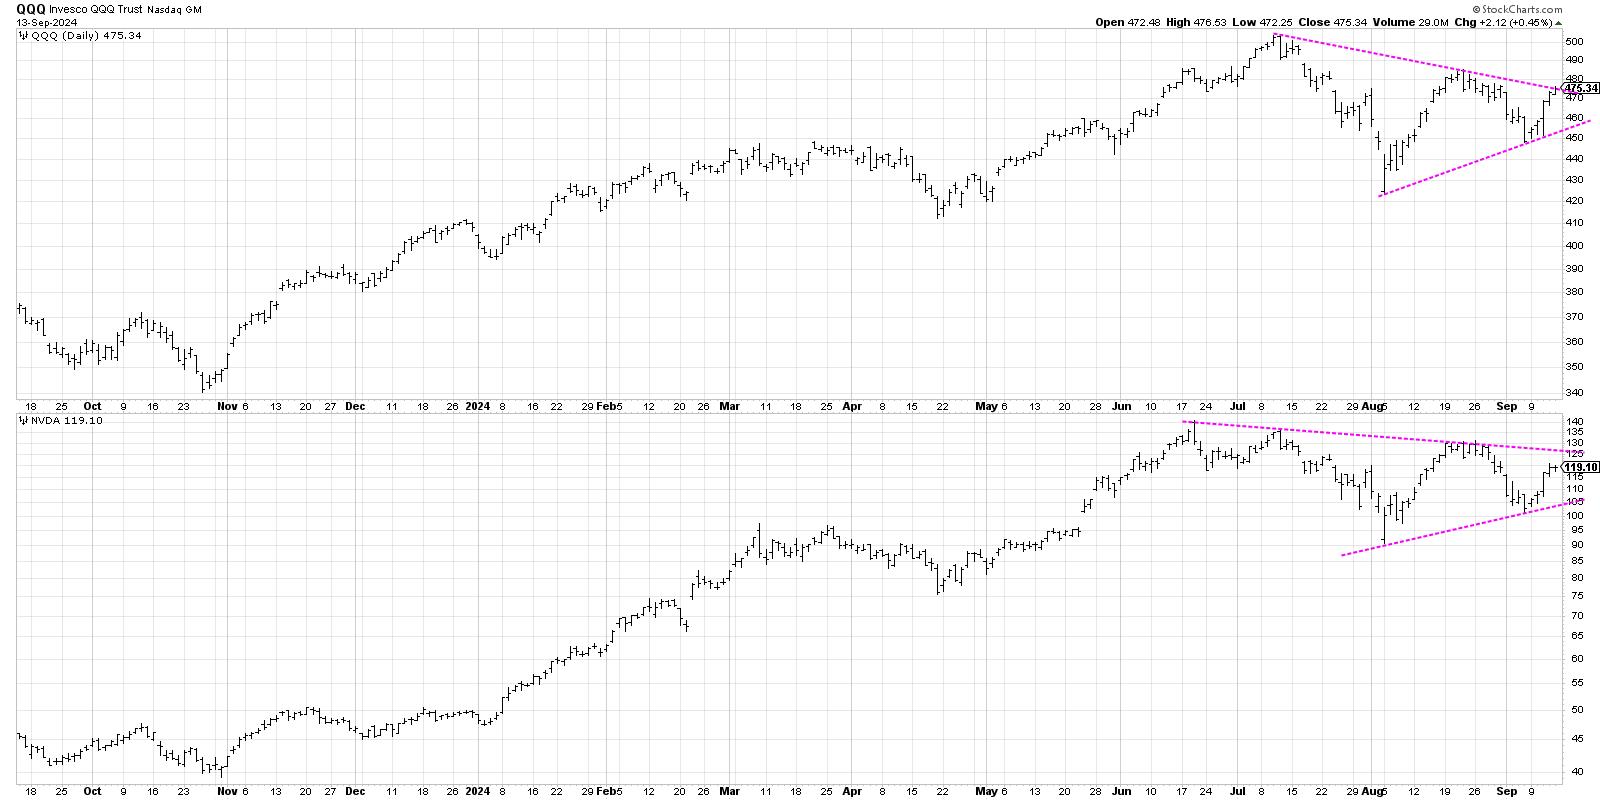
Here's My Most-Likely Scenario for QQQ
by David Keller,
President and Chief Strategist, Sierra Alpha Research
While the S&P 500 finished the week once again testing new all-time highs around 5650, the Nasdaq 100 remains rangebound in a symmetrical triangle or "coil" pattern. While this pattern does not necessarily suggest a potential next move for the QQQ, it did lead me to...
READ MORE
MEMBERS ONLY

A Half Point Fed Rate Cut? The Stock Market Thinks So
by Jayanthi Gopalakrishnan,
Director of Site Content, StockCharts.com
KEY TAKEAWAYS
* Stocks make a strong recovery after last week's selloff.
* Large-, mid-, and small-cap stocks closed higher, with small caps the clear leader.
* Gold and silver prices surged on interest rate cut expectations.
This week's stock market action may have caught many investors by surprise....
READ MORE
MEMBERS ONLY

Larry's LIVE "Family Gathering" Webinar Airs NEXT WEEK - Thursday, September 19 at 2 PM EDT!
Larry is going LIVE! Don't miss the upcoming "Family Gathering" webinar with Larry Williams, airing live through Zoom on Thursday, September 19 at 2:00pm Eastern Daylight Time.
In this must-see event, Larry will be presenting his current opinions on a broad variety of current market...
READ MORE
MEMBERS ONLY

A Déjà Vu in The Consumer Staples Sector Sends a Strong Warning Signal
by Julius de Kempenaer,
Senior Technical Analyst, StockCharts.com
KEY TAKEAWAYS
* Tech bounce is judged as recovery within downtrend.
* XLP, XLF, and XLV are positioned for outperformance in coming weeks.
* The XLP chart is showing interesting characteristics which we have seen before
Tech Rallies, But Remains Inside the Lagging Quadrant
A quick look at the Relative Rotation Graph for...
READ MORE
MEMBERS ONLY
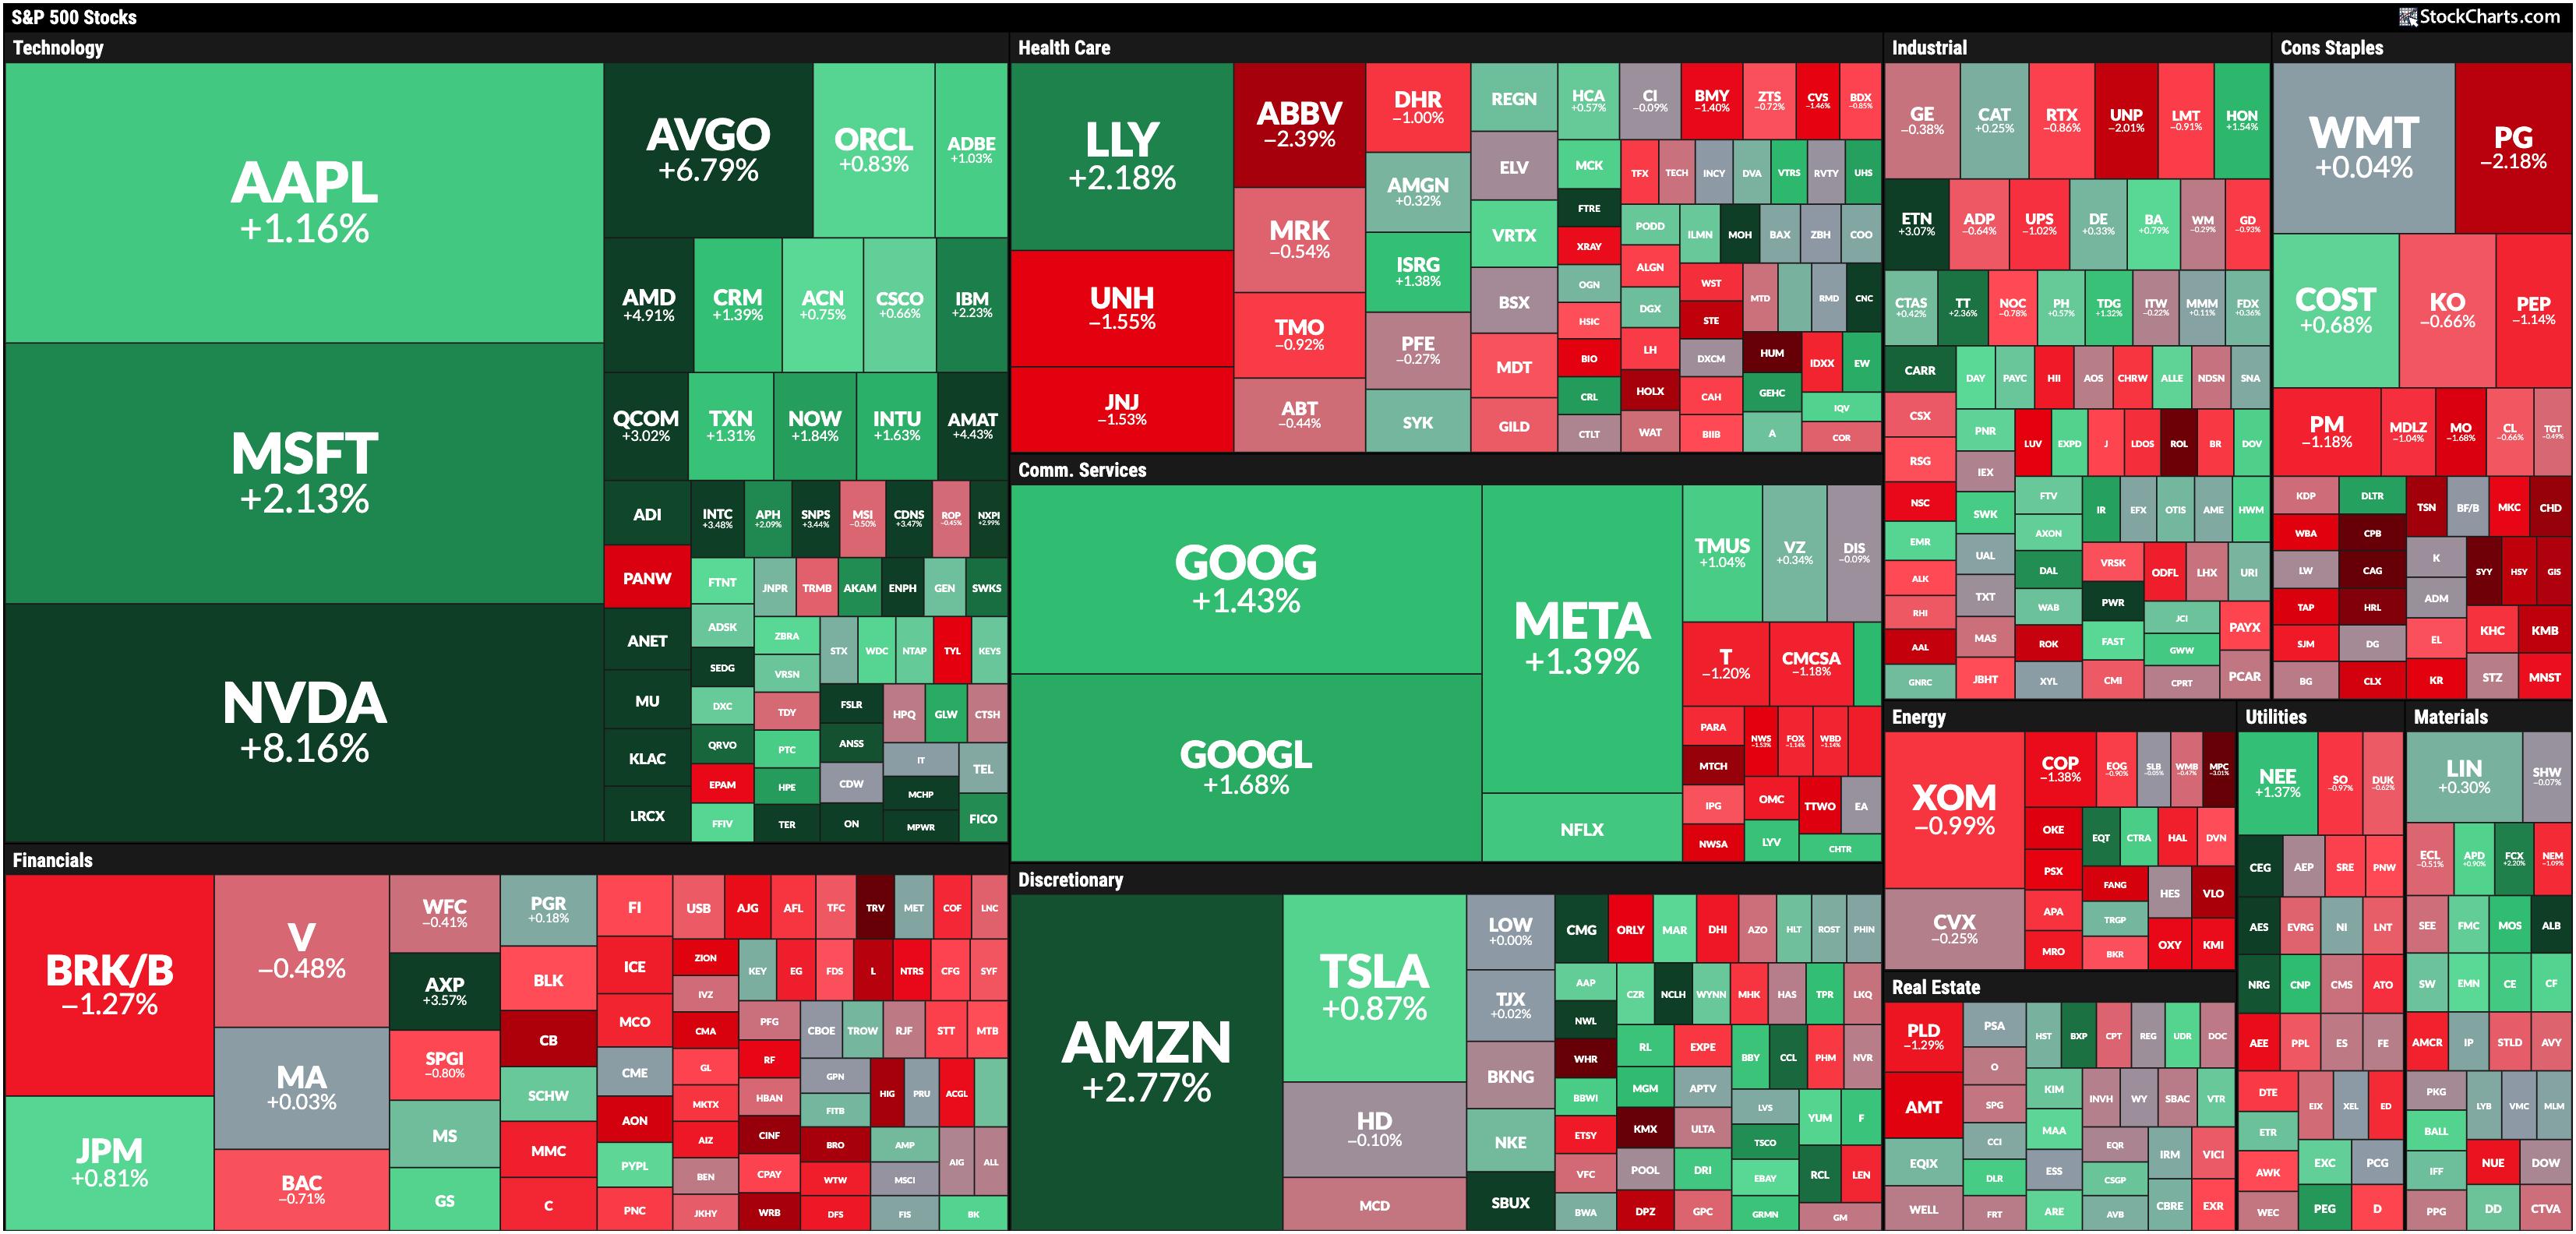
Stock Market Today: Are Big Tech Growth Stocks Back in the Spotlight?
by Jayanthi Gopalakrishnan,
Director of Site Content, StockCharts.com
KEY TAKEAWAYS
* Stocks rebounded on Wednesday with wide trading ranges.
* Investors are rotating back into large-cap growth and momentum stocks.
* The Financial sector was hit hard by negative news from banks but made some recovery.
It was a massive turnaround day in the market on Wednesday—stocks sold off after...
READ MORE
MEMBERS ONLY

Pinpoint Strong Sectors BEFORE The Masses Notice
by Joe Rabil,
President, Rabil Stock Research
In this exclusive StockCharts TV video, Joe discusses why he is a bottom-up technical analyst. He explains the difference between top-down and bottom-up analysis and uses this to show the strongest sectors rotating to the upside right now; this approach will help give advance notice of which areas to focus...
READ MORE
MEMBERS ONLY

Why Stock Outperformance Might be ENDING!
by Julius de Kempenaer,
Senior Technical Analyst, StockCharts.com
In this video from StockCharts TV,Julius takes a look at rotations in an asset allocation RRG. He compares fixed-income-related asset classes, commodities, the US dollar, Bitcoin and stocks to a balanced portfolio of 60% stocks/40% bonds. The long-lasting outperformance of stocks seems to be coming to an end....
READ MORE
MEMBERS ONLY
Stock Market Today: Real Estate and Tech Lead, Energy Down
by Jayanthi Gopalakrishnan,
Director of Site Content, StockCharts.com
KEY TAKEAWAYS
* The real estate sector gains ground as interest rate cuts loom.
* Technology stocks are showing slight gains, but not enough to shift momentum.
* Energy prices slide lower on weakened demand.
The Real Estate sector took the lead in Tuesday's trading, probably because interest rate cuts are...
READ MORE
MEMBERS ONLY

DP Trading Room: AI Bubble Deflating
by Erin Swenlin,
Vice President, DecisionPoint.com
The recent decline last week revealed that the artificial intelligence bubble is deflating. Magnificent Seven stocks are unwinding in response to investors losing confidence in the AI trade in general. Carl gives us a complete picture of the Magnificent Seven in the short and intermediate terms. It doesn't...
READ MORE
MEMBERS ONLY

Market Timing for a Rules-Based Strategy

by Arthur Hill,
Chief Technical Strategist, TrendInvestorPro.com
KEY TAKEAWAYS
* Chartists need a market timing mechanism to assess risk
* Risk is above average during bear markets (preserve capital)
* Risk levels are acceptable during bull markets (invest capital)
Any strategy that trades stocks needs some sort of market timing mechanism to identify bull and bear markets. Typically, stock strategies...
READ MORE
MEMBERS ONLY

Four Intermarket Confidence Relationships that Aren't Confident
by Martin Pring,
President, Pring Research
Most of the primary trend indicators I follow are in a bullish mode and show few signs of flagging. That said, some intermarket relationships, which help to indicate whether the environment is risk-off or risk-on, have started to move in a risk-off direction. That's usually a bearish omen...
READ MORE
MEMBERS ONLY
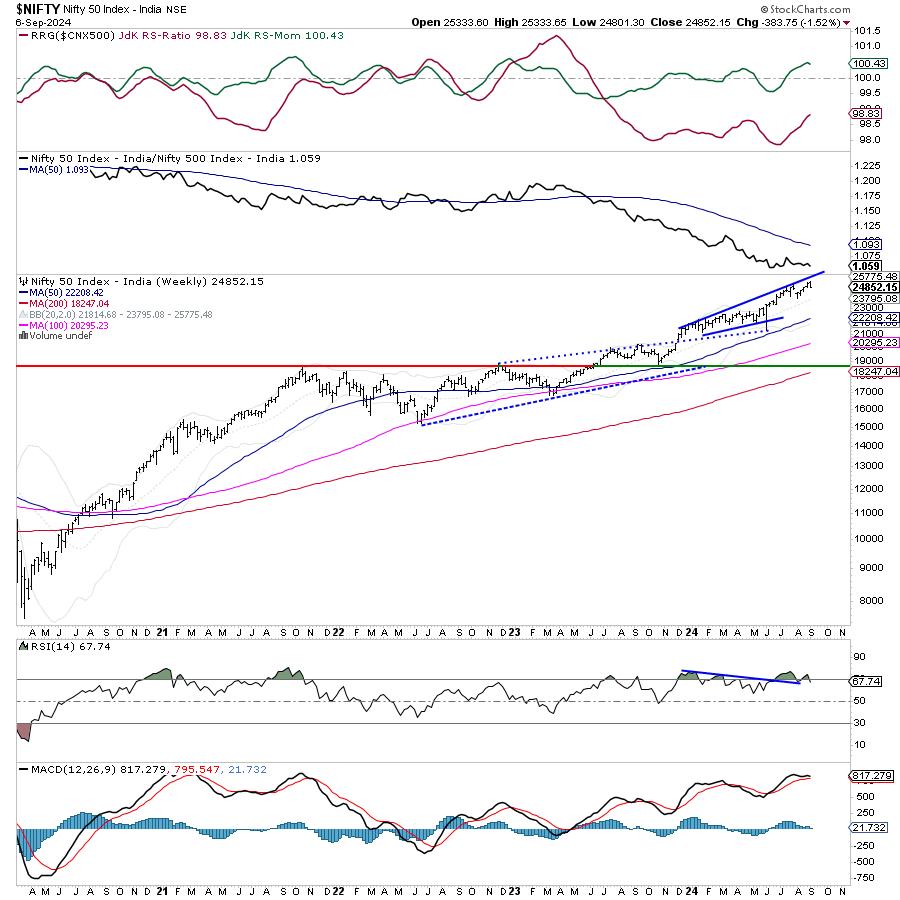
Week Ahead: NIFTY Shows Early Signs of a Likely Disruption of Uptrend; Tread Cautiously

by Milan Vaishnav,
Founder and Technical Analyst, EquityResearch.asia and ChartWizard.ae
After initially forming a fresh incremental lifetime high, the markets succumbed to selling pressure from higher levels after spending some indecisive sessions during the week. The week that went by saw some early signs of the Nifty entering into broad corrective consolidation while ending near its low point of the...
READ MORE
MEMBERS ONLY
Markets Nosedive Amid Recession Fears
by Mary Ellen McGonagle,
President, MEM Investment Research
In this StockCharts TV video, Mary Ellen reviews the current downtrend taking place in the S&P 500 and Nasdaq, and highlights the "uninverting" yield curve. She finishes with a deep dive into Nvidia, sharing how to handle the stock depending on your investment horizon.
This video...
READ MORE
MEMBERS ONLY
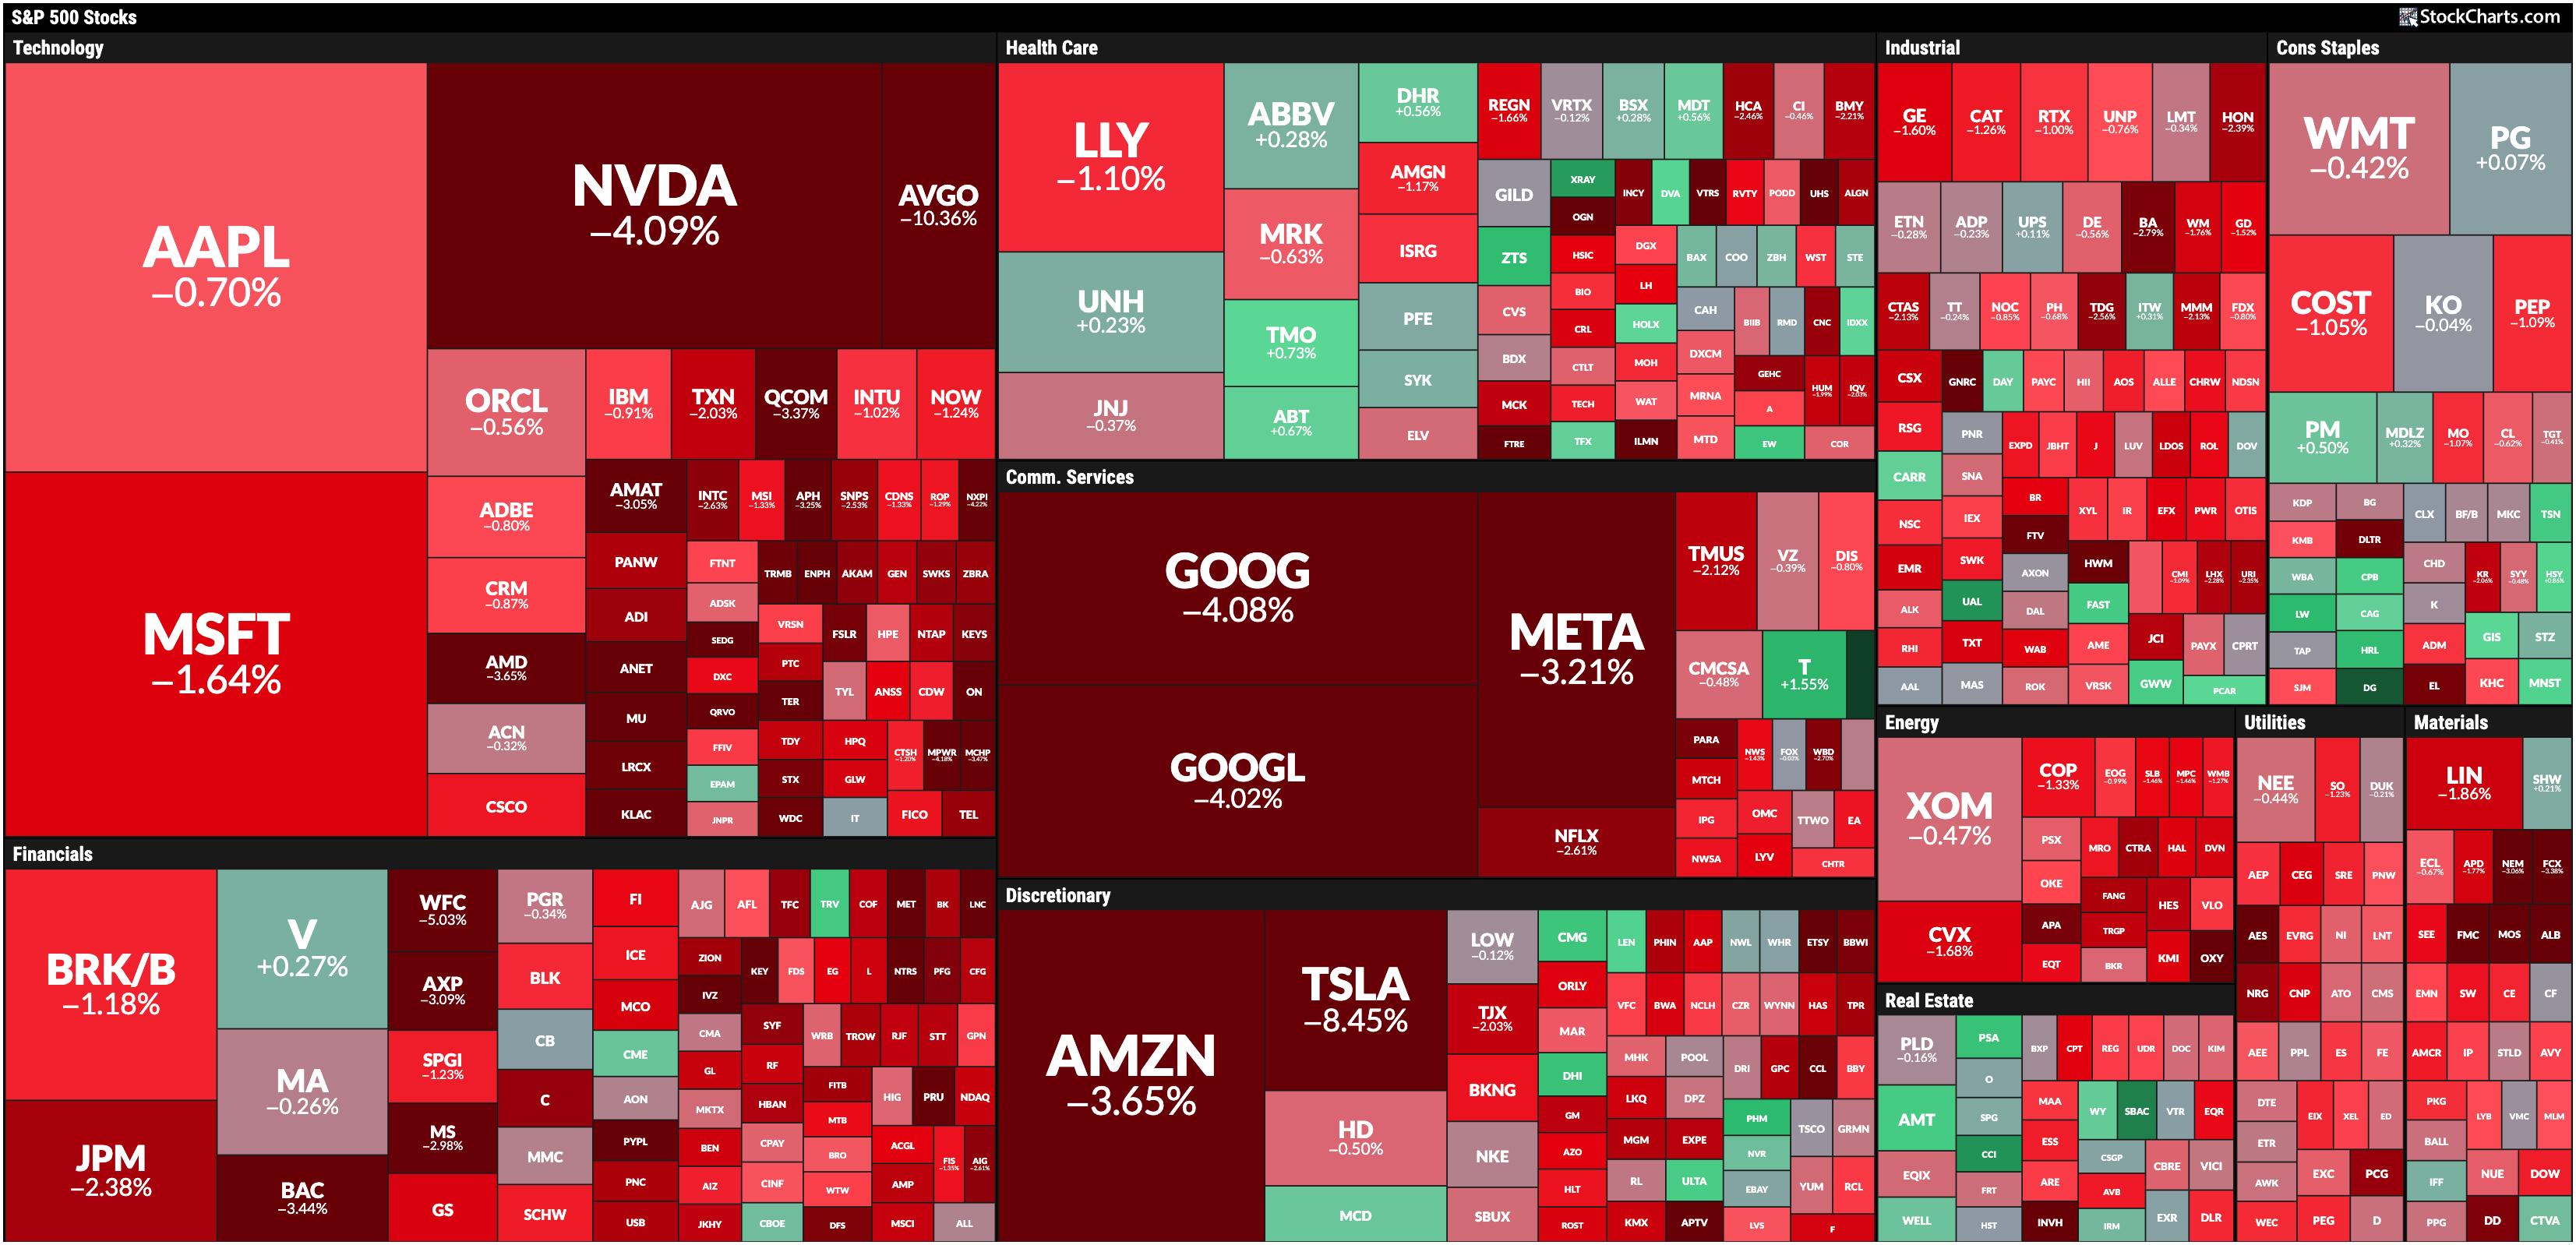
Broad-Based Stock Market Selloff: How to Position Your Portfolio?
by Jayanthi Gopalakrishnan,
Director of Site Content, StockCharts.com
KEY TAKEAWAYS
* Broader stock market indexes sell off as investors fear rate cuts may be too late.
* Treasury yields fell to their lowest yearly levels.
* Big Tech stocks got hammered, with semiconductor stocks getting hit the hardest.
After a week of wavering action, the stock market made a directional move—...
READ MORE
MEMBERS ONLY
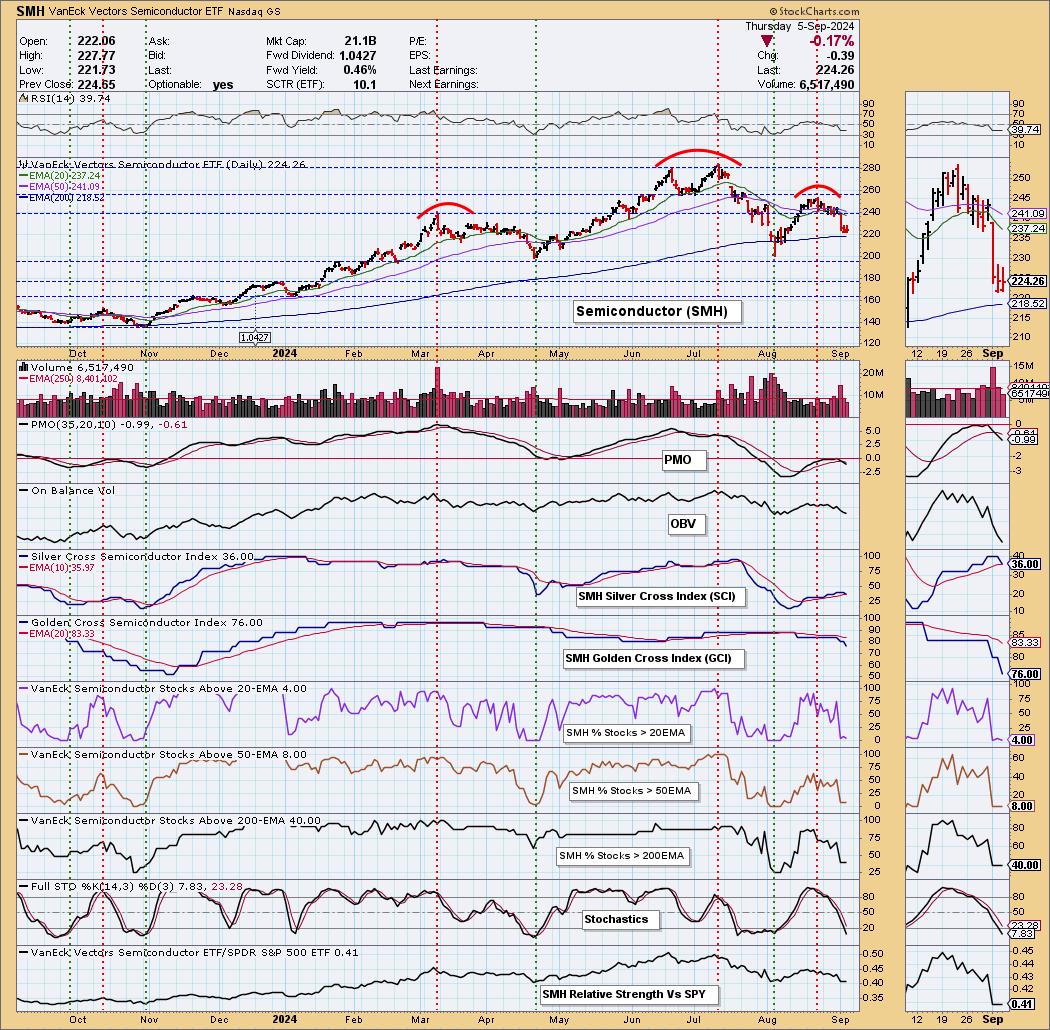
Intermediate-Term Bearish Head & Shoulders on Semiconductors (SMH)
by Erin Swenlin,
Vice President, DecisionPoint.com
We are always on the lookout for chart patterns. Recently, we've found a bearish head-and-shoulders developing on Semiconductors (SMH).
Looking at the daily chart below, we can see the pattern developing. However, we do have to point out participation. Note the very low percentages on %Stocks > 20/...
READ MORE
MEMBERS ONLY
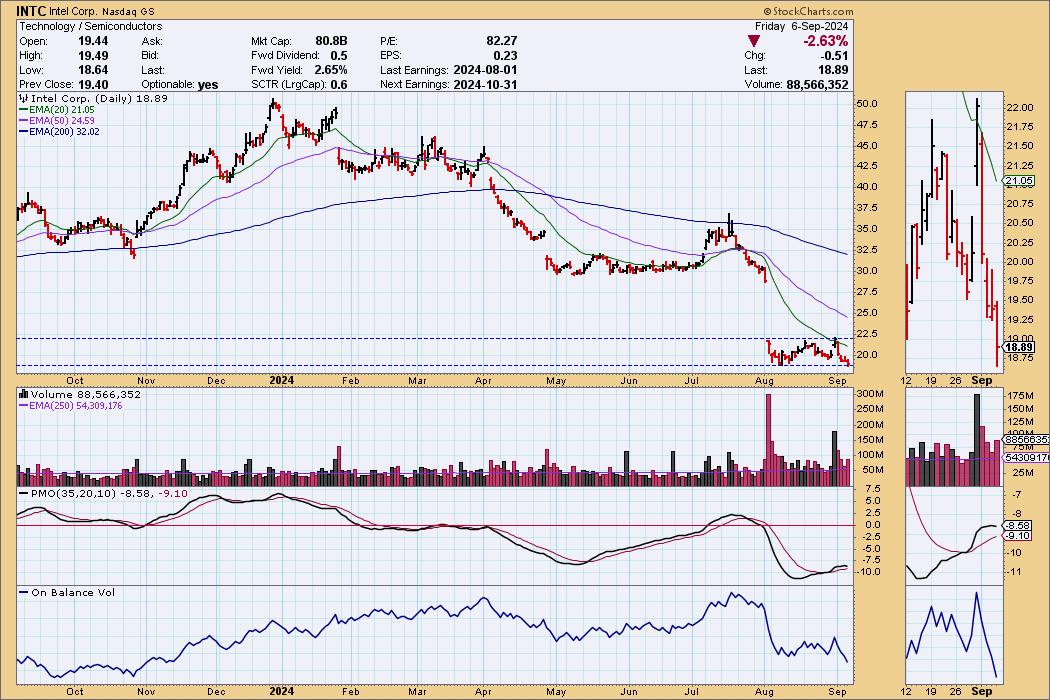
Is It Time to Buy Intel?

by Carl Swenlin,
President and Founder, DecisionPoint.com
I've been around long enough to remember when Intel (INTC) was the NVIDIA of the day. Now, INTC is under severe pressure, having suspended its dividend, and is currently being considered for removal from the Dow 30 Industrial Average. Oh, how the mighty have fallen!
With INTC having...
READ MORE
MEMBERS ONLY
The Best Reversal Patterns (Trading Strategy Explained)
by Joe Rabil,
President, Rabil Stock Research
In this exclusive StockCharts TV video, Joe shares how he identifies and trades a reversal pattern. Highlighting what causes him to focus in on a stock, he shares the 1-2-3 reversal pattern, along with the keys in MACD and ADX that allow you to improve the risk/reward equation in...
READ MORE
MEMBERS ONLY
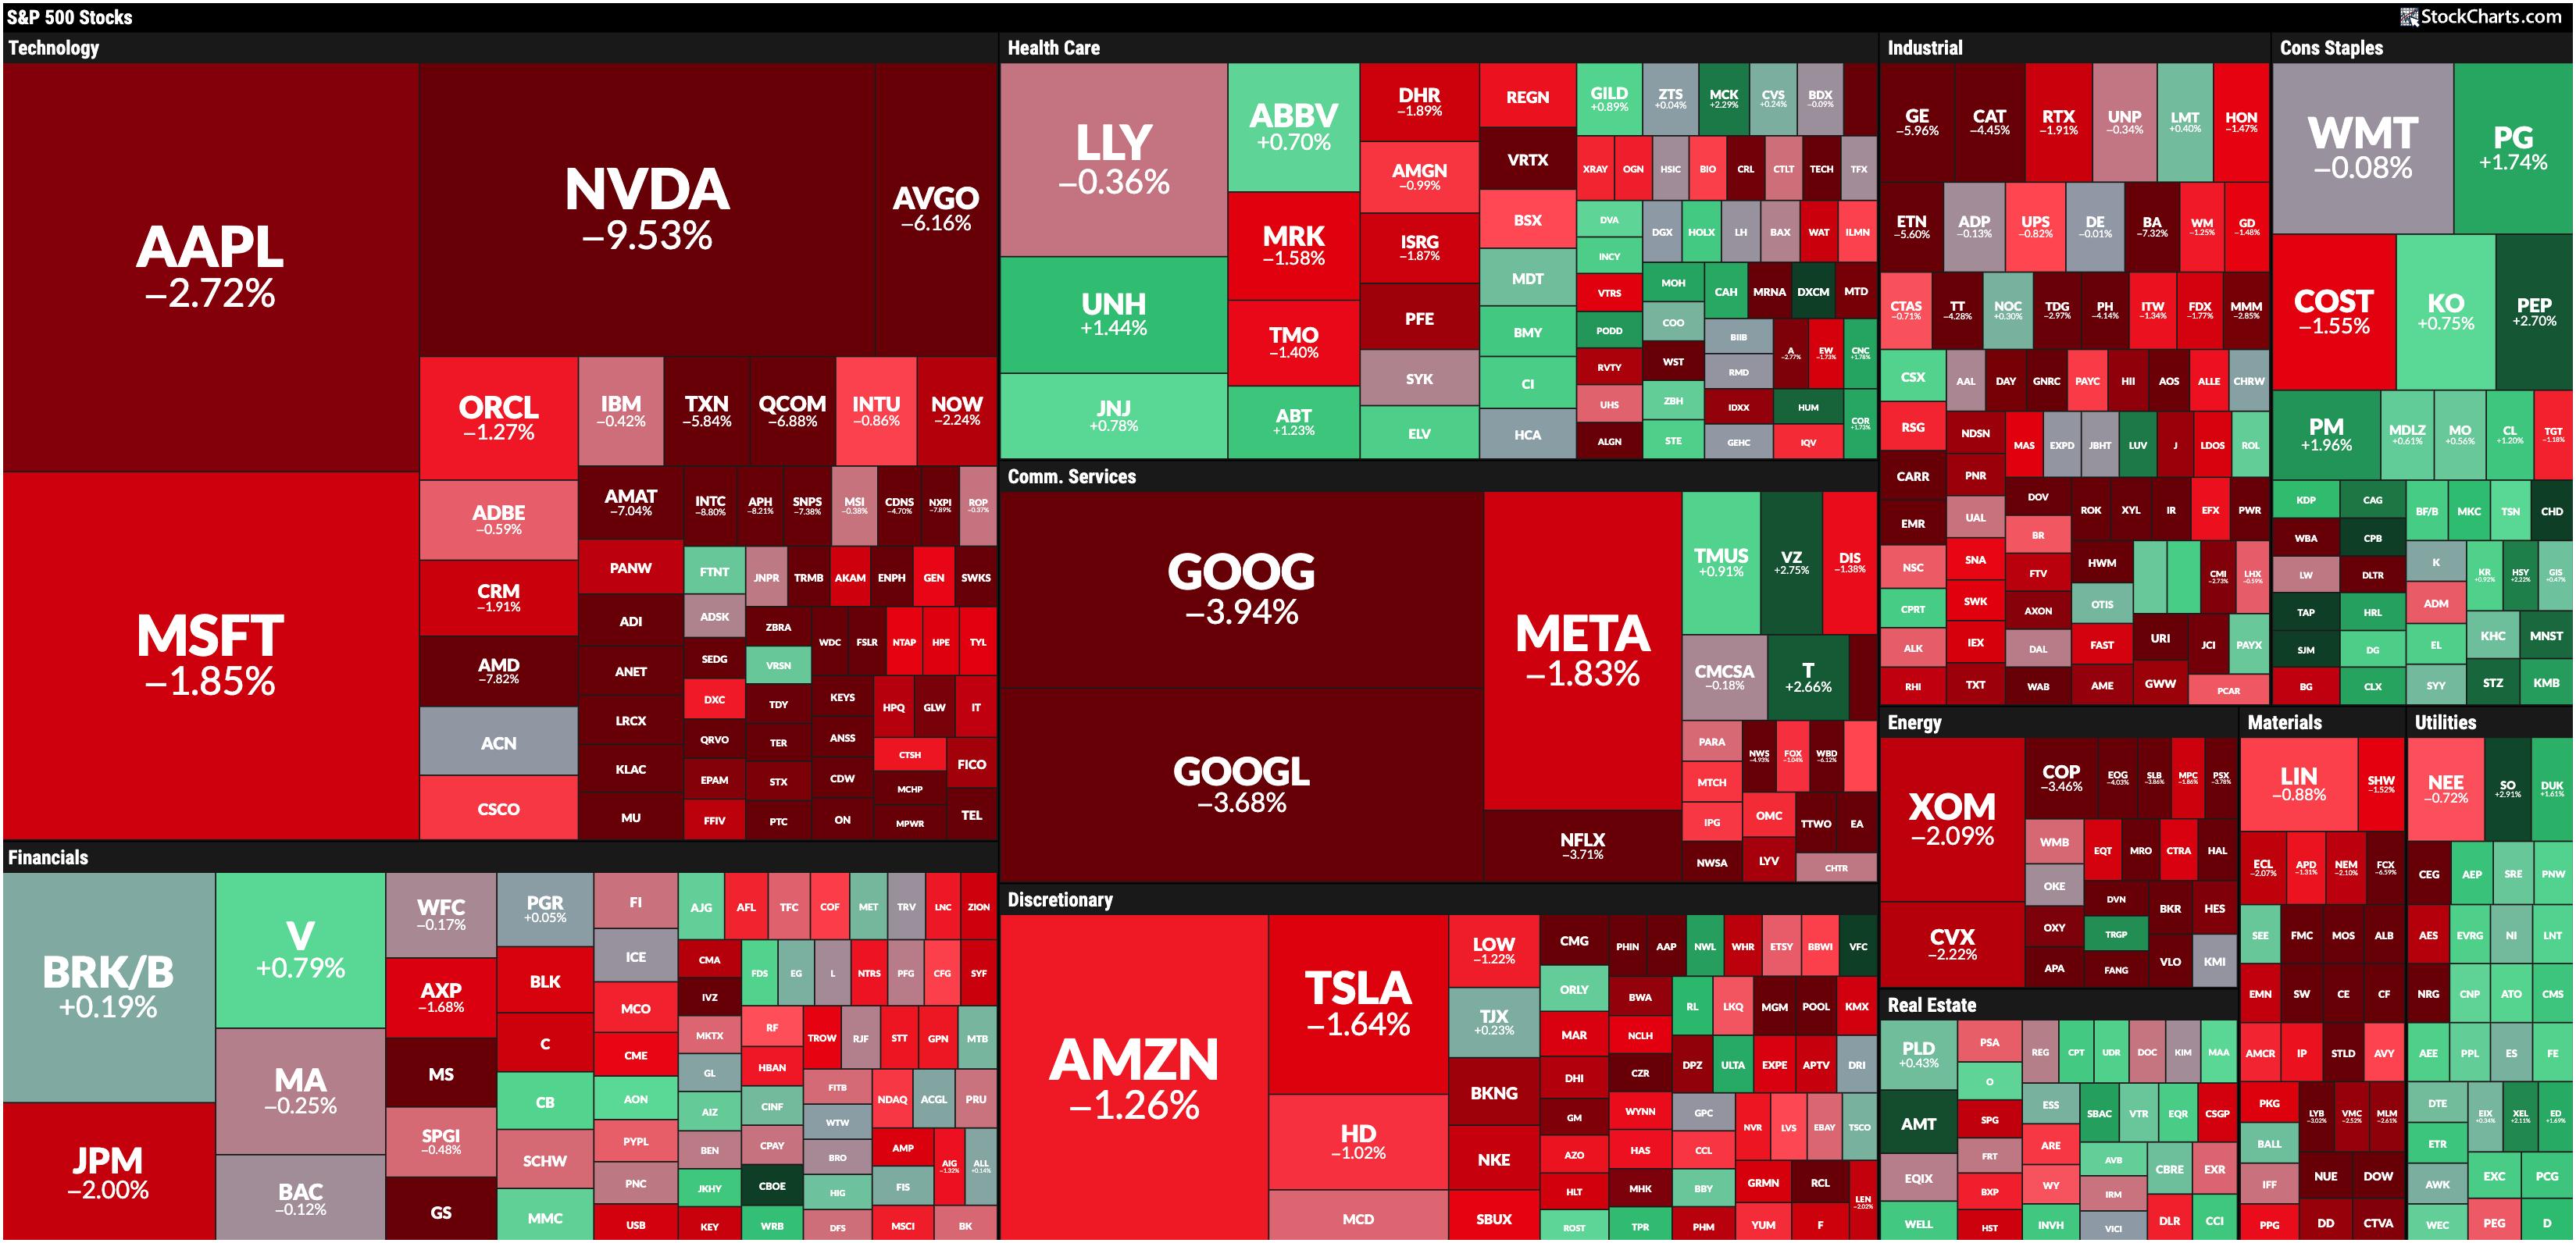
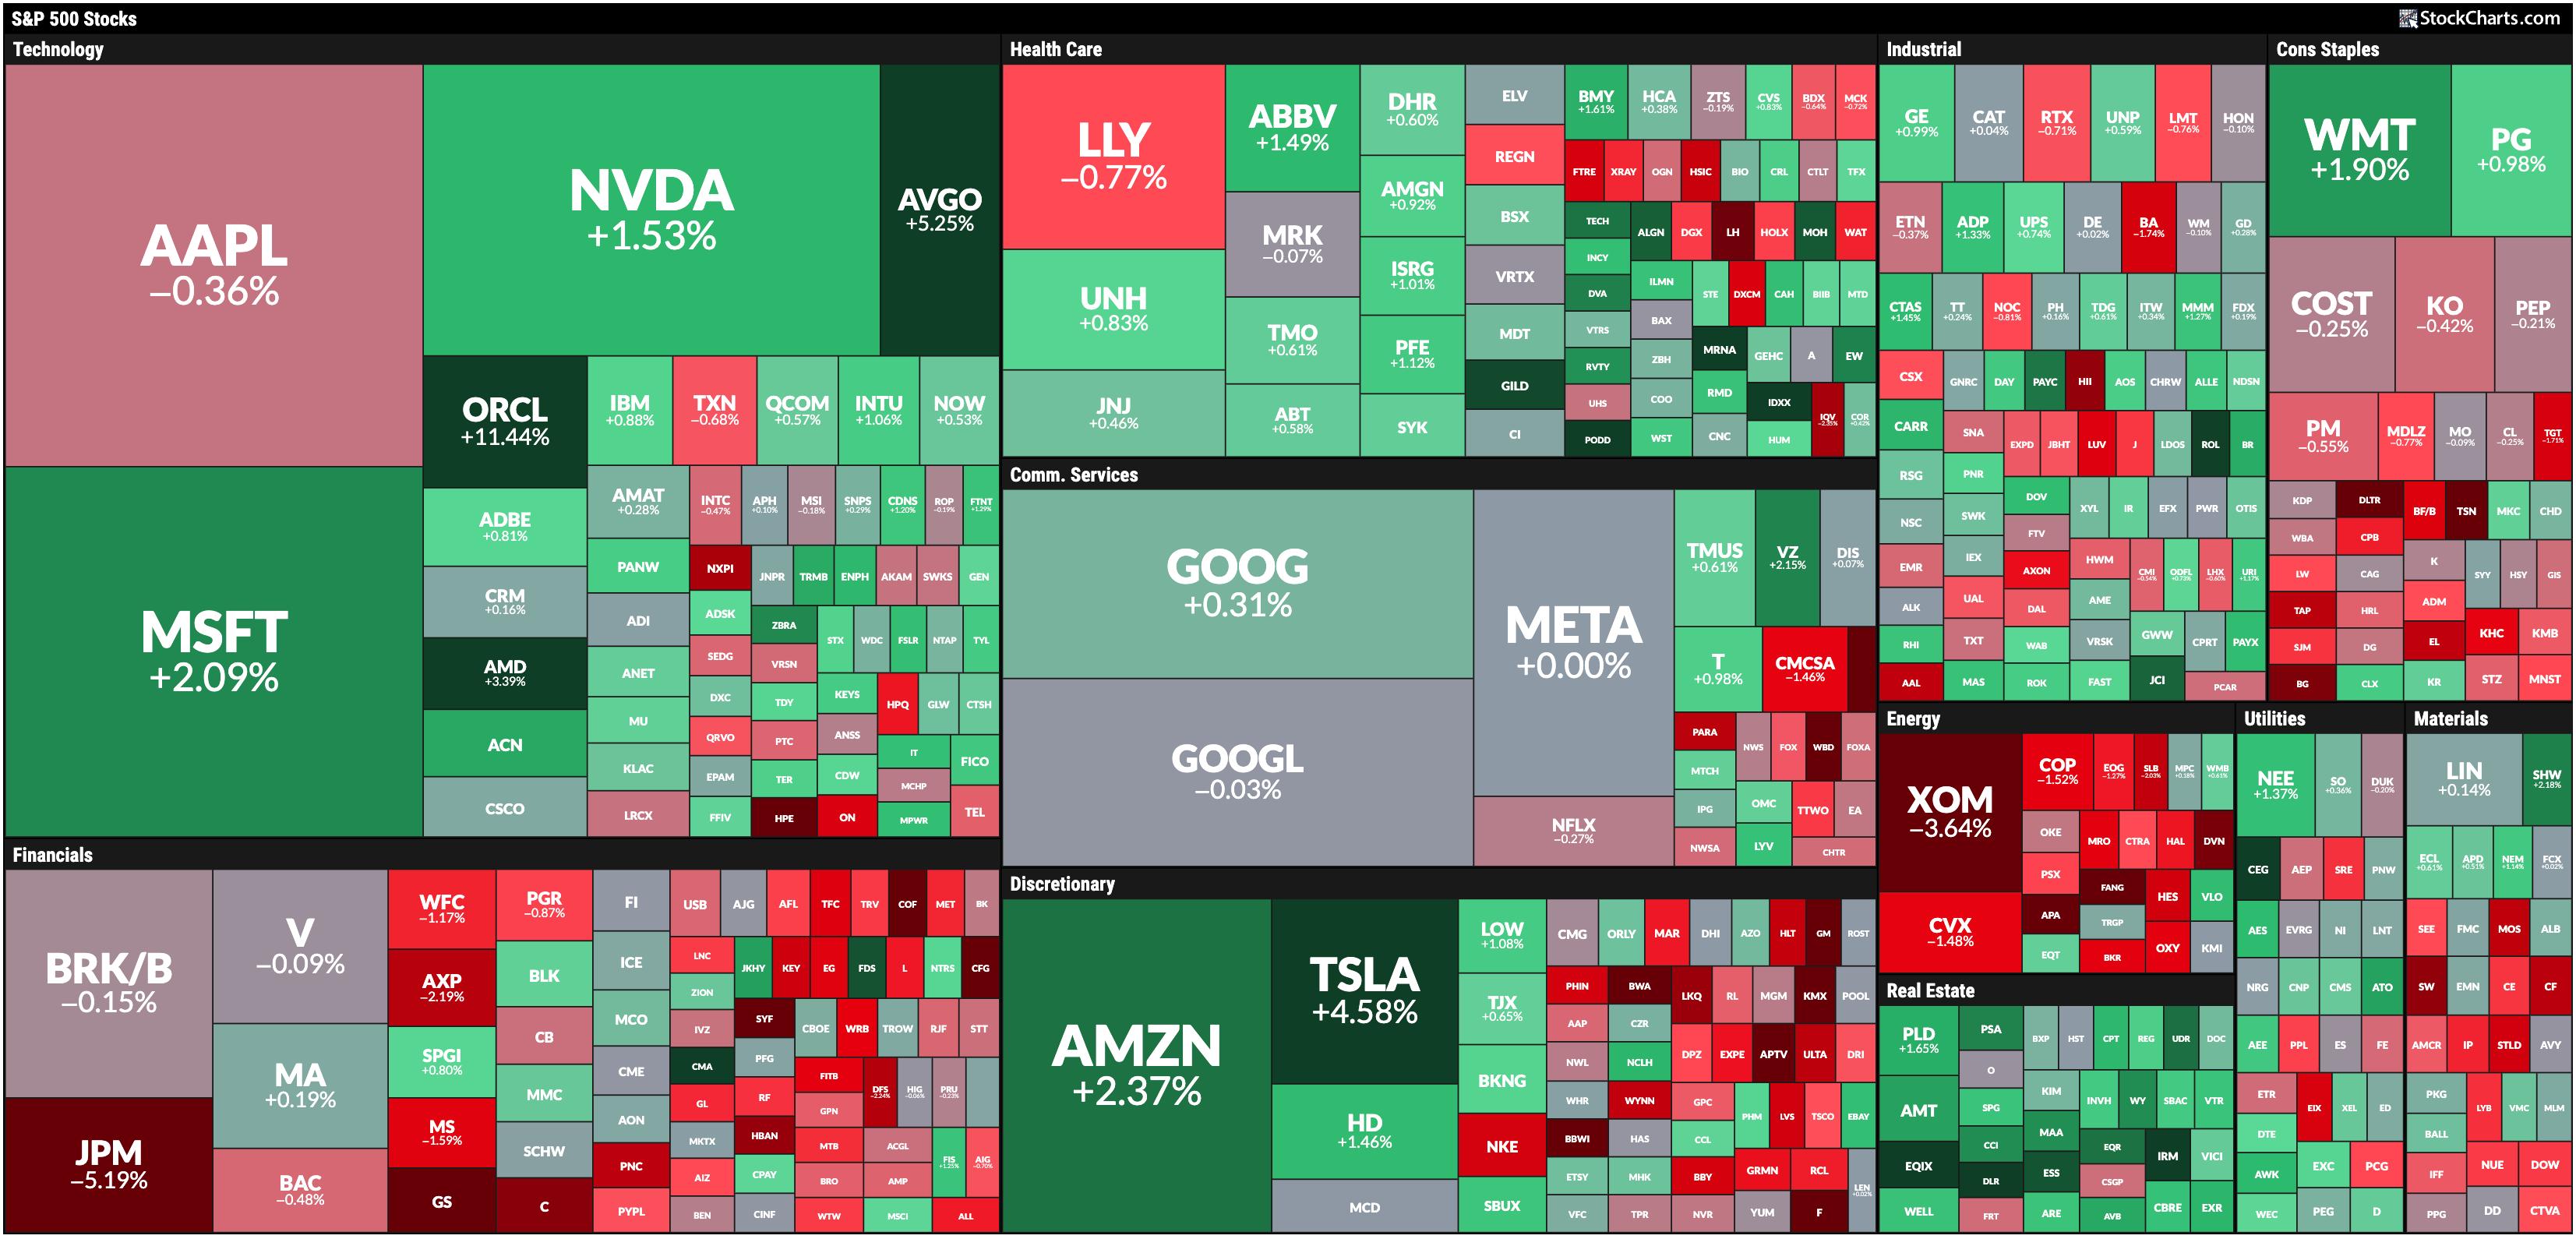
Stock Market Today: Tech Tumbles as Mega-Cap Stocks Get Hit by Major Profit-Taking
by Jayanthi Gopalakrishnan,
Director of Site Content, StockCharts.com
KEY TAKEAWAYS
* Semiconductor stocks get slammed
* Volatility rises as investors become more fearful of more selling pressure ahead
* Investors should be extremely cautious as Broadcom earnings and Non-Farm Payrolls could impact the stock market
I hope you had a relaxing, restful long weekend, and welcome to September.
It was a...
READ MORE
MEMBERS ONLY
Why the S&P 500 Going Sideways is the Best Case Scenario
by Julius de Kempenaer,
Senior Technical Analyst, StockCharts.com
In this video from StockCharts TV,Julius evaluates the completed monthly charts for August, noting the strength of defensive sectors. He then analyzes a monthly RRG and seeks alignment for the observations from the price charts. Could "sideways" be the most positive scenario for the S&P...
READ MORE
MEMBERS ONLY
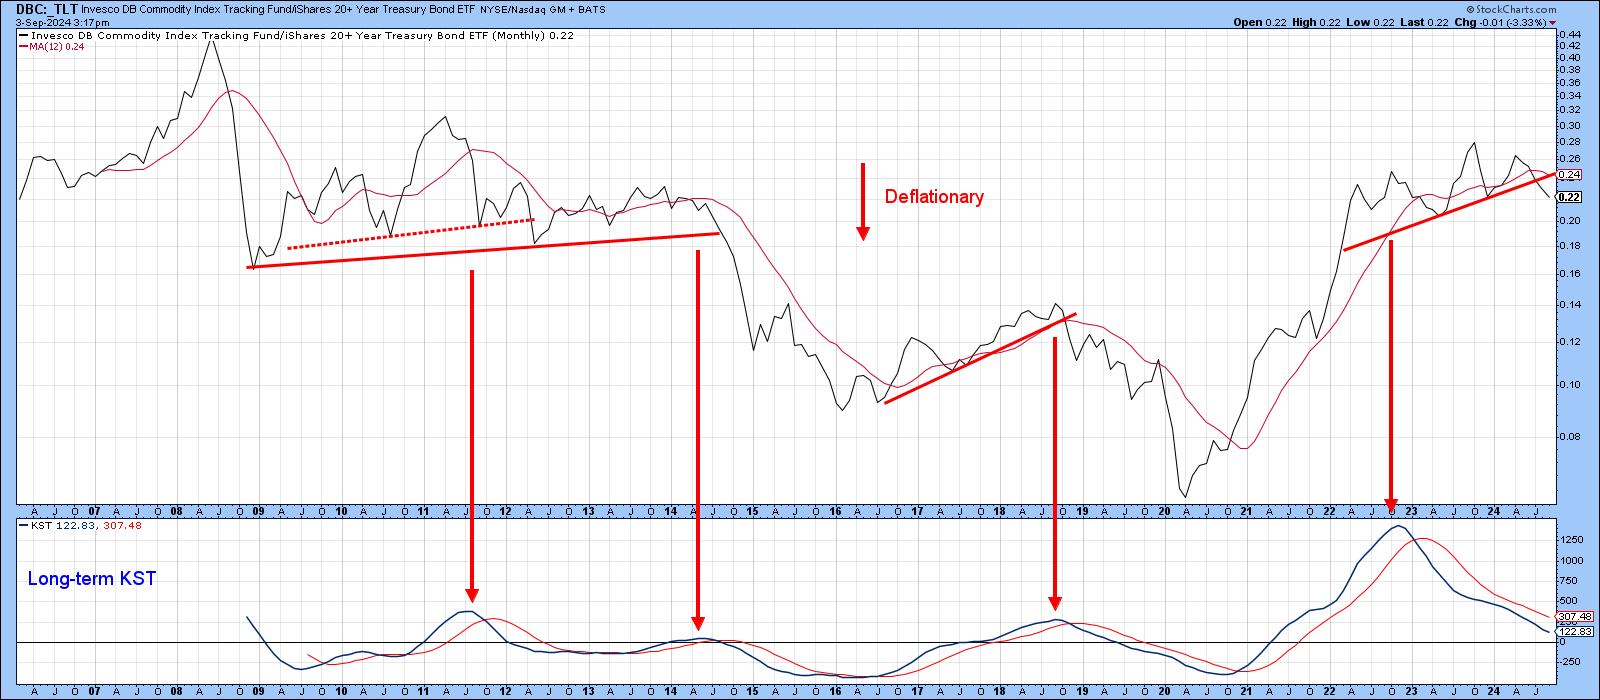
Is It Inflation or Deflation? What's in Your Wallet?
by Martin Pring,
President, Pring Research
Every business cycle has an inflationary and deflationary part, and it's very important for both traders and investors at least to try to have some understanding which has the upper hand at any particular point in time.
For example, when the economy is in a slowdown or recessionary...
READ MORE
MEMBERS ONLY
Signing Off

by Greg Morris,
Veteran Technical Analyst, Investor, and Author
Signing Off
I want to thank the owner/President of StockCharts.com, Chip Anderson, and his son, Eric, for 25 years of friendship, over 10 years of writing 200+ articles in my "Dancing with the Trend" blog on StockCharts.com. StockCharts.com offers a giant selection of tools...
READ MORE
MEMBERS ONLY
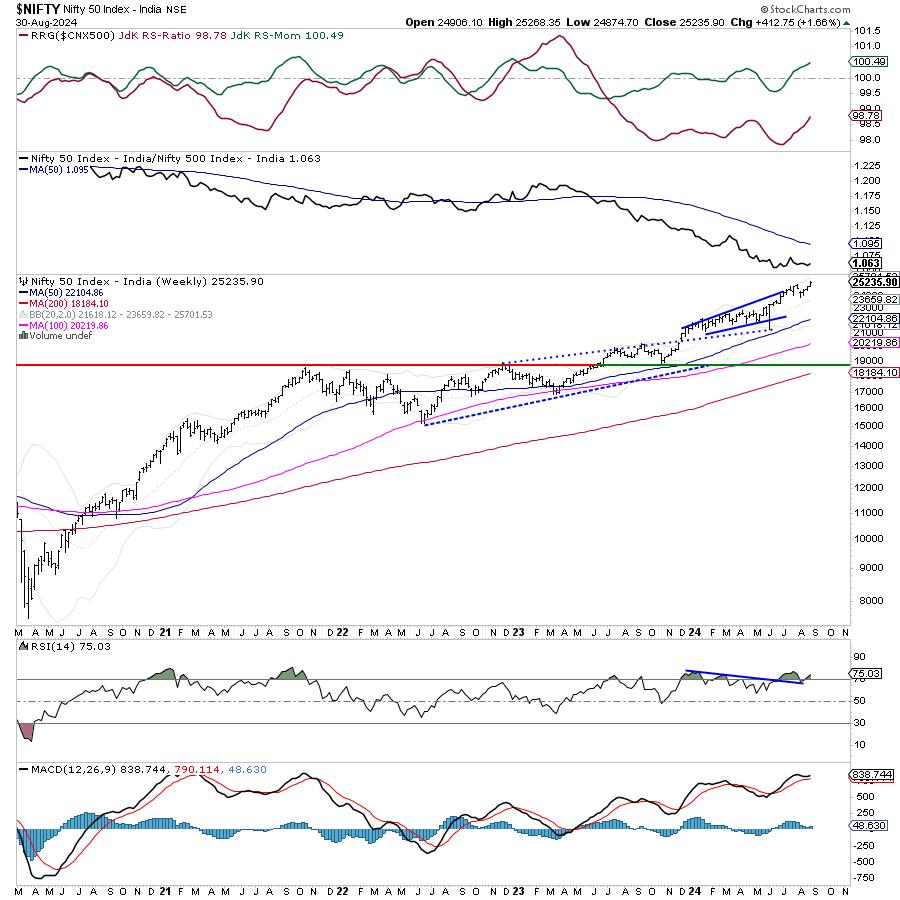
Week Ahead: Uptrend Stays Intact for NIFTY; RRG Shows Distinctly Defensive Setup
by Milan Vaishnav,
Founder and Technical Analyst, EquityResearch.asia and ChartWizard.ae
The past session for the markets stayed quite trending, as the headline index continued with its upward move. While extending its gains, the Nifty 50 Index ended the week on a very strong note. Witnessing a strong momentum on the upside, the market expanded its trading range as well. The...
READ MORE
MEMBERS ONLY

Should You Buy the Dip in NVDA?
by Mary Ellen McGonagle,
President, MEM Investment Research
In this StockCharts TV video, Mary Ellen reviews the broader markets, including NASDAQ weakness, and the outperformance in the equal-weighted S&P 500. She examines NVDA and shares how you should trade the stock depending on your investment horizon. Last up, Mary Ellen reveals top stocks in leadership areas....
READ MORE