MEMBERS ONLY
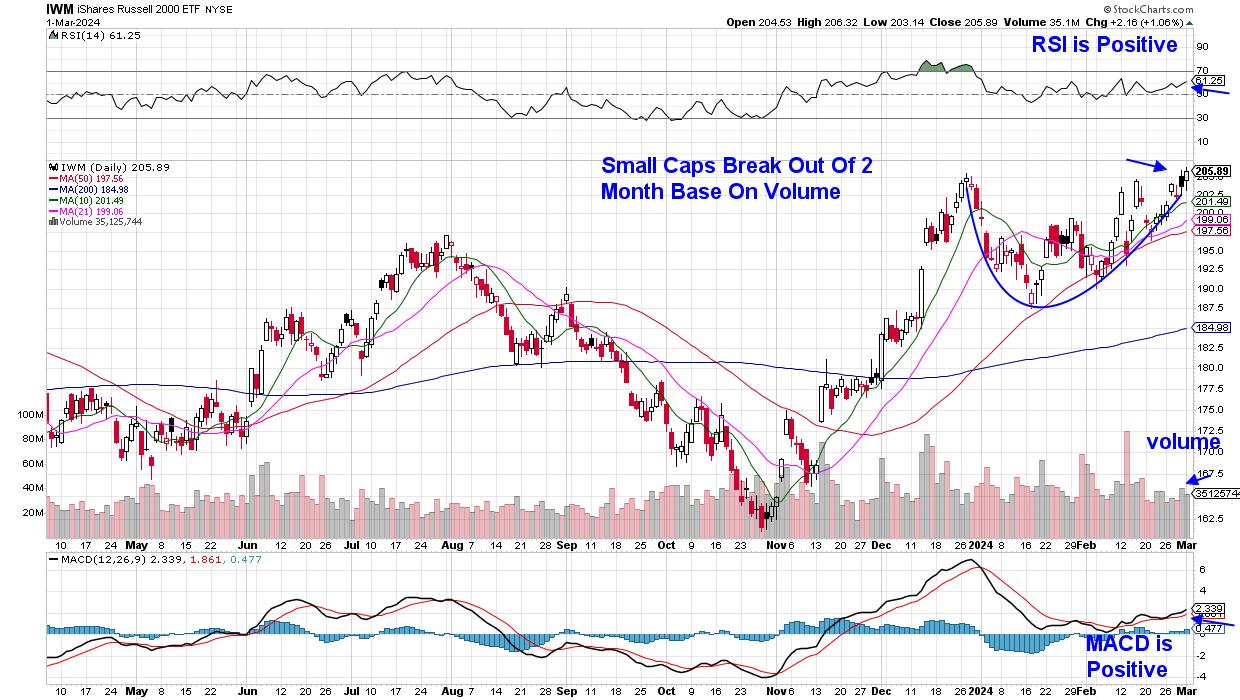
Small Caps Join The Party -- Here's a Top Stock to Consider

by Mary Ellen McGonagle,
President, MEM Investment Research
The S&P 500 and the NASDAQ both reached an all-time high today boosted by a Tech-fueled rally amid AI-related names. Small-cap stocks also had a bullish day after posting a two-month base breakout to near-term highs. This index has had a tough period recently, as nearly 15% of...
READ MORE
MEMBERS ONLY
How I Found SMCI BEFORE the Stock Gained Over 205% (in 3 Simple Steps!)

by Grayson Roze,
Chief Strategist, StockCharts.com
Feel like you never find those high-flying stocks before they make their big moves? This week's edition of StockCharts TV'sStockCharts in Focus is for you! Grayson walks you through the 3 simple steps he uses to find, track and trade the market's strongest stocks...
READ MORE
MEMBERS ONLY
MEM TV: 3 Great WAYS to Play AMD Stock
by Mary Ellen McGonagle,
President, MEM Investment Research
In this episode of StockCharts TV'sThe MEM Edge, Mary Ellen reviews the move into Semiconductors and shares what that means for Technology. Diving in to volatility, she highlights 3 ways investors can take advantage of the moves in Advanced Micro Devices (AMD). She also highlights other bright spots...
READ MORE
MEMBERS ONLY
Could This Stock Be the NEXT NVDA?

by David Keller,
President and Chief Strategist, Sierra Alpha Research
In this edition of StockCharts TV'sThe Final Bar, Dave wraps up his Dubai journey with a special Viewer's Questions Mailbag edition! Dave explores whether LABU is on the path to mimic NVIDIA and if it's still the right time to jump in. He also...
READ MORE
MEMBERS ONLY

Your Selling Methodology is Your Paramedic to Profits

by Gatis Roze,
Author, "Tensile Trading"
"When you feel like bragging, it's probably time to sell." — John Neff
Stock market investing is simple, really. You only need to make two choices: when to buy and when to sell. The unfortunate reality is that 75% of casual investors really only want to hear...
READ MORE
MEMBERS ONLY
AMD Spikes Higher as AI Trade Still Kicking
by David Keller,
President and Chief Strategist, Sierra Alpha Research
In this edition of StockCharts TV'sThe Final Bar, Dave recaps today's market activity from the CMT 2024 Summit in Dubai, highlighting AMD's upside breakout, breadth improvement for US stocks, and why big round numbers matter for stocks like SMCI.
This video originally premiered on...
READ MORE
MEMBERS ONLY
Are "The Seven" Still Magnificent?

by Carl Swenlin,
President and Founder, DecisionPoint.com
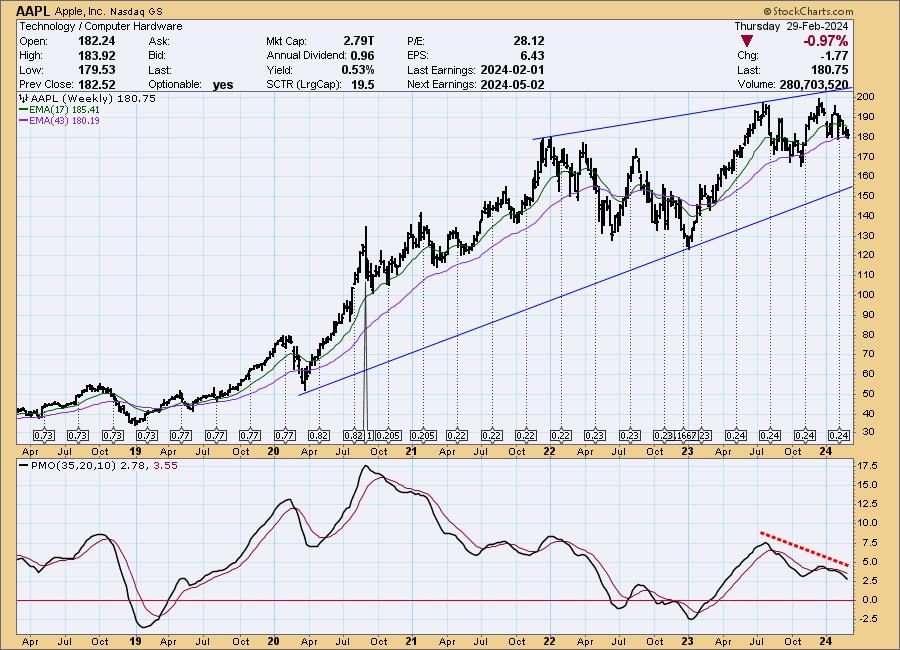
I have been hearing comments that some of the Magnificent Seven no longer qualify for membership, so I thought a quick look at them might be helpful. For this analysis, I'll be using weekly charts.
Apple (AAPL): AAPL is dealing with trying to move production out of China,...
READ MORE
MEMBERS ONLY
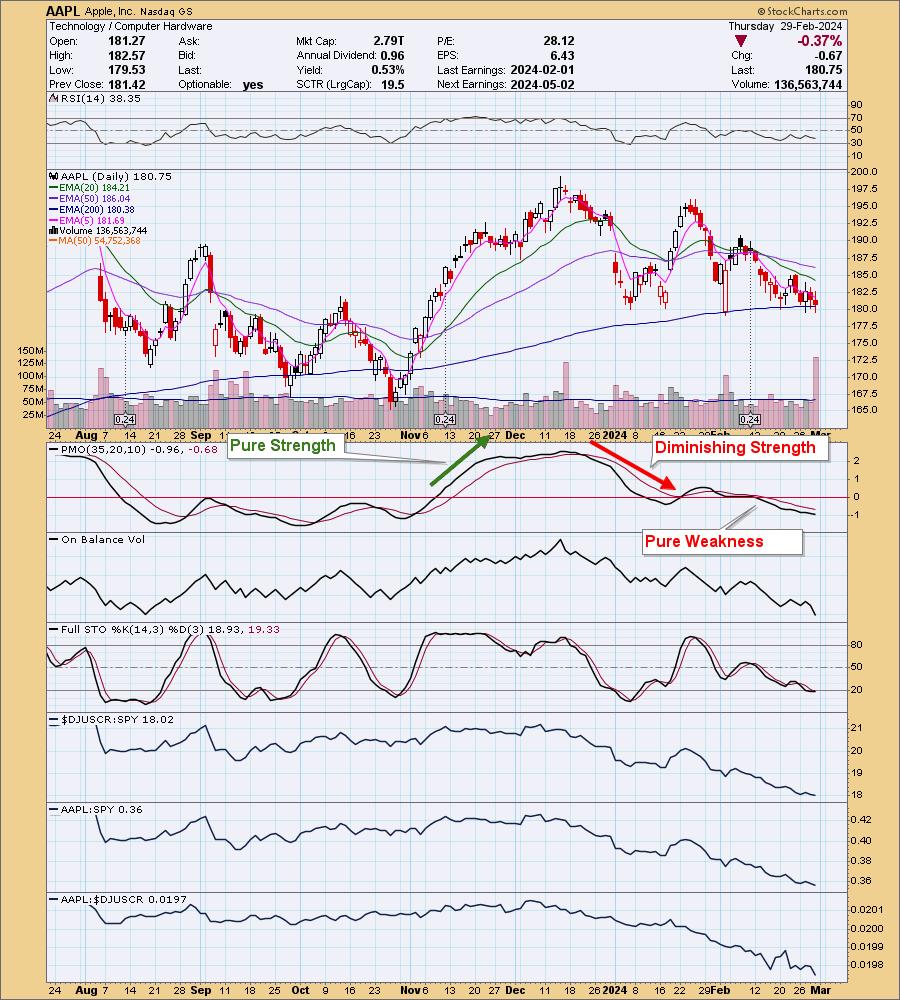
Apple (AAPL) and Google (GOOGL) Flashing "Pure Weakness"

by Erin Swenlin,
Vice President, DecisionPoint.com
We've begun talking more about the Price Momentum Oscillator (PMO) as it relates to finding "pure strength" and "pure weakness". What it all comes down to is the zero line and the PMO's behavior above or below.
We review the Magnificent 7...
READ MORE
MEMBERS ONLY

Swing Trading Strategies, Tips & Trends

by Joe Rabil,
President, Rabil Stock Research

by Bruce Fraser,
Industry-leading "Wyckoffian"
On this week's edition of Stock Talk with Joe Rabil, Joe features special guest, Bruce Fraser of Power Charting. Joe and Bruce discuss swing trading in detail, first by defining swing trading and how it is different from trend trading, and then spending time going through the SIG...
READ MORE
MEMBERS ONLY
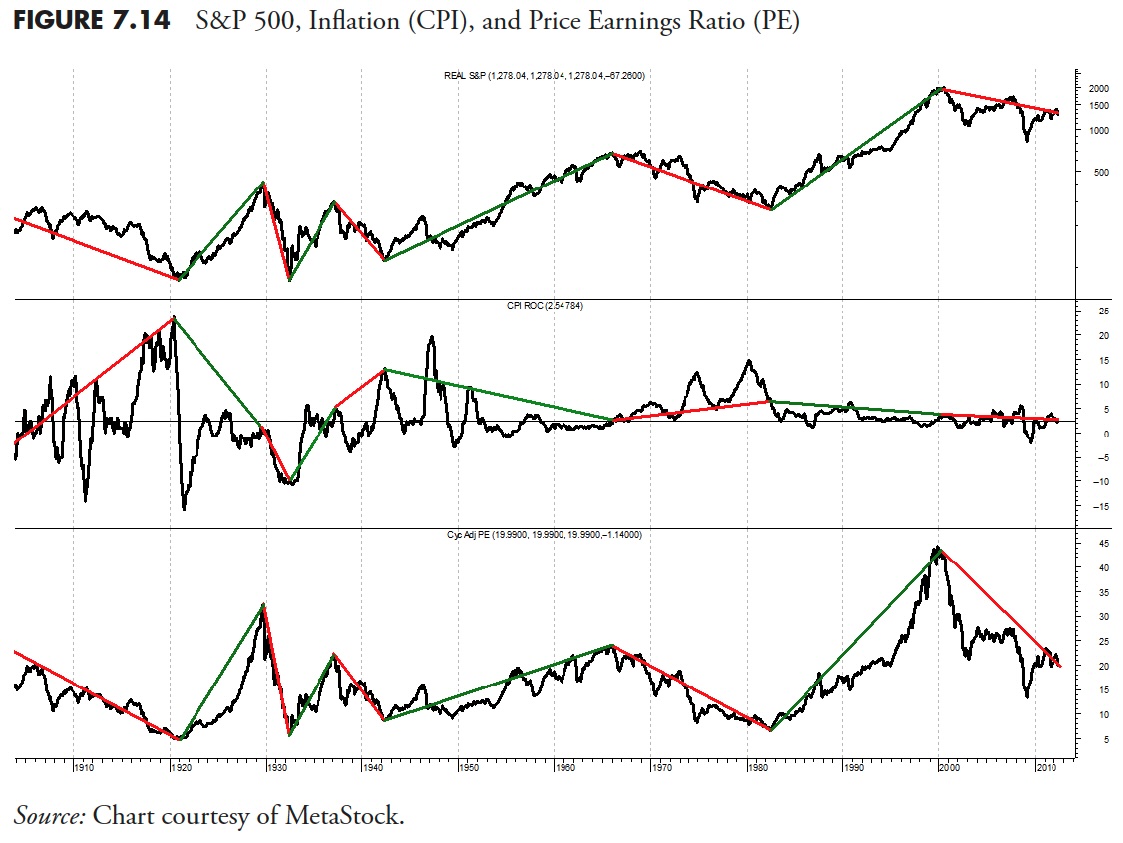
The Hoax of Modern Finance - Part 10: Market Facts — Secular Markets

by Greg Morris,
Veteran Technical Analyst, Investor, and Author
Note to the reader: This is the tenth in a series of articles I'm publishing here taken from my book, "Investing with the Trend." Hopefully, you will find this content useful. Market myths are generally perpetuated by repetition, misleading symbolic connections, and the complete ignorance of...
READ MORE
MEMBERS ONLY
Magnificent 7 Not All Magnificent!
by David Keller,
President and Chief Strategist, Sierra Alpha Research
In this edition of StockCharts TV'sThe Final Bar, Dave speaks to the diversifying patterns within the Magnificent 7, with GOOGL and AAPL showing clear signs of short-term distribution. He also tracks Bitcoin reaching the 64K level and shares some initial thoughts from the CMT Dubai Summit.
This video...
READ MORE
MEMBERS ONLY

Three Intermarket Relationships That Say This Bull Market is Going Higher

by Martin Pring,
President, Pring Research
Absorbing the information gleaned from monthly charts for various asset classes or sectors can help gain some perspective. However, I find that an examination of the relationships between them can be equally rewarding, if not moreso. That's because they point out the nature of the current investment environment,...
READ MORE
MEMBERS ONLY

Market In a "Wait and See" Mode: Awaiting Important Inflation Data

by Jayanthi Gopalakrishnan,
Director of Site Content, StockCharts.com
KEY TAKEAWAYS
* Investors are anxiously awaiting the PCE data to get clues on when the Fed will start cutting interest rates
* Small cap stocks look like they want to break out of a range and join the bullish equity rally
* Bitcoin is having a strong week with three consecutive significant...
READ MORE
MEMBERS ONLY
New Dow Theory CONFIRMS BULL Phase!
by David Keller,
President and Chief Strategist, Sierra Alpha Research
In this edition of StockCharts TV'sThe Final Bar, Dave continues his market recaps from Dubai, focusing on the impressive rally in small caps, continued strength in Bitcoin, and upside potential for crude oil and oil services stocks. He highlights one technology name in a persistent downtrend, but potentially...
READ MORE
MEMBERS ONLY

The False Flag of Fed Rate Cuts | Focus on Stocks: March 2024

by Larry Williams,
Veteran Investor and Author
Let's begin this month with a look at...
The False Flag of Fed Rate Cuts
Day after day, we hear how the Fed will embark on a series of rate cuts this year "because inflation has peaked" and is heading lower. The drop in inflation is...
READ MORE
MEMBERS ONLY
BITCOIN Rally Picks Up Steam, What's Next?
by David Keller,
President and Chief Strategist, Sierra Alpha Research
In this edition of StockCharts TV'sThe Final Bar, Dave shares his first market update from Dubai with a recap of Bitcoin's electrifying rally, Tesla's bounce higher, and Alphabet's pullback. The S&P 500 remains above 5K with plenty of new 52-week...
READ MORE
MEMBERS ONLY
DP Trading Room: The PMO Versus the MACD!
by Erin Swenlin,
Vice President, DecisionPoint.com
Today Carl explains the benefits of using the Price Momentum Oscillator versus the MACD. They are not the same!
Carl then gives us his insights on the market in general as well as Bitcoin news, Magnificent 7 overview, as well as Crude Oil and Interest Rates.
Erin gives us an...
READ MORE
MEMBERS ONLY
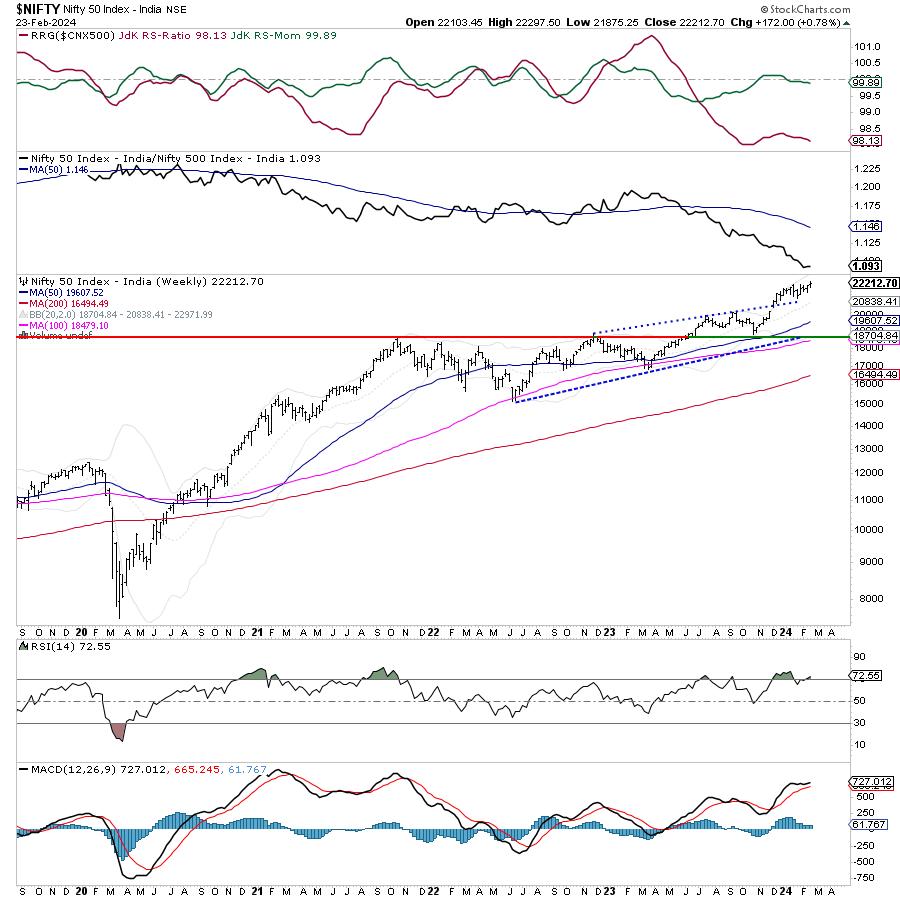
Week Ahead: NIFTY Likely to Continue Consolidating; Finding Relative Outperformance

by Milan Vaishnav,
Founder and Technical Analyst, EquityResearch.asia and ChartWizard.ae
In the previous technical note, it was categorically mentioned that, while the overall trend may stay intact, the markets could continue to largely consolidate. In line with the analysis, the markets kept consolidating, staying in a broad but defined trading range. That range, over the past week, was 422 points;...
READ MORE
MEMBERS ONLY
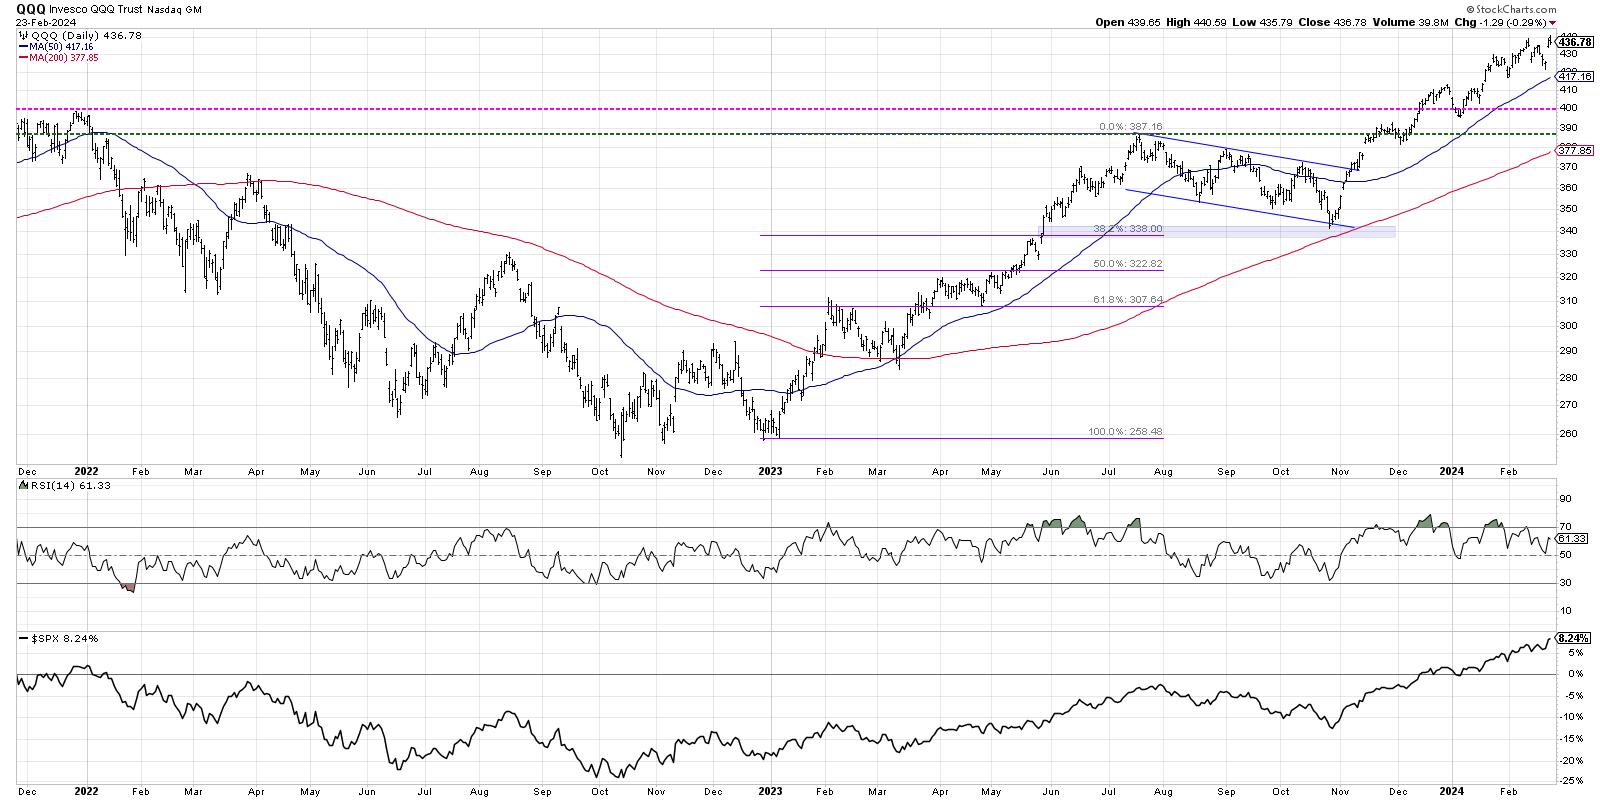
How Overextended Are You, QQQ?
by David Keller,
President and Chief Strategist, Sierra Alpha Research
We've highlighted all the warning signs as this bull market phase has seemed to near an exhaustion point. We shared bearish market tells, including the dreaded Hindenburg Omen,and how leading growth stocks have beendemonstrating questionable patterns. But despite all of those signs of market exhaustion, our growth-led...
READ MORE
MEMBERS ONLY

MEM TV: Simple Way to Identify a Buy Point in NVDA
by Mary Ellen McGonagle,
President, MEM Investment Research
In this episode of StockCharts TV'sThe MEM Edge, Mary Ellen reviews what drove the markets to new highs and what areas are outperforming. She also shares how to identify a buy point in NVDA after its gap up following earnings, as well as how to determine when a...
READ MORE
MEMBERS ONLY
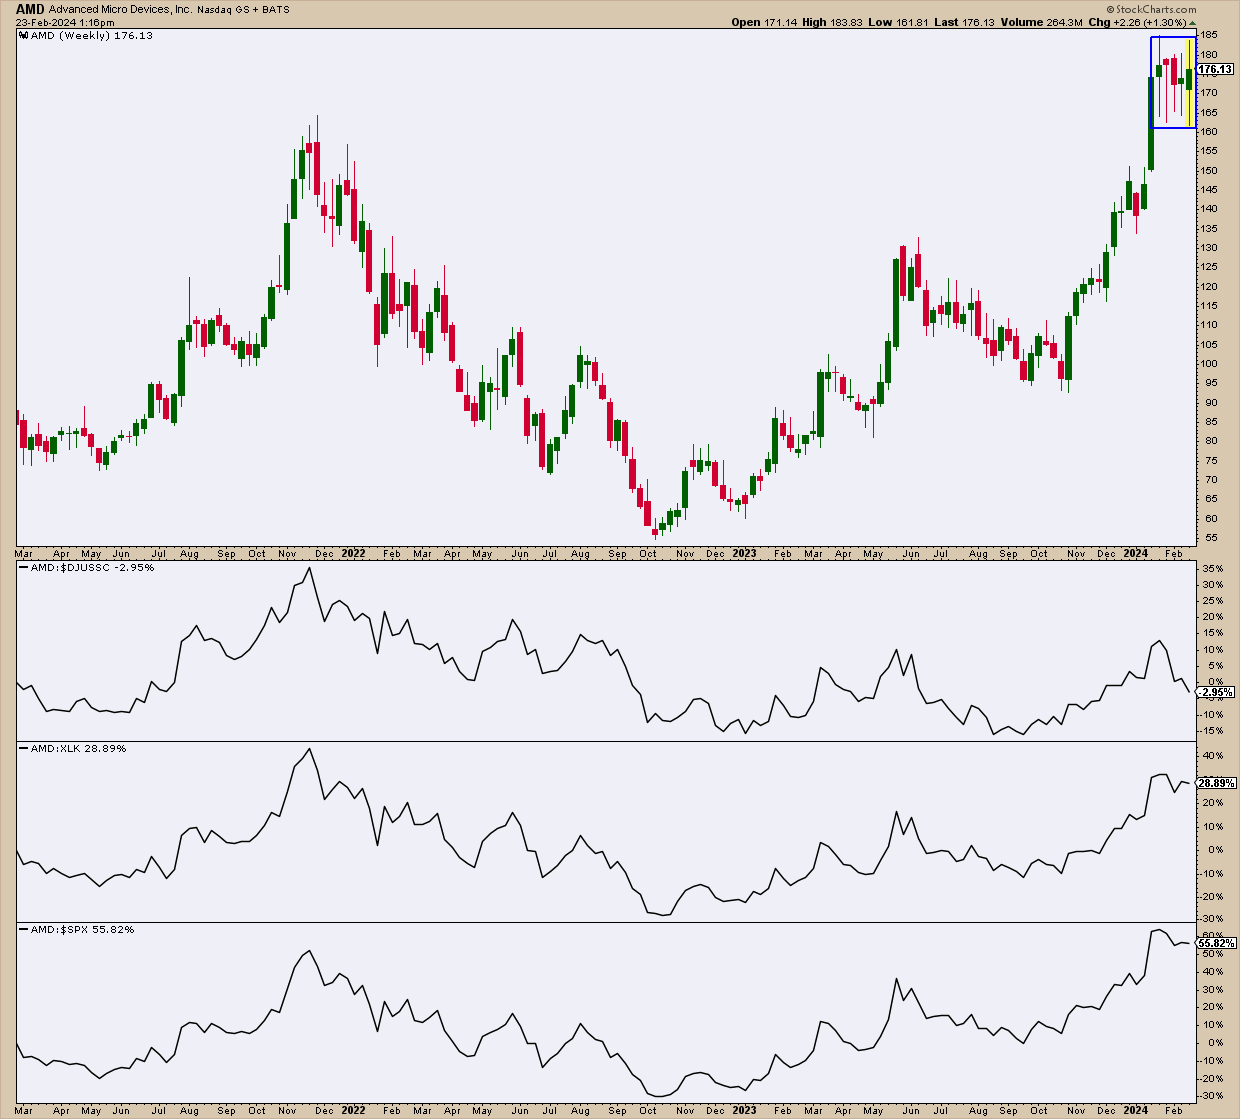
AMD's Sensational Halt — What You Need to Watch

by Karl Montevirgen,
The StockCharts Insider
KEY TAKEAWAYS
* Advanced Micro Devices (AMD) recovered quickly from a post-earnings slump
* Its longer term price action suggests indecision and the current pattern can also break either way
* This can either be a short-term trade or an investment; both scenarios will require different strategies
If you ran a StockCharts Gap...
READ MORE
MEMBERS ONLY

The Best Technical Indicator for Long-Term Investors
by David Keller,
President and Chief Strategist, Sierra Alpha Research
In this edition of StockCharts TV'sThe Final Bar, Dave drops an all-mailbag episode featuring viewer questions on the Hindenburg Omen, ascending triangle patterns, Fibonacci Retracements, projecting upside targets for stocks like NVDA, and the best technical indicator long-term investors should use!
This video originally premiered on February 23,...
READ MORE
MEMBERS ONLY
Is Energy About to Undergo a Strong Seasonal Sector Surge?
by Karl Montevirgen,
The StockCharts Insider
KEY TAKEAWAYS
* Combining fundamental forecasts with seasonality patterns offers a potent strategy for identifying tradable opportunities in specific sectors
* The Energy (XLE), Utilities (XLU), and Materials (XLB) sectors exhibit the strongest seasonal performance in the near-term
* Seasonality charts provide valuable insights, but checking overall stock market conditions and technical trading...
READ MORE
MEMBERS ONLY
NVDA SCREAMS BULL With Earnings Breakout
by David Keller,
President and Chief Strategist, Sierra Alpha Research
In this edition of StockCharts TV'sThe Final Bar, Dave identifies key resistance levels for QQQ and HYG, along with a technical analysis downtrend checklist for charts in confirmed bear phases. Guest Larry Tentarelli of Blue Chip Daily Trend Report shares two stocks he's tracking along with...
READ MORE
MEMBERS ONLY

S&P 500's Sensational Rally Keeps On Going Thanks to NVDA — What You Need to Watch
by Jayanthi Gopalakrishnan,
Director of Site Content, StockCharts.com
KEY TAKEAWAYS
* S&P 500 hits a new all-time high and could keep on going
* NVIDIA's stellar earnings report was a catalyst to the rise in the S&P 500
* Volatility declined, indicating that investors are still relatively calm
Well, Nvidia did it! A stellar earnings...
READ MORE
MEMBERS ONLY
3 Unique RSI Techniques to Maximize Your Investments
by Joe Rabil,
President, Rabil Stock Research
On this week's edition of Stock Talk with Joe Rabil, Joe dives into the world of technical analysis by sharing three unique ways to utilize the RSI indicator alongside MACD and ADX -- the Pullback Trade, Confirming a Breakout and 2nd Chance Entry. He then covers the symbol...
READ MORE
MEMBERS ONLY
The Hoax of Modern Finance - Part 9: Market Facts — Bull and Bear Markets
by Greg Morris,
Veteran Technical Analyst, Investor, and Author
Note to the reader: This is the ninth in a series of articles I'm publishing here taken from my book, "Investing with the Trend." Hopefully, you will find this content useful. Market myths are generally perpetuated by repetition, misleading symbolic connections, and the complete ignorance of...
READ MORE
MEMBERS ONLY
Markets Bracing for NVDA Earnings
by David Keller,
President and Chief Strategist, Sierra Alpha Research
In this edition of StockCharts TV'sThe Final Bar, Dave breaks down the latest market breadth indicators, ranging from bullish (S&P 500 advance-decline line) to bearish (Bullish Percent Indexes breaking down) to everything in between. He also analyzes key growth names including SMCI, PANW, AMZN, and NVDA....
READ MORE
MEMBERS ONLY

Emerging Markets Getting Closer to a Breakout
by Martin Pring,
President, Pring Research
Last November I asked the question "Are emerging markets about to emerge?"Using the iShares MSCI Emerging Markets ETF (EEM) as our benchmark, I concluded that more strength was needed in order to push the indicators into a bullish mode. In the intervening period, things have improved, but...
READ MORE
MEMBERS ONLY
The Halftime Show: Don't Box the Invisible Man -- EPS Reports

by Pete Carmasino,
Chief Market Strategist, Chaikin Analytics
On this week's edition ofStockCharts TV'sHalftime, Pete takes a look at long-term trends. Semiconductors taking it on the chin. Inflation is still a problem. Bonds are selling off, and the Fed isn't cutting rates until, in Pete's opinion, the unemployment rate falls....
READ MORE
MEMBERS ONLY

The Titanic Syndrome Indicator Issues a WARNING!
by David Keller,
President and Chief Strategist, Sierra Alpha Research
In this edition of StockCharts TV'sThe Final Bar, Dave focuses on AAPL which closed below its 200-day moving average as it tests key price support. Guest Jesse Felder of The Felder Report reports on the Titanic Syndrome, a market breadth indicator similar to the Hindenburg Omen that suggests...
READ MORE
MEMBERS ONLY
Sector Spotlight: Dominant Trend for Stocks Still UP

by Julius de Kempenaer,
Senior Technical Analyst, StockCharts.com
On this episode of StockCharts TV's Sector Spotlight, I separate the 11 sectors in the S&P 500 into Offensive, Defensive, and Sensitive, assessing their group rotational patterns to see if there is any alignment with the current technical condition of the S&P 500. After...
READ MORE
MEMBERS ONLY
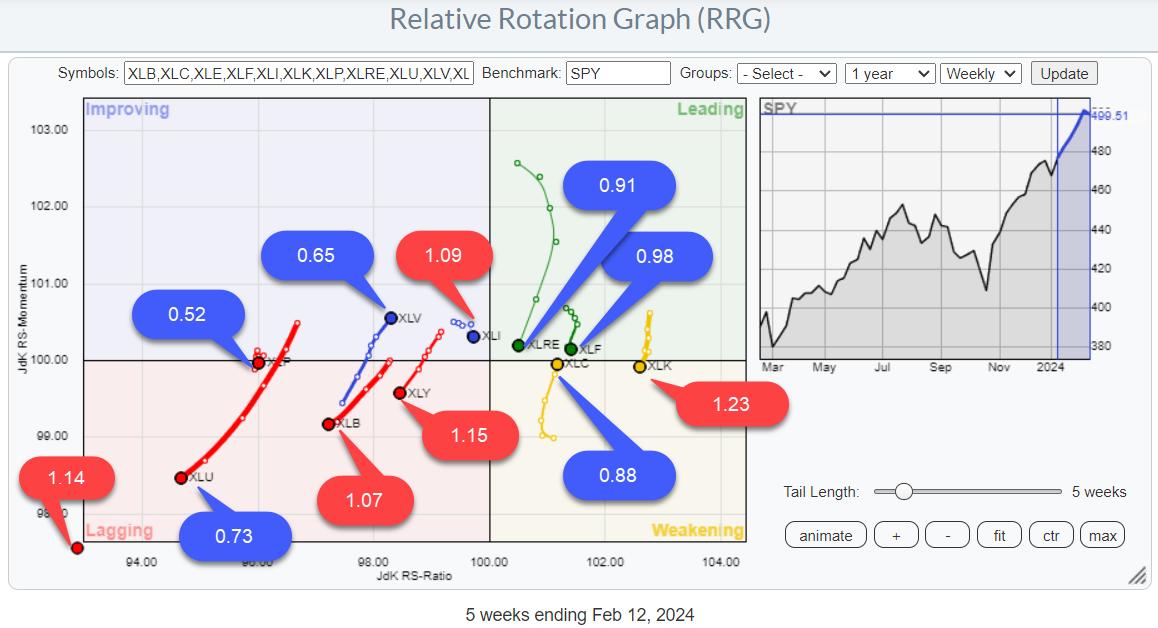
SPY Uptrend Intact, But Mixed Sector Rotation Signals Hesitation
by Julius de Kempenaer,
Senior Technical Analyst, StockCharts.com
KEY TAKEAWAYS
* Looking at Risk ON / OFF through BETA
* RRG shows mixed rotations
* SPY Uptrend intact with limited downside risk
BETA
One of the Risk ON/OFF metrics I like to keep an eye on is BETA.
From Investopedia:
—systematic risk—
I have updated my spreadsheet with last year'...
READ MORE
MEMBERS ONLY
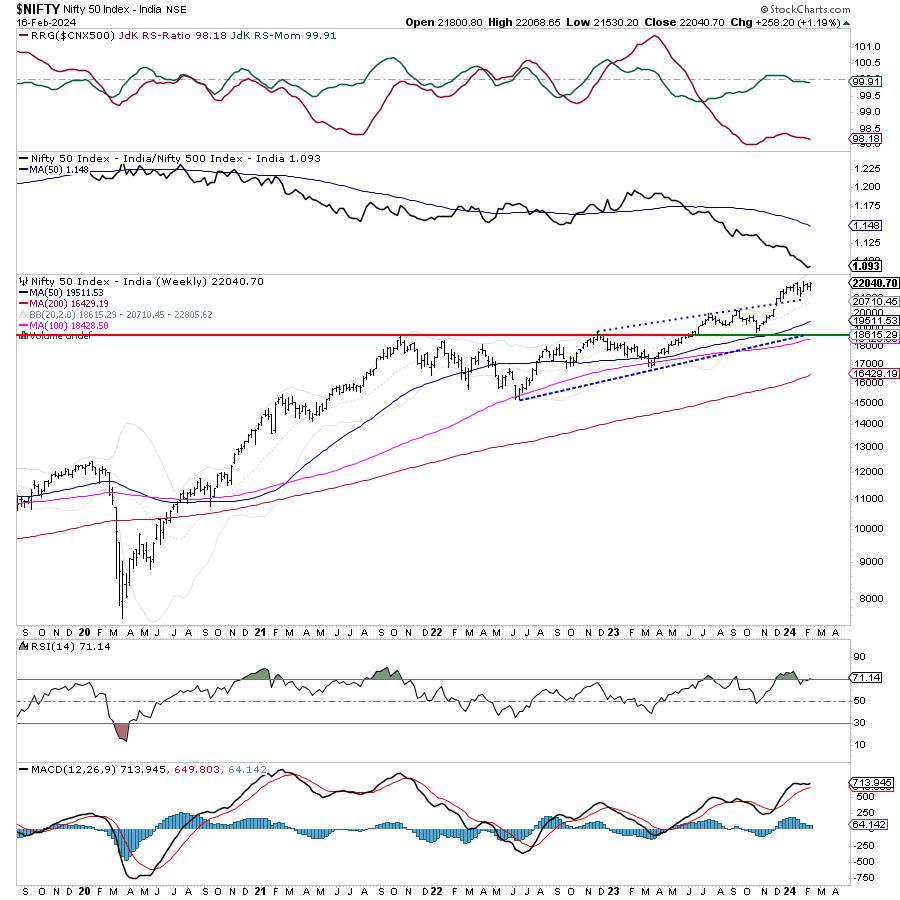
Week Ahead: NIFTY Stays In A Defined Range; Expect Directional Moves Only Outside These Levels
by Milan Vaishnav,
Founder and Technical Analyst, EquityResearch.asia and ChartWizard.ae
Some serious consolidation continued in the markets as the Nifty oscillated in a defined range before closing the week with modest gains. Examination of daily charts shows that the Nifty tested its 50-DMA again and rebounded from that level while defending that point as important support. The trading range widened...
READ MORE
MEMBERS ONLY
This Beaten-Down Magnificent Seven Stock is Poised to Regain Its Leadership Status
by Mary Ellen McGonagle,
President, MEM Investment Research
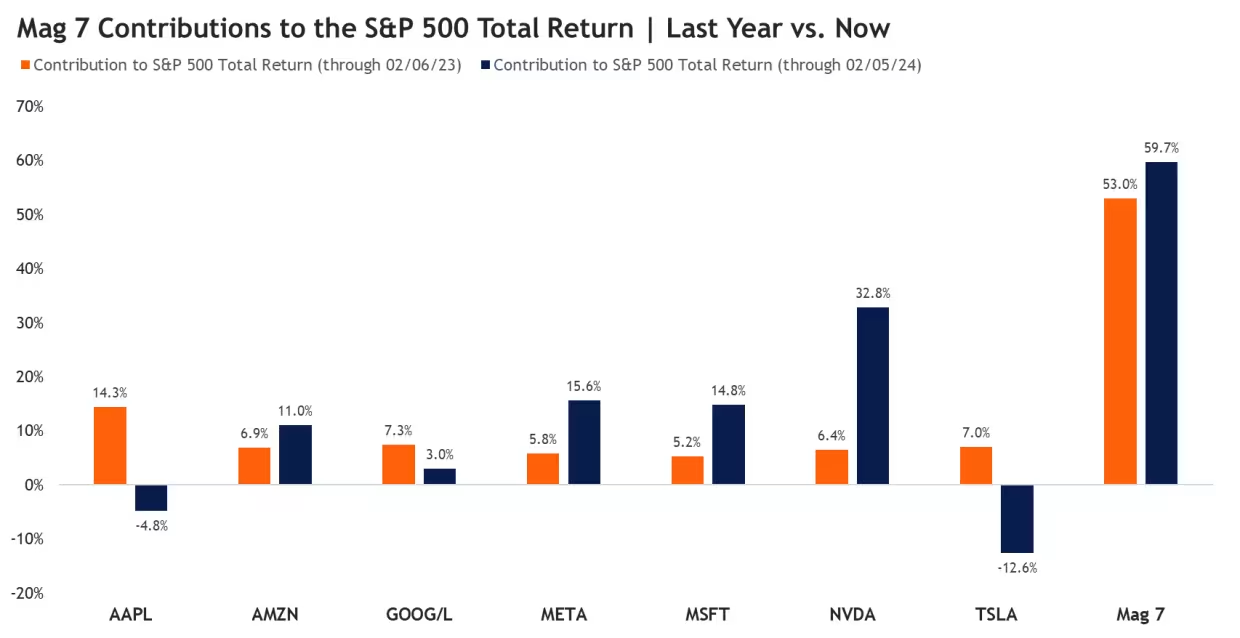
Going into last week, the Magnificent Seven stocks were looking more like the Magnificent Four. Leadership within the group became more concentrated, with Amazon, Meta, Microsoft and Nvidia having done most of the heavy lifting.
This is far different from the first 6 weeks of 2023, when gains among these...
READ MORE
MEMBERS ONLY
Three Leading Growth Stocks Testing Gap Support
by David Keller,
President and Chief Strategist, Sierra Alpha Research
KEY TAKEAWAYS
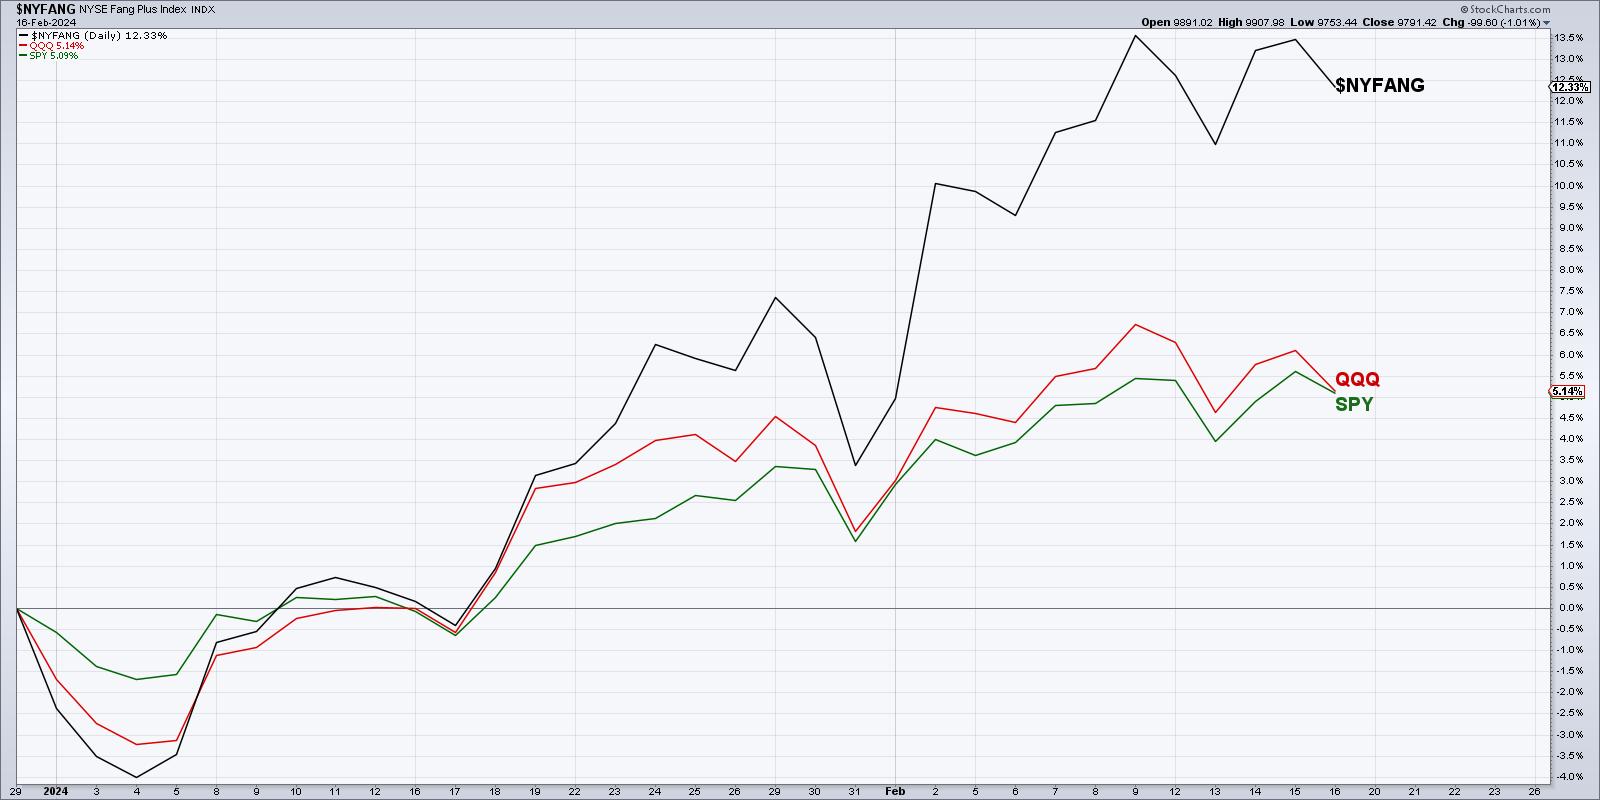
* The NYFANG+ index of leading growth stocks is up about 12% year-to-date, while the S&P 500 and Nasdaq 100 have gained only 5%.
* All three of these growth stocks show similar patterns, with a recent gap higher. But they have now all stalled out.
* If these...
READ MORE
MEMBERS ONLY
MEM TV: Risk-On Trades Emerge Amid Big Tech Selloff
by Mary Ellen McGonagle,
President, MEM Investment Research
In this episode of StockCharts TV'sThe MEM Edge, Mary Ellen reviews the sloppy week for the markets, driven by the key economic data that was released. We saw interest rates rise, which had some other carry-on impact. While the S&P 500 saw a bit of a...
READ MORE
MEMBERS ONLY

What to Do With NVDA (And Others Like It)
by David Keller,
President and Chief Strategist, Sierra Alpha Research
In this edition of StockCharts TV'sThe Final Bar, Dave answers viewer questions on the Money Flow Index, using RSP vs. SPY for relative strength analysis, strategies for names in extended uptrends like NVDA, applying Fibonacci retracements to charts like KRE, and more.
This video originally premiered on February...
READ MORE
MEMBERS ONLY

Discover the Power of These 2 Cutting-Edge Tools!
by Grayson Roze,
Chief Strategist, StockCharts.com
It's all about groups on this week's edition of StockCharts TV'sStockCharts in Focus! In this video, Grayson shows you how to take your market analysis to the next with level with some of the latest enhancements on the StockCharts platform -- new features added...
READ MORE
MEMBERS ONLY
BUY Signals Continue to Diminish
by Carl Swenlin,
President and Founder, DecisionPoint.com
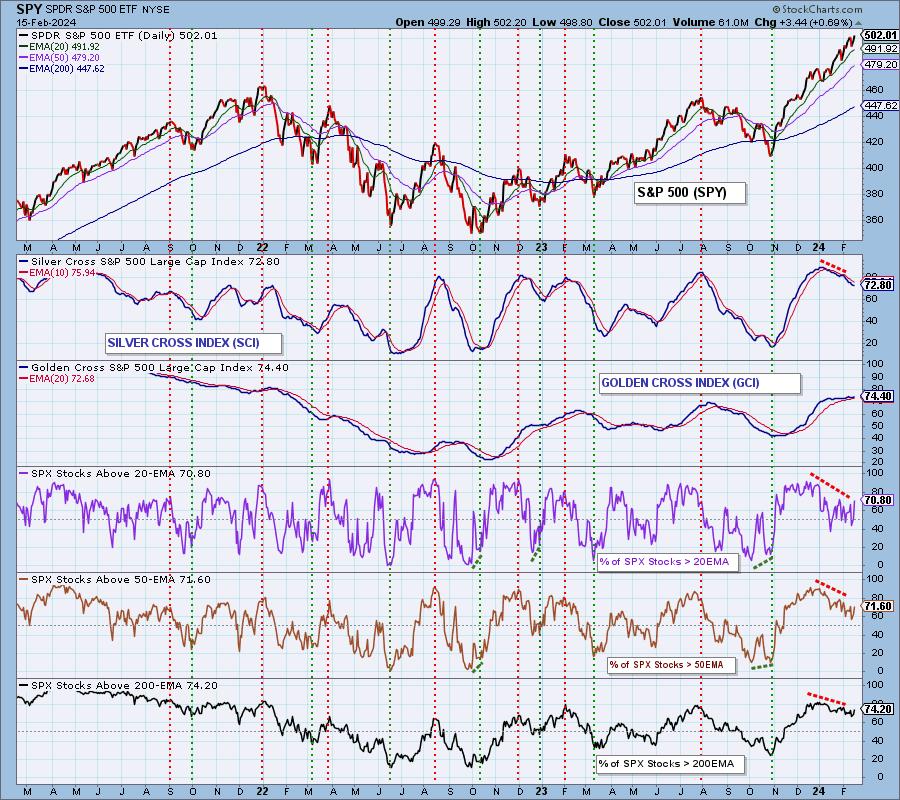
A Golden Cross BUY Signal is generated when the 50-day EMA of a price index crosses up through its 200-day EMA. DecisionPoint's Golden Cross Index (GCI) shows the percentage of stocks in a price index that have a Golden Cross BUY Signal, and is an expression of long-term...
READ MORE