MEMBERS ONLY

Home Prices and Stocks | Focus on Stocks: February 2024

by Larry Williams,
Veteran Investor and Author
Let's begin this month with a look at ...
Home Prices and Stocks
Most people have the majority of their money in homes and/or stocks. Thus, I thought that this month, I would take a look at what should be happening in the real estate market.
Let'...
READ MORE
MEMBERS ONLY

S&P 500 Falls, Nears First Support Level -- How Much Lower Can It Go?

by Jayanthi Gopalakrishnan,
Director of Site Content, StockCharts.com
KEY TAKEAWAYS
* The Fed leaves interest rates unchanged as expected, but investors weren't happy
* S&P 500, Dow Jones Industrial Average, and Nasdaq Composite all close lower after Fed decision
* The 10-year Treasury yield falls to a three week low
Will the Fed cut interest rates at...
READ MORE
MEMBERS ONLY
Betting Against the Fed is RISKY!

by David Keller,
President and Chief Strategist, Sierra Alpha Research
In this edition of StockCharts TV'sThe Final Bar, Tony Dwyer of Canaccord Genuity shares insights on today's Fed meeting and what data he's following to anticipate rate cuts through 2024. Dave tracks mega cap growth stocks, including MSFT and GOOGL, which are in pullback...
READ MORE
MEMBERS ONLY
Post Tech Earnings & FOMC -- Give Retail Investors Credit
Although Microsoft and Alphabet, Inc. reported better-than-expected earnings after hours, and then with follow-up during the trading session, sellers came out to lock in gains or perhaps go short. After all, tech has done much of the market's heavy lifting to date. The earnings were already priced in....
READ MORE
MEMBERS ONLY

Market Wisdom from the Godfather of Technical Analysis
by David Keller,
President and Chief Strategist, Sierra Alpha Research
In this edition of StockCharts TV'sThe Final Bar, legendary technical analyst Ralph Acampora, CMT visit StockCharts HQ to share lessons learned in the 1970s secular bear market, what he learned about simplicity from the late Alan Shaw, and how leadership rotation may be the theme for the coming...
READ MORE
MEMBERS ONLY
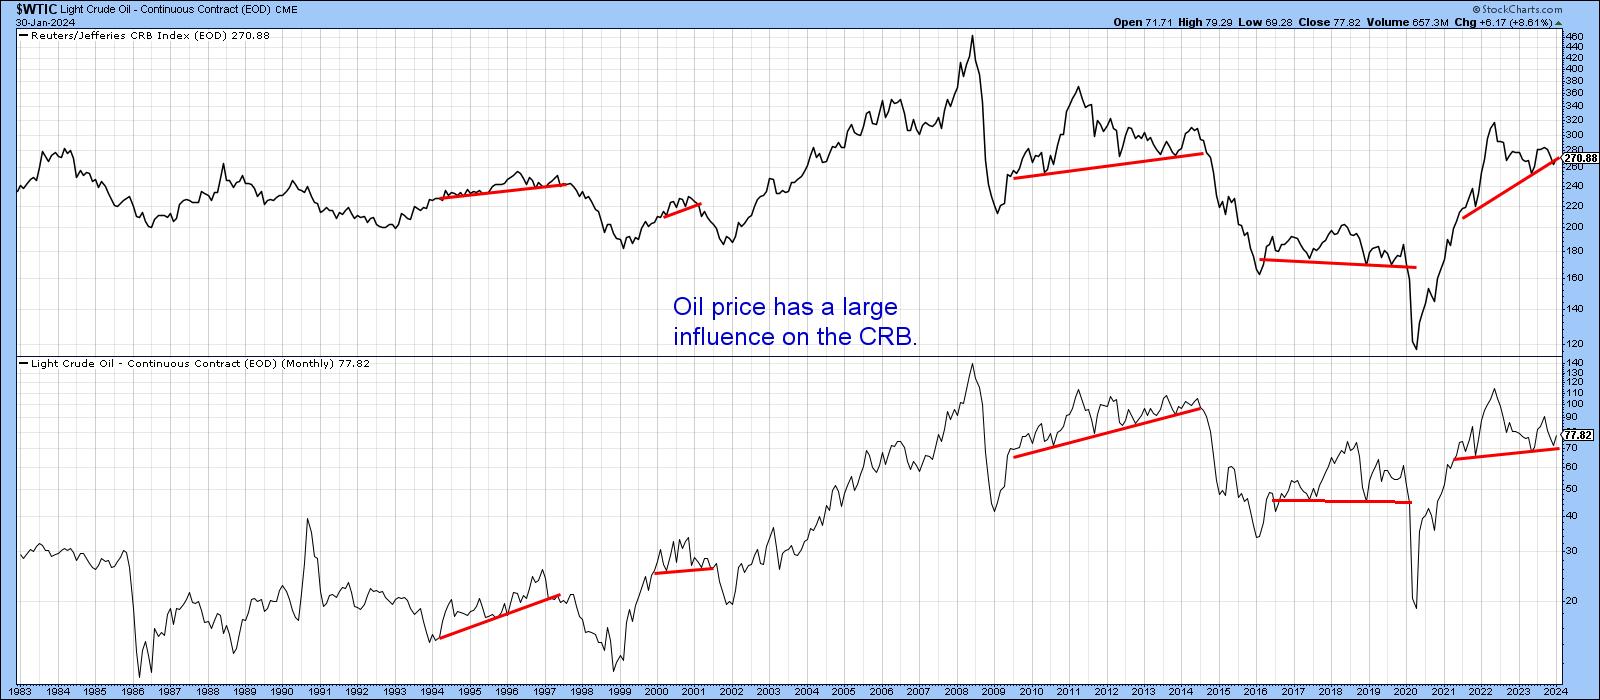
Is Oil Going Up or Down?

by Martin Pring,
President, Pring Research
Oil is not only an important commodity in and of itself, but is also one has a substantial influence on commodity indexes in general. Its weight in the CRB Composite is 23%; for energy in total, it is 39%. Chart 1 compares the oil price to the CRB Composite, where...
READ MORE
MEMBERS ONLY
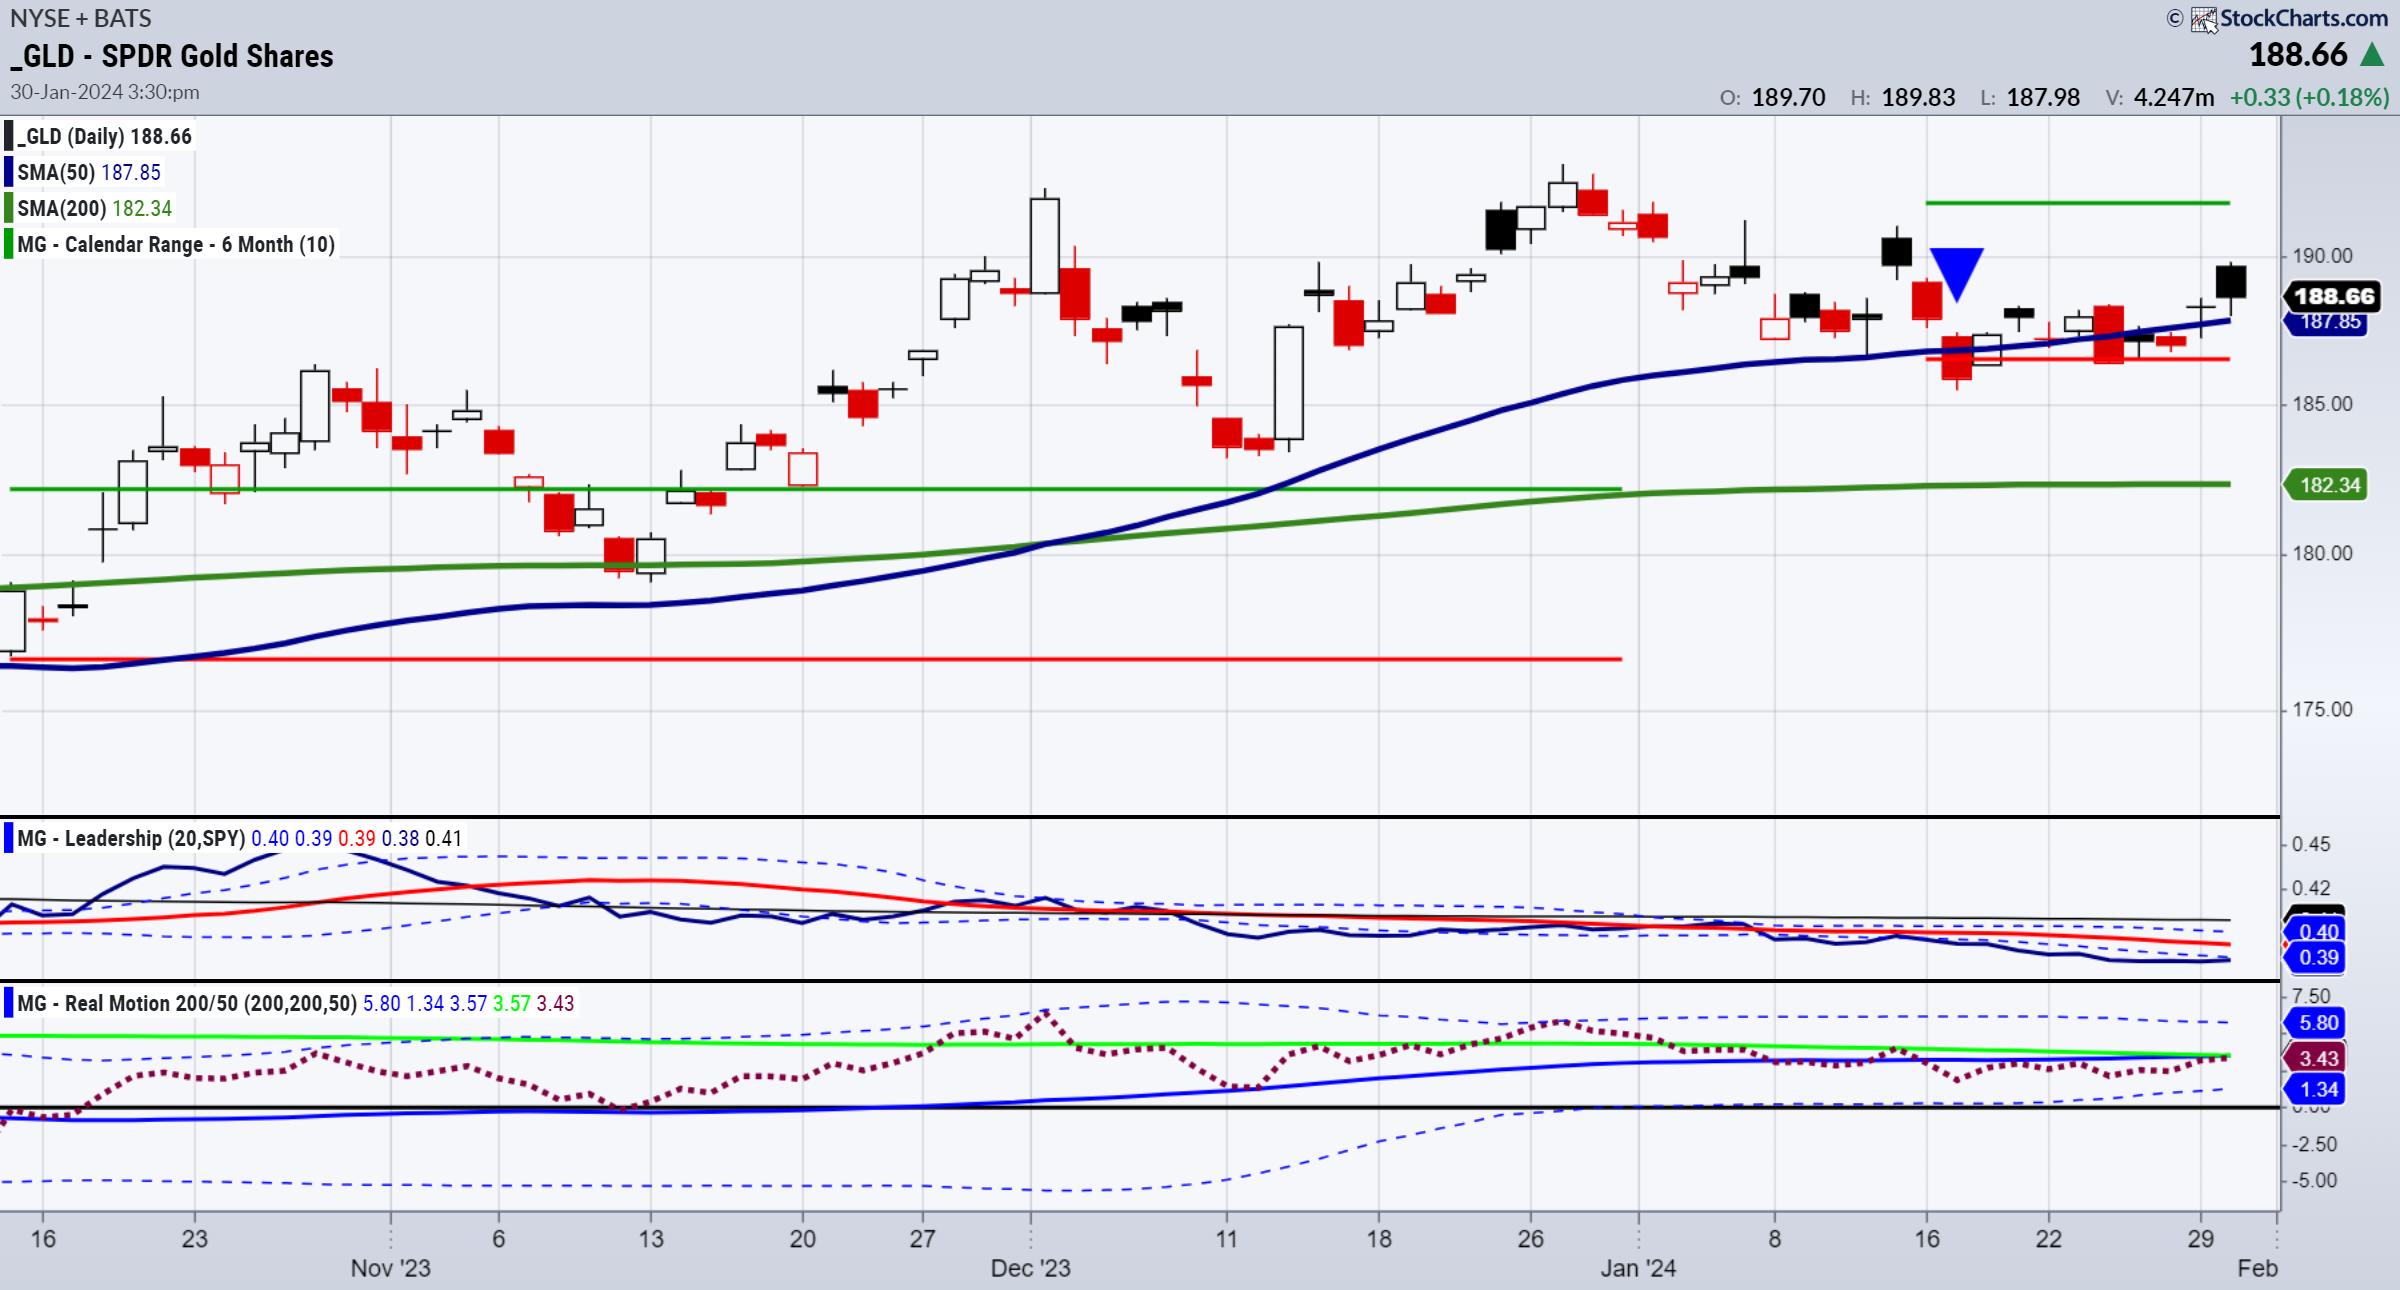
Higher Gold Price Coming, But Investors Must Be Patient
For today, I am reprinting an interview I did for Kitco News with Neils Christensen, written by Neils.
(Kitco News) - The gold market remains in a solid holding pattern as it waits for some direction from the Federal Reserve, and one market strategist is warning potential precious metals investors...
READ MORE
MEMBERS ONLY

Sector Spotlight: The Market is Moving Higher, BUT Avoid Real Estate in February!

by Julius de Kempenaer,
Senior Technical Analyst, StockCharts.com
On this episode of StockCharts TV's Sector Spotlight, after a quick look at asset class rotation and sector rotation for US stocks, I dive into a comparison of cap-weighted sectors vs. equal-weighted sectors and find a big difference for the Consumer Discretionary sector, which underscores and supports the...
READ MORE
MEMBERS ONLY
Will Catalysts Push Markets HIGHER or Drag Them LOWER?
by David Keller,
President and Chief Strategist, Sierra Alpha Research
In this edition of StockCharts TV'sThe Final Bar, Dave tracks the S&P 500 as it pushes to a new high above 4900, while the McClellan Oscillator rotates to a bullish reading. He breaks down earnings plays this week, including XOM, MSFT, and more.
This video originally...
READ MORE
MEMBERS ONLY
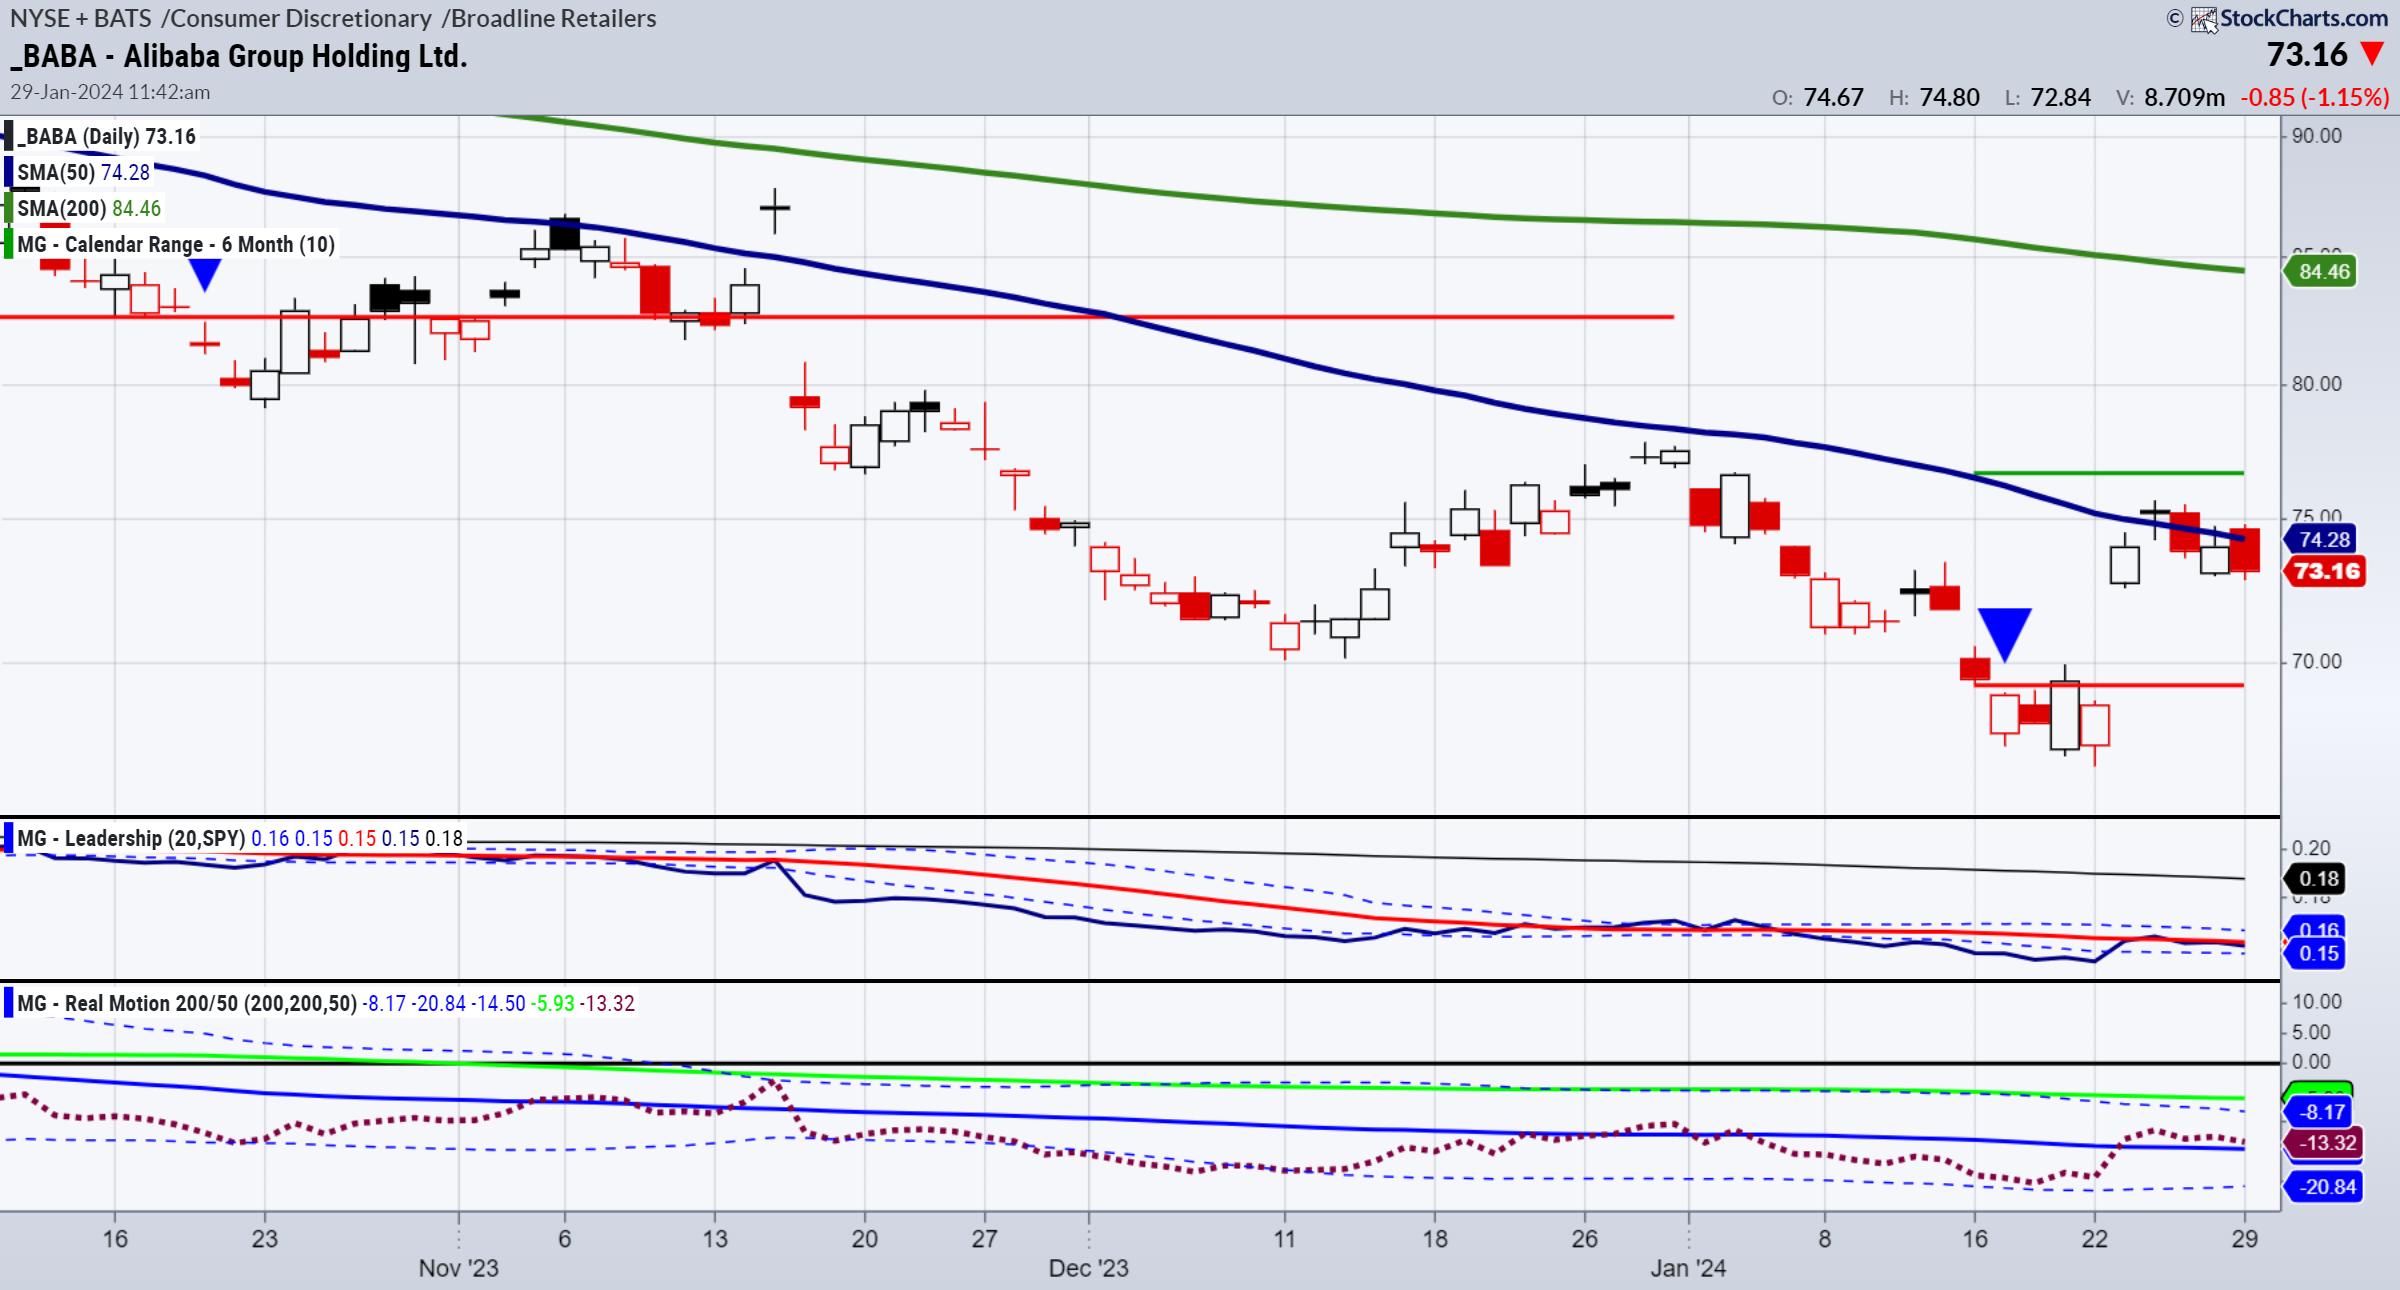
A Word and A Chart About and On Alibaba
Alibaba.com is one of the world's largest wholesale marketplaces.
To be honest, I had never gone to their website until today, even though we bought shares in BABA 2 weeks ago. So, in case you are like me and have not checked them out, they sell a...
READ MORE
MEMBERS ONLY
Earnings Preview: The Technical Temperature

by Erin Swenlin,
Vice President, DecisionPoint.com
KEY TAKEAWAYS
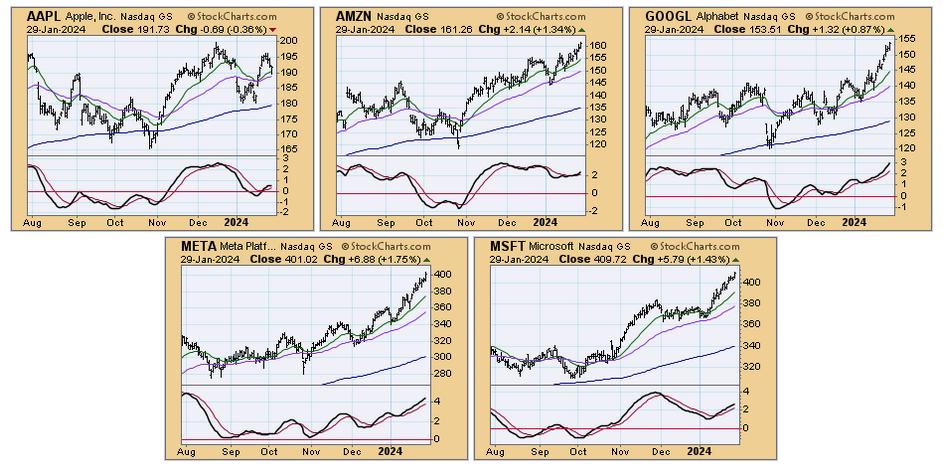
* Big Week in Earnings
* Magnificent 7 - Five Reporting (MSFT, GOOGL, META, AAPL and AMZN
* Other stocks we look at: PFE, SBUX, AMD, MA, BA, MET, MRK, XOM and CVX
* Even more coverage with viewer symbol requests
This is a big week for earnings so Carl and Erin...
READ MORE
MEMBERS ONLY
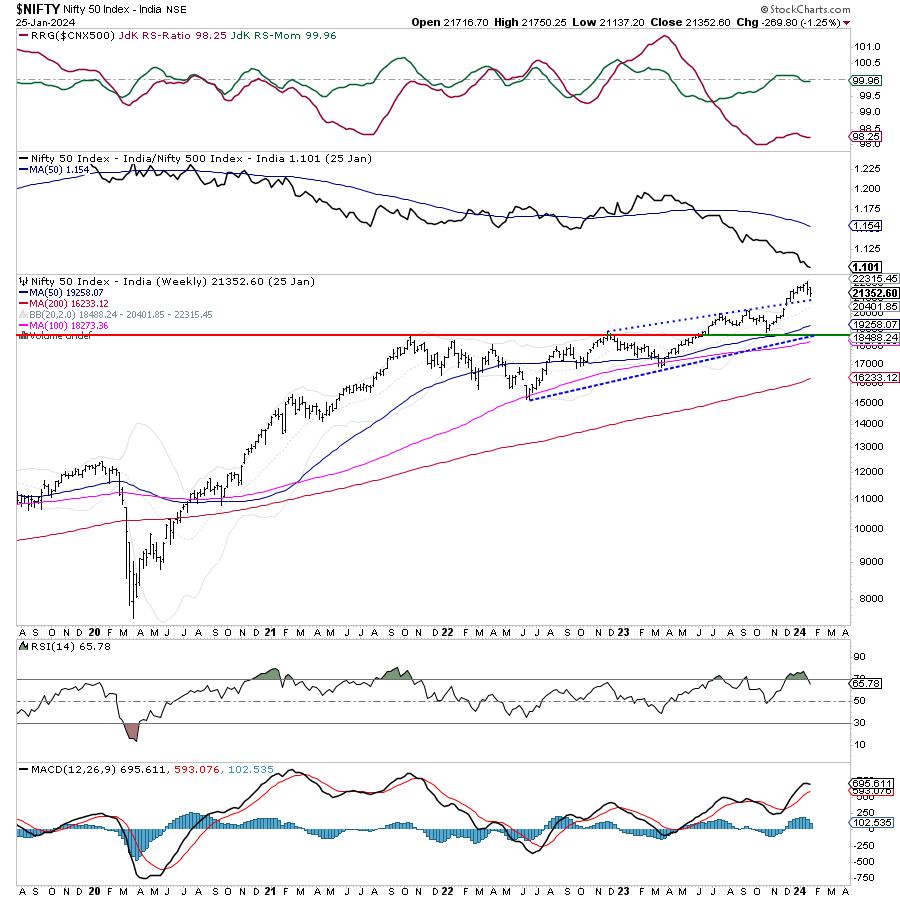
Week Ahead: NIFTY May See Sharp Moves; Volatility May Spike Over The Coming Days

by Milan Vaishnav,
Founder and Technical Analyst, EquityResearch.asia and ChartWizard.ae
The previous week was reduced to just a short 3-day trading week as Monday was declared a special holiday while on Friday, the markets remained shut on account of Republic Day. Despite this, the markets remained extremely choppy and traded in a much wider range as they continued to decline...
READ MORE
MEMBERS ONLY
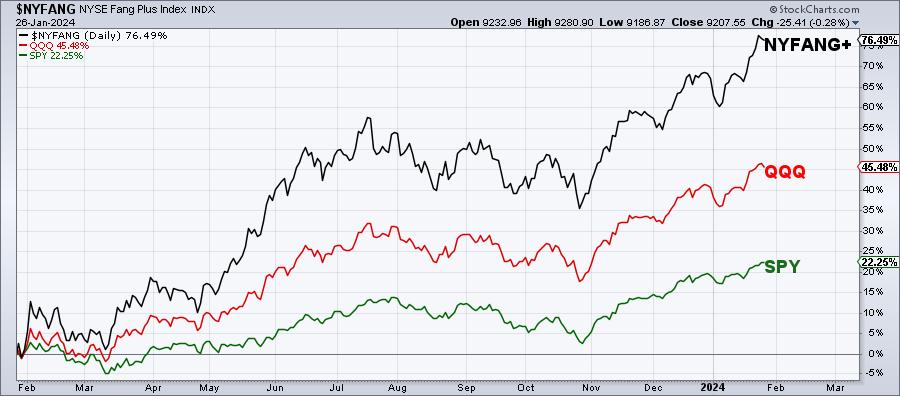
Magnificent 7 Stocks: Overheated or Just Getting Started?
by David Keller,
President and Chief Strategist, Sierra Alpha Research
One of the key themes, if not THE theme, of 2023 was the dominance of the mega-cap growth trade. The Magnificent 7 stocks handily outperformed our equity benchmarks through the course of 2023, and, so far in 2024, it's been more of the same.
With Netflix (NFLX) gapping...
READ MORE
MEMBERS ONLY
MEM TV: Market Uptrend Endures Ahead of BIG Earnings Next Week!

by Mary Ellen McGonagle,
President, MEM Investment Research
In this episode of StockCharts TV'sThe MEM Edge, Mary Ellen reviews where the markets stand as we head into earnings from MSFT, GOOGL, AAPL and META. She also discusses how ETFs can help you refine your trading strategies and stock selection, then shares base breakouts and downtrend reversal...
READ MORE
MEMBERS ONLY

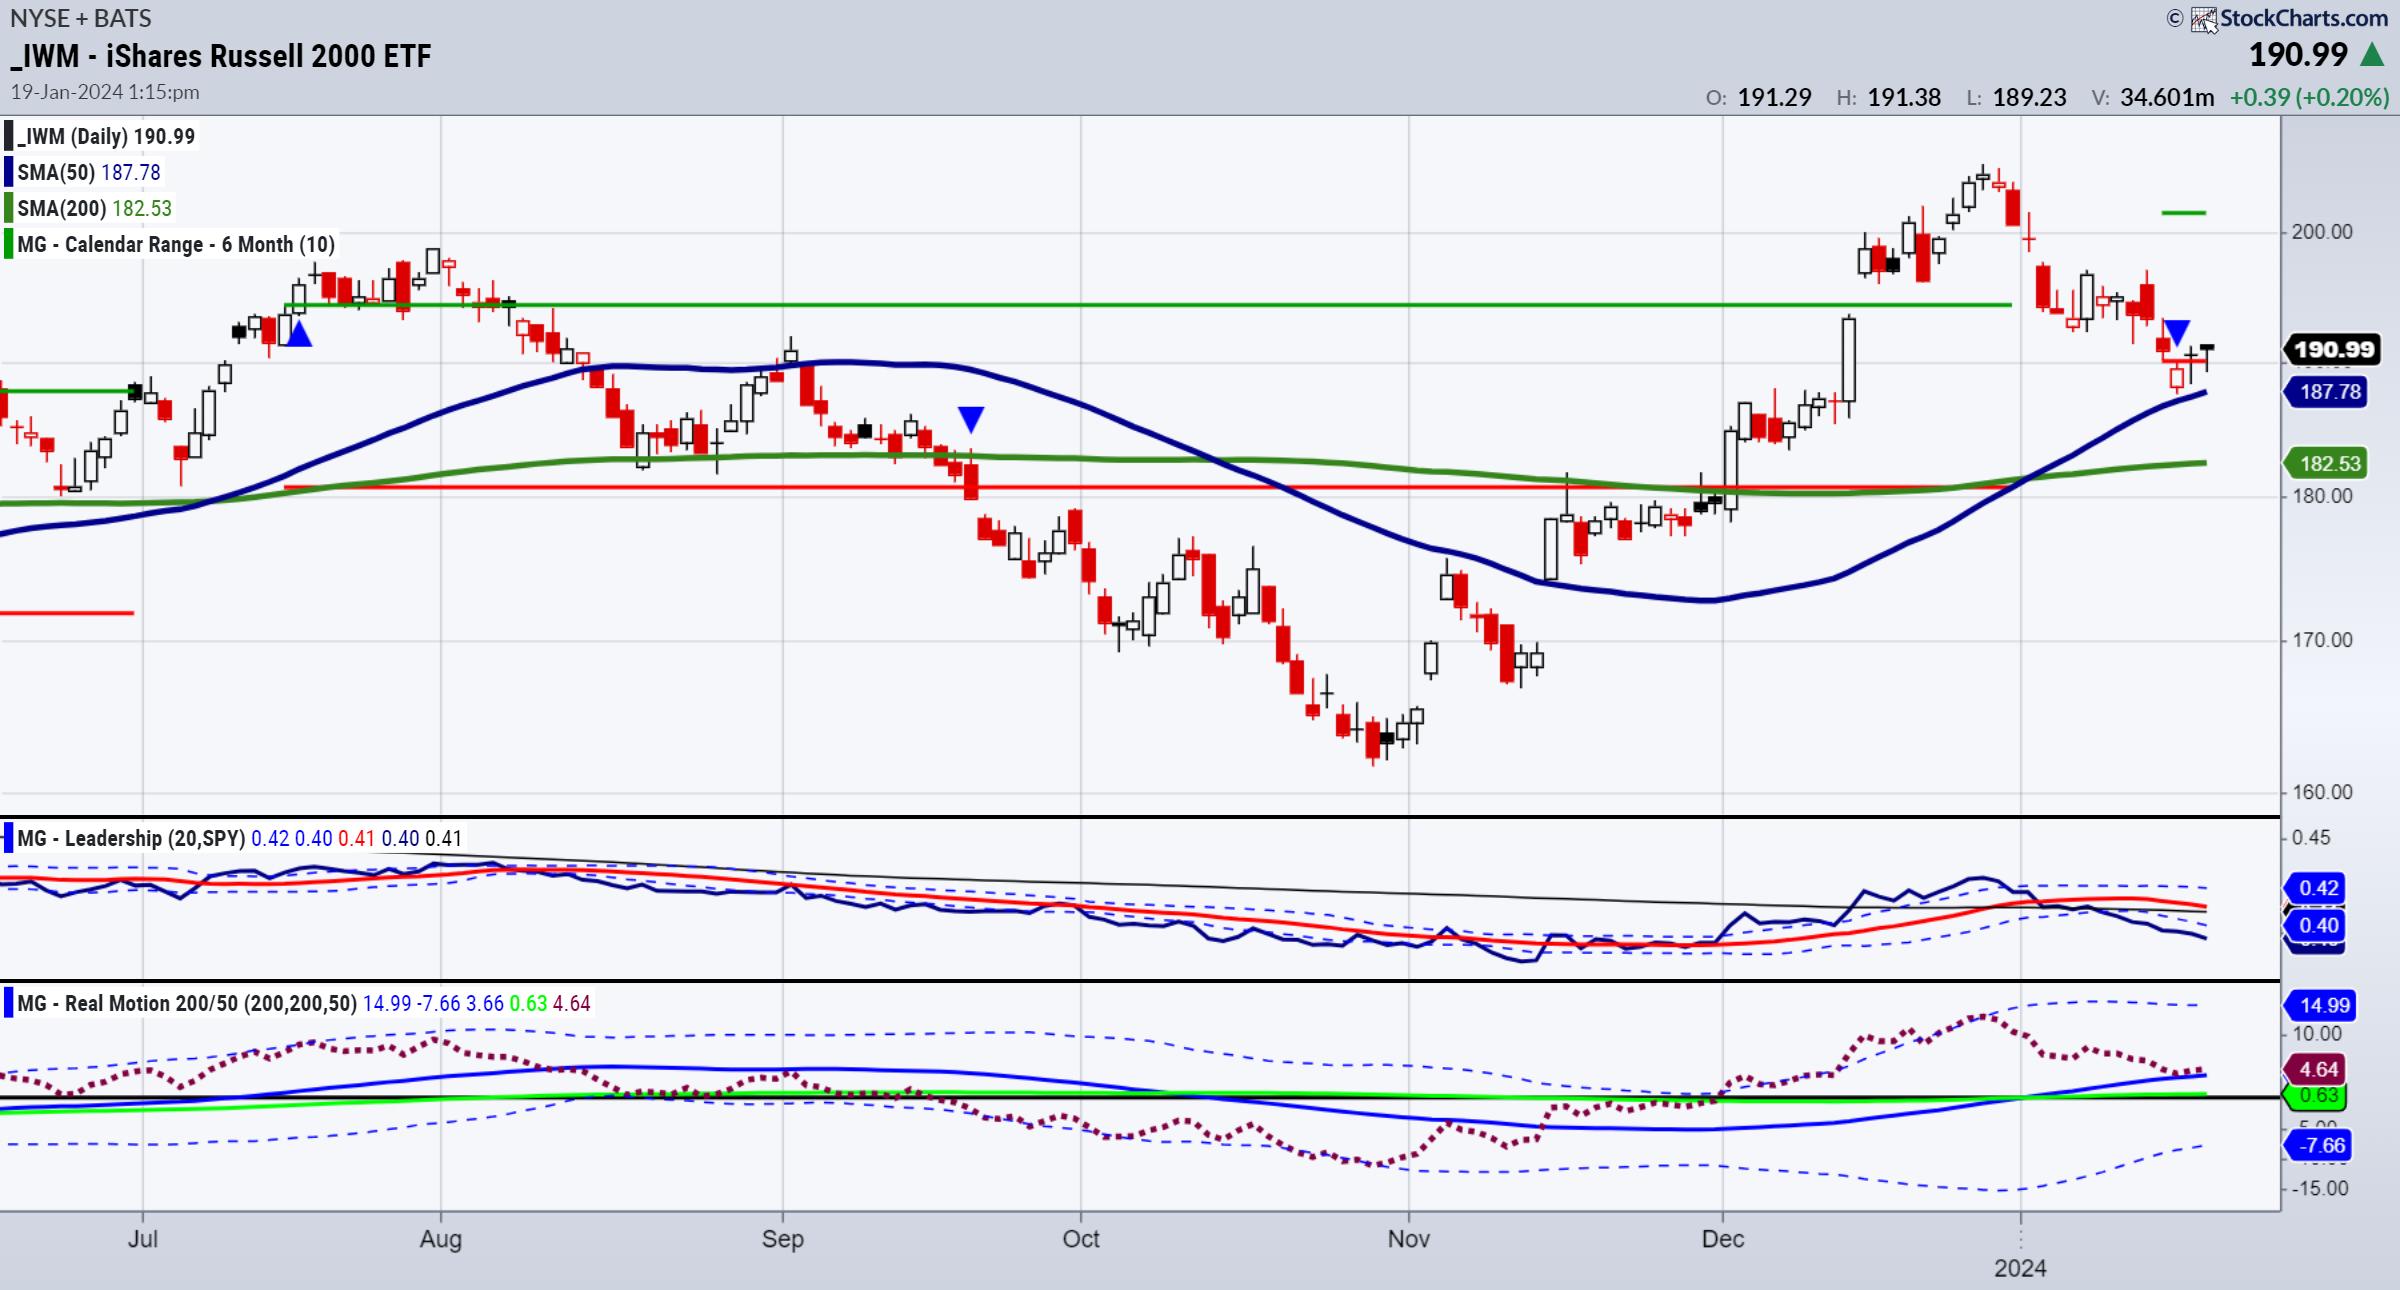
Is This a Breakout or a Pullback?

by TG Watkins,
Director of Stocks, Simpler Trading
On this week's edition of Moxie Indicator Minutes, TG points out that the IWM is right in the middle of a range and he wants to hear from you as to which way you think it will go first. Beyond that, the overall picture of the market is...
READ MORE
MEMBERS ONLY

Stock Market Indexes Keep Setting New Highs: How Much Higher?
by Jayanthi Gopalakrishnan,
Director of Site Content, StockCharts.com
KEY TAKEAWAYS
* The S&P notched new record highs in five consecutive trading sessions but snapped the winning streak on Friday
* Investors still are complacent, as indicated by the CBOE Volatility index
* The benchmark 10-year Treasury yield remains within a 4% to 4.2% range
In the first week...
READ MORE
MEMBERS ONLY
How to Avoid Huge Drawdowns from High-Flying Stocks
by David Keller,
President and Chief Strategist, Sierra Alpha Research
In this edition of StockCharts TV'sThe Final Bar, Dave hosts an all-mailbag episode, answering viewer questions on the Relative Strength Index (RSI), how ETFs like QTEC have outperformed benchmarks including the Nasdaq 100, and how to avoid painful losses in leading names like NVDA, PANW, and ADBE.
This...
READ MORE
MEMBERS ONLY

Inflation Fell to the Fed's Target -- Or is That a Moving Target?
On Friday, the market woke up to great news. Mission accomplished on inflation.
Yahoo Finance reported: "The Fed's preferred inflation measure — a 'core' Personal Consumption Expenditures index that excludes volatile food and energy prices — clocked in at 2.9% for the month of December, beating...
READ MORE
MEMBERS ONLY
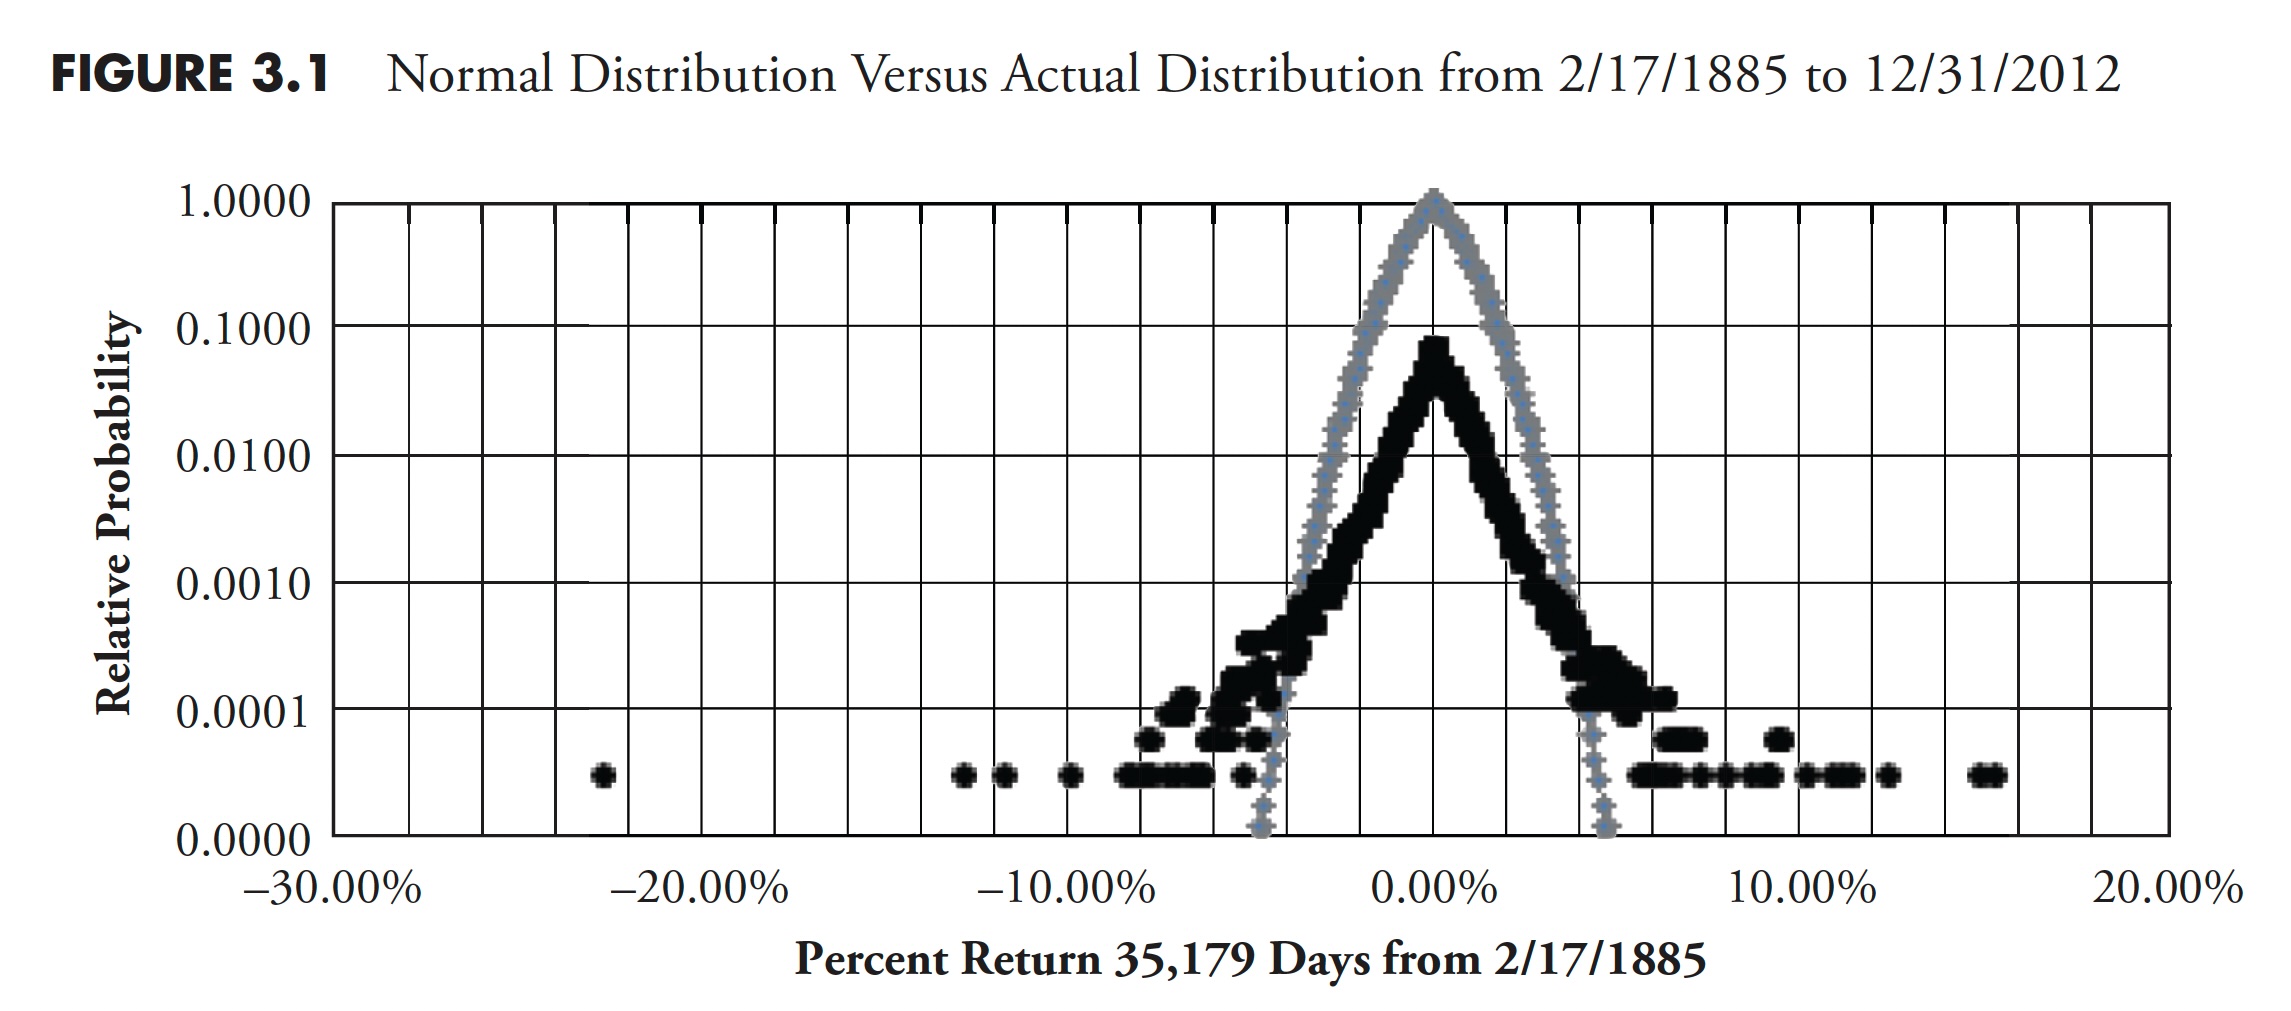
The Hoax of Modern Finance - Part 5: Flaws in Modern Financial Theory

by Greg Morris,
Veteran Technical Analyst, Investor, and Author
Note to the reader: This is the fifth in a series of articles I'm publishing here taken from my book, "Investing with the Trend." Hopefully, you will find this content useful. Market myths are generally perpetuated by repetition, misleading symbolic connections, and the complete ignorance of...
READ MORE
MEMBERS ONLY

Unlocking the Power of Technical Indicators
by David Keller,
President and Chief Strategist, Sierra Alpha Research
In this edition of StockCharts TV'sThe Final Bar, Dave breaks down the chart of Intel Corp (INTC) to demonstrate the benefits of three important technical indicators: Moving Averages, Relative Strength Index (RSI) and Relative Strength. He shares why a disciplined process of interpreting these indicators can help investors...
READ MORE
MEMBERS ONLY

PRICE IS KING in Stock Trading!

by Joe Rabil,
President, Rabil Stock Research
On this week's edition of Stock Talk with Joe Rabil, Joe shares his five steps to becoming a better stock picker. He emphasizes the importance of starting with price and using technical analysis to identify potential outperforming stocks. From analyzing monthly and weekly charts to looking at momentum...
READ MORE
MEMBERS ONLY

Macro Model Gives Mixed Signals as NFLX LIGHTS UP!
by David Keller,
President and Chief Strategist, Sierra Alpha Research
In this edition of StockCharts TV'sThe Final Bar, guest John Kosar, CMT of Asbury Research shares his proprietary Asbury Six macro model, which suggests caution based on weak fund flows and breadth conditions. Dave focuses in on crude oil and gold charts, and also reviews key earnings plays...
READ MORE
MEMBERS ONLY

What Does Dow Theory Say About This Market?
by Martin Pring,
President, Pring Research
Some tools in technical analysis are totally objective, such as a moving average crossover. It may be debatable whether it's a decisive signal or not, but a crossover is nevertheless a crossover. Dow Theory, on the other hand, is much more subjective and, therefore, open to interpretation. For...
READ MORE
MEMBERS ONLY

Remember Those 3 Signs of Inflation to Watch?
As a follow-up to a daily I wrote earlier in January called "Super Cycles Do Not Just Fade Away",yesterday'sJanuary 23rd dailywas all about one of the three indicators that can get us prepared for more inflation.
On January 5th, sugar was still trading under 22...
READ MORE
MEMBERS ONLY

S&P 500 Still SUPER Undervalued!
by David Keller,
President and Chief Strategist, Sierra Alpha Research
In this edition of StockCharts TV'sThe Final Bar, guest Ari Wald, CFA CMT of Oppenheimer lays out a bull case for the S&P 500 based on valuations and forward returns given strong breadth conditions. Dave reviews stocks reporting earnings this week, including LOGI, LMT, PG, DHI,...
READ MORE
MEMBERS ONLY
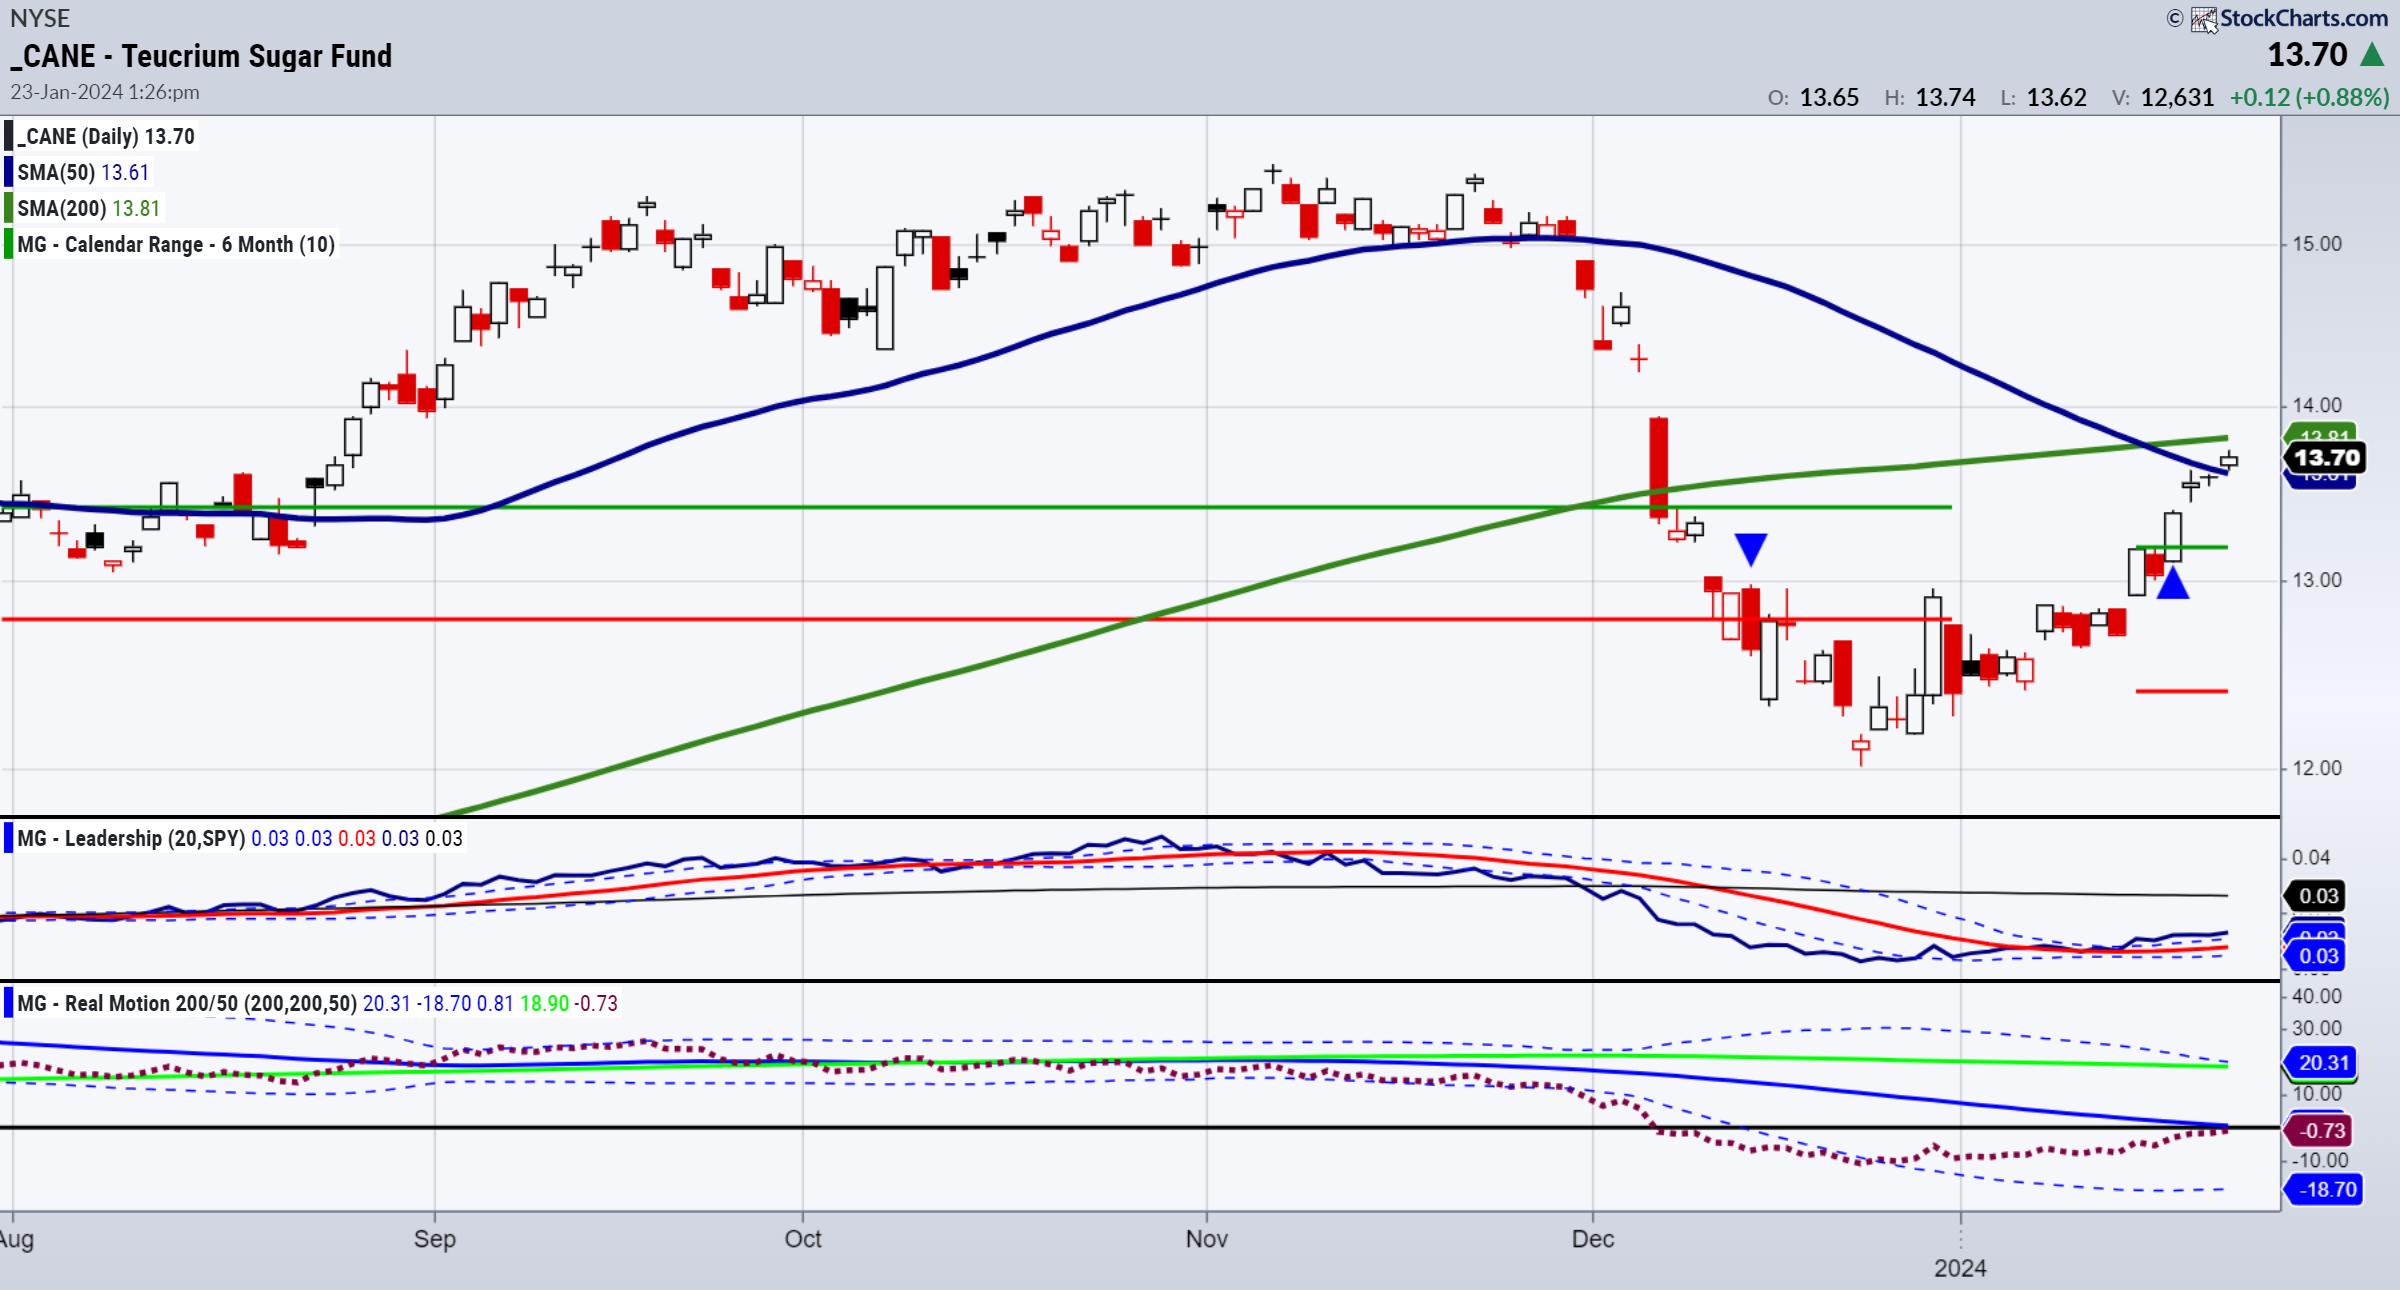
Time for Sweet Talk: Sugar Futures
The biggest mover so far in one month's time is sugar futures, up over 16%.
As I am a big follower of weather patterns and have predicted weather could be a huge factor on several crops this year, one major concern for sugar is that the current El...
READ MORE
MEMBERS ONLY

Sector Spotlight: US Stocks Once Again Lead the World
by Julius de Kempenaer,
Senior Technical Analyst, StockCharts.com
On this episode of StockCharts TV's Sector Spotlight, I highlight the short-term weakness in BTC, the price strength in USD, and the clear strength of stocks over all other asset classes. In sectors, I analyze the continuing rotation out of defensive sectors, which is another positive for stocks...
READ MORE
MEMBERS ONLY

Economic Modern Family Has Divisive Weekly Charts
Over the weekend, I covered the daily charts on the Economic Modern Family, featuring the Russell 2000 (IWM) and Retail (XRT). Both are lagging the benchmark and in the middle of their January trend calendar ranges.
As Semiconductors, NASDAQ, the Dow, and S&P 500 continue to post new...
READ MORE
MEMBERS ONLY

Small Caps Surge Higher As S&P 500 Stalls
by David Keller,
President and Chief Strategist, Sierra Alpha Research
In this edition of StockCharts TV'sThe Final Bar, Dave observes the S&P 500 index pressing higher after achieving new all-time highs on Friday. While large caps have dominated small caps so far in January, days like today suggest small-cap strength as a potential emerging trend. He...
READ MORE
MEMBERS ONLY

MEM TV: Tech Stocks Blast Higher! S&P 500 Bull Market Confirmed!
by Mary Ellen McGonagle,
President, MEM Investment Research
In this episode of StockCharts TV'sThe MEM Edge, Mary Ellen reviews the bullish price action in the markets and shares her longer-term outlook. She also highlights the primary driver of last week's rally and which areas and stocks pushed the S&P 500 higher. In...
READ MORE
MEMBERS ONLY

Three Behavioral Biases You're Probably Struggling With Right Now
by David Keller,
President and Chief Strategist, Sierra Alpha Research
I've spent much of my career helping investors become more like pilots. Why is this such an important mindset to adopt? Well, pilots have to maintain good situational awareness, understanding what is happening around them. They need to make difficult decisions and recognize when conditions are changing. And,...
READ MORE
MEMBERS ONLY
Don't Ignore This Unusual Event on the Market's March to New Highs
by Mary Ellen McGonagle,
President, MEM Investment Research
The S&P 500 gained 1.1% last week in a move that puts this Index at a record high. While this is exciting news for investors, those that owned some of last week's top performers are in even better spirits, as the average gain for the...
READ MORE
MEMBERS ONLY

Dow Jones and S&P 500 Close At Record High -- Time to Add Tech Stocks To Your Portfolio?
by Jayanthi Gopalakrishnan,
Director of Site Content, StockCharts.com
KEY TAKEAWAYS
* Dow Jones Industrial Average and S&P 500 close at record highs
* Technology stocks are back in the spotlight, with the Nasdaq 100 closing up 1.95%
* Keep an eye on momentum and volatility as earnings reports continue to pour in
Tech stocks are striking back after...
READ MORE
MEMBERS ONLY

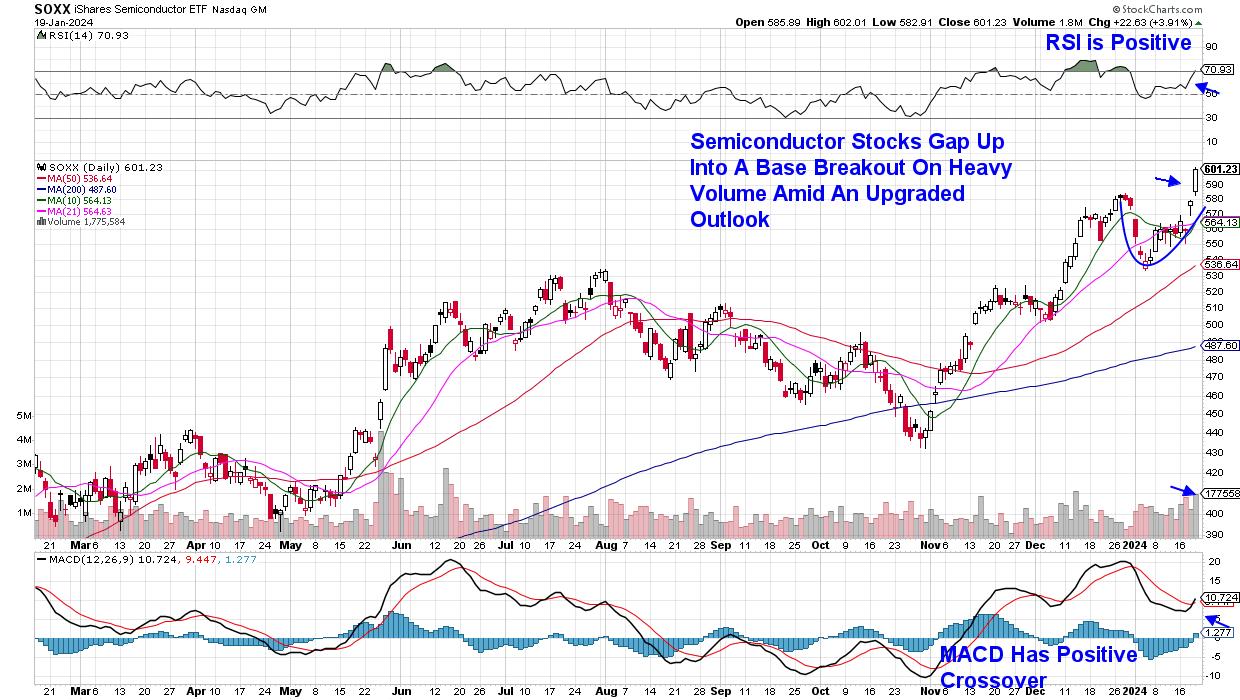
Tech and Semis Leading from the Dip
by TG Watkins,
Director of Stocks, Simpler Trading
The market was severely overbought going into the new year, so some steam was left off, which, as TG Watkins notes, we can see in the breadth readings. Now with notable names in the tech space leading and taking off, its time to get back in and see if the...
READ MORE
MEMBERS ONLY

These Stocks Have the HIGHEST PROBABILITY of Being Big Winning Trades -- and You Can Find 'Em in One Click

by Grayson Roze,
Chief Strategist, StockCharts.com
On this week's edition of StockCharts TV'sStockCharts in Focus, Grayson shows you the simplest way to find the market's strongest stocks with the highest probability of becoming big winners -- the Sample Scan Library. With this tool, you can scan for stocks making new...
READ MORE
MEMBERS ONLY
Economic Modern Family's Engine Idles While Growth Goes Fast and Furious
Let's get right to it. The charts and our tools are telling.
To start, I always look at moving averages and phases. Then I look at Real Motion and momentum to see if there is a divergence to price. After that, I check out our Leadership indicator which...
READ MORE
MEMBERS ONLY

Viewer Questions: How Does the Fed Manipulate the Yield Curve?
by David Keller,
President and Chief Strategist, Sierra Alpha Research
In this edition of StockCharts TV'sThe Final Bar, Dave hosts a special all-mailbag edition, answering viewer questions on leading vs. lagging indicators, arithmetic vs. log scale charts, and how the Fed manipulates the yield curve. He digs into specific trading strategies using RSI, MACD, On Balance Volume, and...
READ MORE
MEMBERS ONLY
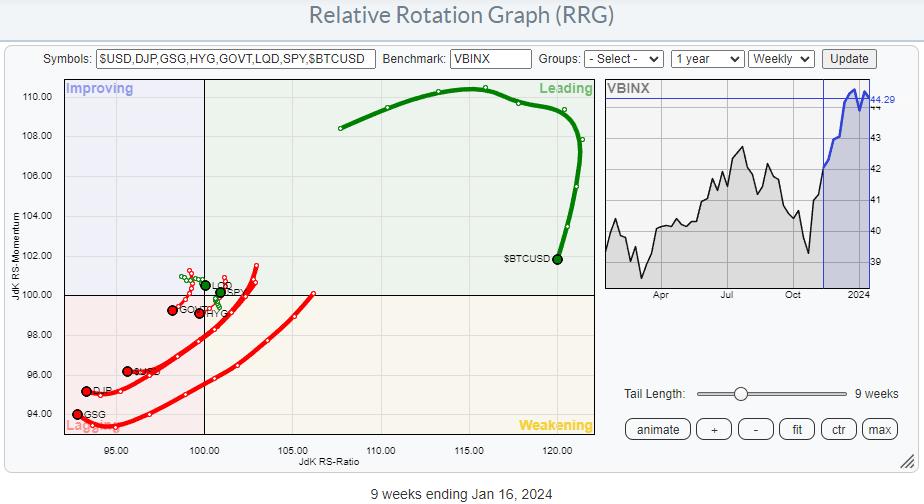
Watch Stocks Triumph in Latest Asset Allocation Battle
by Julius de Kempenaer,
Senior Technical Analyst, StockCharts.com
KEY TAKEAWAYS
* Commodities and USD rotating deep inside the lagging quadrant, indicating weak relative strength
* Bitcoin is in a strong relative uptrend vs all other asset classes, but going through a corrective phase
* Stocks are the clear winner in this asset allocation battle
The RRG above shows the rotation of...
READ MORE
MEMBERS ONLY

Technology Stocks Rise, but Market Internals Look Vulnerable
by Jayanthi Gopalakrishnan,
Director of Site Content, StockCharts.com
KEY TAKEAWAYS
* Nasdaq Composite index rises 1.35% thanks to semiconductor stocks and an upgrade for Apple
* The Nasdaq Composite is trading close to its 52-week high, but market breadth isn't sharing the bullish sentiment
* Market breadth indicators, such as the advance-decline issues and percent above moving average,...
READ MORE
MEMBERS ONLY

GNG TV: Active vs. Passive Investing

by Alex Cole,
Co-founder, GoNoGo Charts®

by Tyler Wood,
Co-founder, GoNoGo Charts®
As the S&P 500 digests the rally to all time highs, Alex and Tyler take a look at GoNoGo Trend® conditions of several areas of the market on this edition of the GoNoGo Charts show. Amongst US equity indices, the Nasdaq and S&P offer more constructive...
READ MORE
