MEMBERS ONLY

Supercharge Your SUCCESS with The Ultimate List of Prebuilt Charts

by Grayson Roze,
Chief Strategist, StockCharts.com
On this week's edition of StockCharts TV'sStockCharts in Focus, Grayson kicks off the New Year by hooking you up with every chart you could ever need, and you don't have to create a single one yourself! In just a couple of clicks, you can...
READ MORE
MEMBERS ONLY
Hot Jobs Data Sends Stock Market Seesawing, Ending Nine-Week Winning Streak

by Jayanthi Gopalakrishnan,
Director of Site Content, StockCharts.com
KEY TAKEAWAYS
* The stock market indices closed higher for the day but ended the week lower
* The 10-year Treasury yield closed higher at 4.04%
* In spite of the pullback in equities, the stock market indices are still looking technically strong
You can't blame the market for taking...
READ MORE
MEMBERS ONLY

Super Cycles Do Not Just Fade Away
On inflation
I like this quote-
"Goods deflation likely transitory as downward pressure on goods demand and input costs are fading. 1H24 global core inflation likely to settle near 3%, which won't resolve the immaculate disinflation debate."
And this quote does not include the steep rise...
READ MORE
MEMBERS ONLY

Earnings for 2023 Q3 Show Market Still Overvalued

by Carl Swenlin,
President and Founder, DecisionPoint.com
S&P 500 earnings are in for 2023 Q3, and here is our valuation analysis.
The following chart shows the normal value range of the S&P 500 Index, indicating where the S&P 500 would have to be in order to have an overvalued P/E...
READ MORE
MEMBERS ONLY

SPY Resting at Support, But Financials Showing Strength

by Julius de Kempenaer,
Senior Technical Analyst, StockCharts.com
KEY TAKEAWAYS
* SPY is testing, maybe breaking, short-term support
* Next support in 455 area
* Financials sector tails on daily and weekly RRG moving back in sync
* All banks inside the leading quadrant
HAPPY NEW YEAR!!! (I guess that is still allowed on day 5...)
Let's kick off the...
READ MORE
MEMBERS ONLY

Growth Stocks Drop Again -- and That's Just the Beginning?!?

by David Keller,
President and Chief Strategist, Sierra Alpha Research
In this edition of StockCharts TV'sThe Final Bar, guest Jeff Huge, CMT of JWH Investments speaks to how extreme breadth conditions, sky-high valuations and overly bullish sentiment readings could indicate the beginning of a bear phase in 2024. Dave highlights two value sectors showing renewed signs of strength...
READ MORE
MEMBERS ONLY

GNG TV: Remaining Objective About Trading Rules is CRITICAL!

by Alex Cole,
Co-founder, GoNoGo Charts®

by Tyler Wood,
Co-founder, GoNoGo Charts®
In this edition of the GoNoGo Charts show, Alex and Tyler take a look at the GoNoGo Trend® conditions of several key areas of the market. The seasonal roadmap of 2023 may be overemphasized by many market commentators, and remaining objective about trading rules is critical in times like these....
READ MORE
MEMBERS ONLY
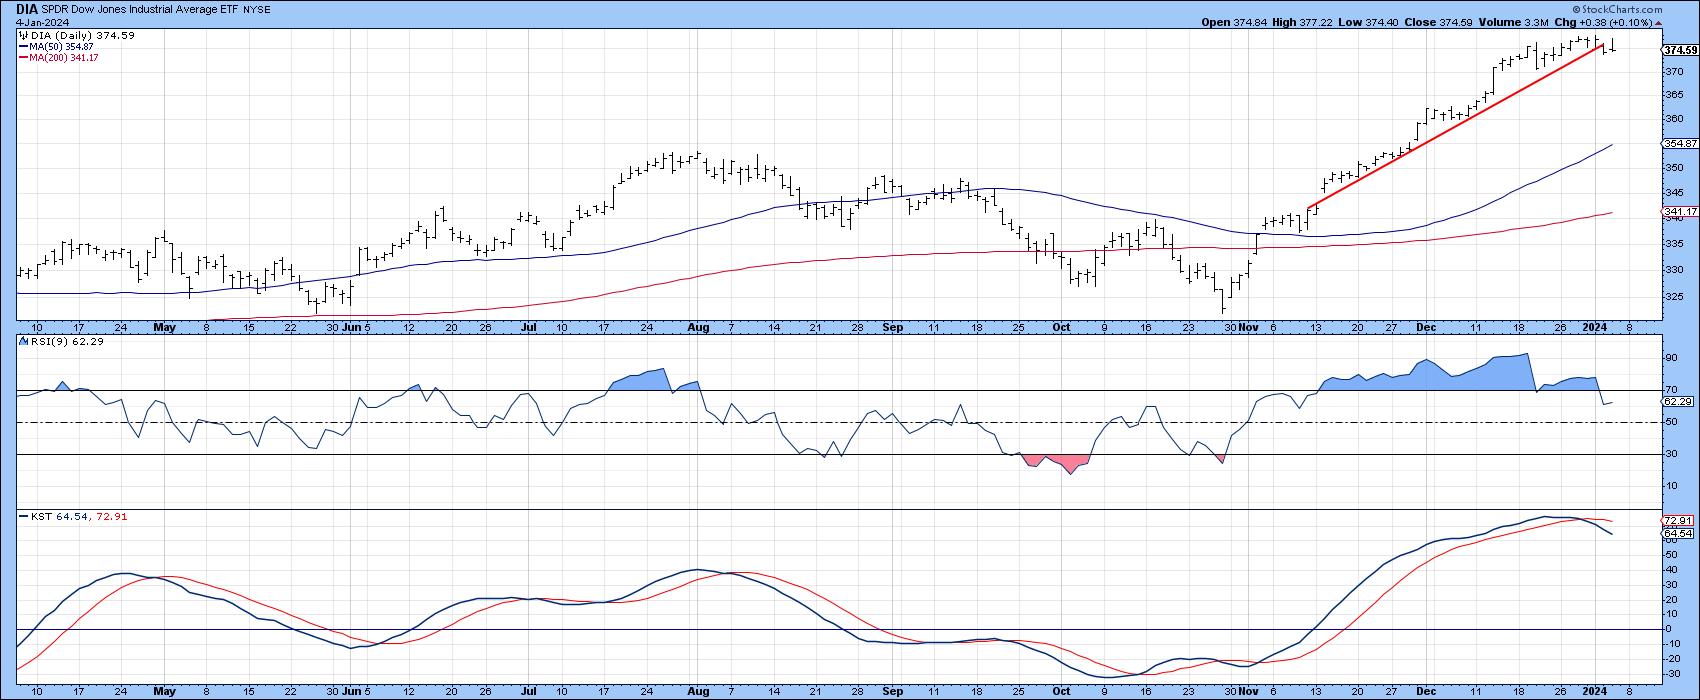
Three Intermarket Relationships to Watch in Early 2024

by Martin Pring,
President, Pring Research
It has been a great rally, but this week has seen the DJIA violate its post November up trendline. In addition, the 9-day RSI has retreated below its 70 overbought zone for the first time since early November, and the daily KST has triggered a sell signal. Is it time...
READ MORE
MEMBERS ONLY

Discover the Hottest Sectors of 2024!

by Joe Rabil,
President, Rabil Stock Research
On this week's edition of Stock Talk with Joe Rabil, Joe explains how to use the MACD zero line in 2 consecutive timeframes to identify ideal entry zones. He presents two examples of how this pattern works and when to enter. He also examines what he is seeing...
READ MORE
MEMBERS ONLY

January: NASDAQ Has the Best Odds of Gains, BUT...
"January provides us with a wealth of information that gets our year off to a good start, financially and emotionally.
"The data is specifically chosen to begin in 2009 because that is the bottom of the most significant bear market prior to the 2022 bear market, and 2009...
READ MORE
MEMBERS ONLY

Technology Shares PLUNGE to Kick Off 2024
by David Keller,
President and Chief Strategist, Sierra Alpha Research
In this edition of StockCharts TV'sThe Final Bar, guest Mish Schneider of MarketGauge talks strength in small caps, leadership in retail, and the importance of watching junk bonds for risk-on conditions. Dave charts pullbacks in AAPL and NVDA, and shares two names pushing higher as value beats growth...
READ MORE
MEMBERS ONLY

The Science and Art of Stock Market Predictions
Over the holiday, I thought a lot about predictions and how they are formed.
The dictionary meaning of prediction is a statement about a future eventor data.Many of the predictions for 2024 that I have seen are made by what we assume are knowledgeable people in the financial fields....
READ MORE
MEMBERS ONLY

Guidelines for 2024 | Focus on Stocks: January 2024

by Larry Williams,
Veteran Investor and Author
Let's Get This Out of The Way Right Now
For the last 18 years, I've had a love affair with my annual forecast report. Until I began writing this letter, it was the only thing I did. Many of you purchased it last year, and some...
READ MORE
MEMBERS ONLY

Week Ahead: NIFTY Likely To Ring In The New Year In This Way

by Milan Vaishnav,
Founder and Technical Analyst, EquityResearch.asia and ChartWizard.ae
The equity markets have ended the year on a very strong note.
As the week comes to a close, we not only end the month, but also the year. On a monthly basis, the NIFTY has had a stellar run this December, having gained 1598 points (+7.94%). On a...
READ MORE
MEMBERS ONLY

STRONG Indicators for 2024!

by TG Watkins,
Director of Stocks, Simpler Trading
On this week's edition of Moxie Indicator Minutes, TG points out how broadly supported the market has been this time around, and how he's seeing excellent setups on the higher time frames. He walks us through some of the action that is making him look forward...
READ MORE
MEMBERS ONLY

MEM TV: Don't Miss These! TOP Sector and Industry PICKS for 2024

by Mary Ellen McGonagle,
President, MEM Investment Research
In this episode of StockCharts TV'sThe MEM Edge, join Mary Ellen as she as she dives into the latest news and trends that are driving price action in the markets. From housing updates to consumer confidence and inflationary data, she breaks it all down and shows you how...
READ MORE
MEMBERS ONLY

Unlocking Russell 2000 SECRETS & Volatility INSIGHTS!
by David Keller,
President and Chief Strategist, Sierra Alpha Research
In this special all-Mailbag edition of StockCharts TV'sThe Final Bar, Dave answers viewers' burning questions, ranging from the effectiveness of short-term moves with the 5-day MA to deciphering the mysteries of the Russell 2000's growth or value positioning and much more!
Click here to take...
READ MORE
MEMBERS ONLY

GNG TV: GO TRENDS Emerging Across the Globe!
by Alex Cole,
Co-founder, GoNoGo Charts®
by Tyler Wood,
Co-founder, GoNoGo Charts®
In this edition of the GoNoGo Charts show, as the S&P 500 continues trading at all-time highs on this final trading day of the year, Alex and Tyler take a look at GoNoGo Trend® conditions across asset classes, style boxes, and emerging markets indices. The conditions in the...
READ MORE
MEMBERS ONLY
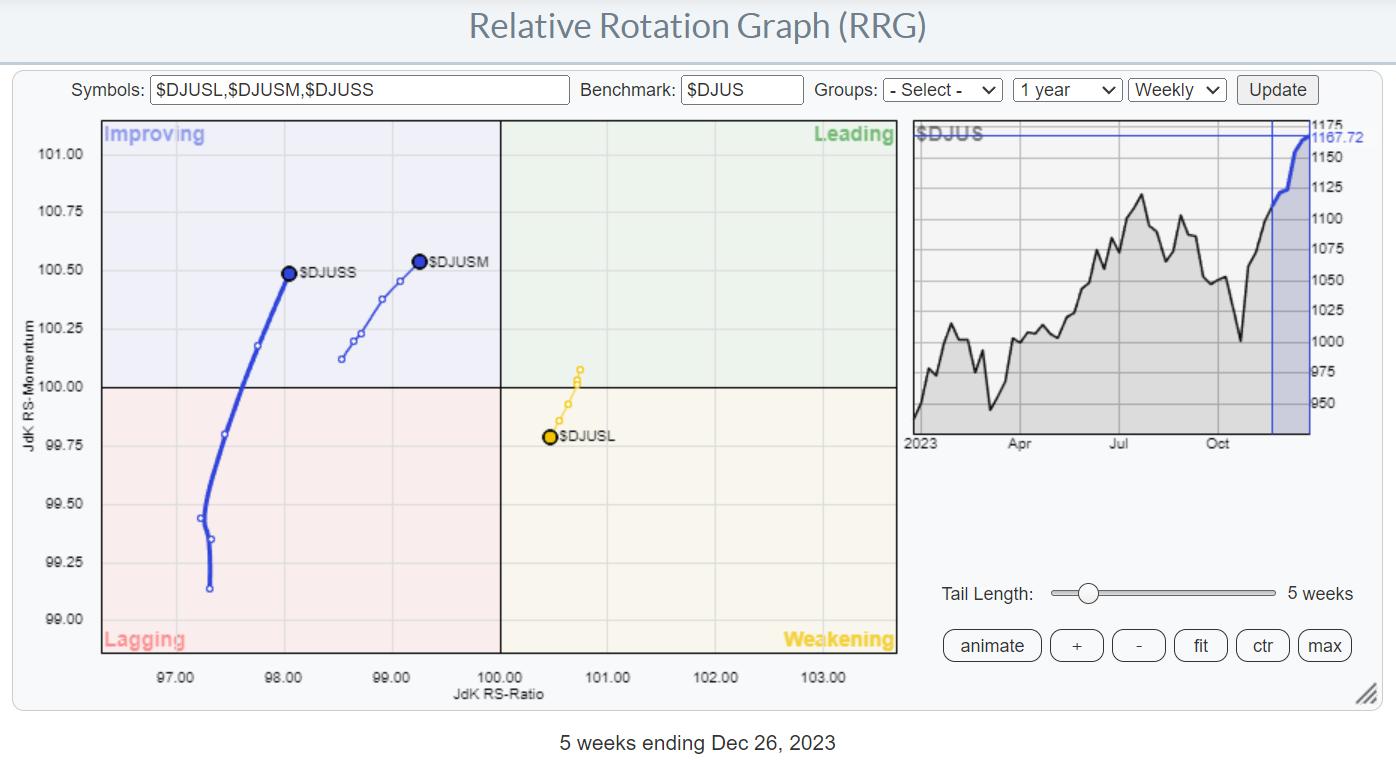
Which Sectors Benefit Most From the Large- to Mid- & Small-Cap Rotation?
by Julius de Kempenaer,
Senior Technical Analyst, StockCharts.com
KEY TAKEAWAYS
* Money rotating away from large-cap stocks
* Re-distribution and new inflow to mid- and small-caps
* Majority of sectors show preference for equal weight ETFs over Cap-Weighted counterparts
I have used this Relative Rotation Graph regularly in the past few weeks to indicate the ongoing rotation out of large-cap stocks...
READ MORE
MEMBERS ONLY
Ready Yourself for 2024 With Macro to Micro Analysis
For the new year, we have given you an extensive 3-pronged look at the markets.
First, we have the general outlook for the economy and markets through the Outlook 2024. This is the general outlook for 2024, including the recap of 2023 and how the predictions I made then played...
READ MORE
MEMBERS ONLY

Investing in 2024: 3 Promising Opportunities To Watch
by Jayanthi Gopalakrishnan,
Director of Site Content, StockCharts.com
KEY TAKEAWAYS
* The stock market ended with a bang in 2023 in spite of inflationary fears
* Small caps and emerging markets are breaking out of a trading range so look for value plays in these asset groups
* Bitcoin has soared and the trend is likely to continue in 2024
The...
READ MORE
MEMBERS ONLY

Intermediate-Term Participation Levels Are Very Overbought, and They Are Weak Long-Term
by Carl Swenlin,
President and Founder, DecisionPoint.com
When we discuss participation, we are referring to the more specific and accurate assessment of breadth available with the Golden Cross and Silver Cross Indexes. The venerable and widely-known Golden Cross is when the 50-day moving average of a price index crosses up through the 200-day moving average, which signals...
READ MORE
MEMBERS ONLY

The Vanity Trade 2024: All About Me!
According to Wikipedia,
"Self-help or self-improvement is a self-directed improvement of oneself—economically, physically, intellectually, or emotionally—often with a substantial psychological basis."
In the Outlook 2024, I quote Raymond Lo yet again,
"The Dragon is considered a ‘Star of Arts.' The industries that will perform...
READ MORE
MEMBERS ONLY

More from Mish's Outlook 2024 -- 17 Predictions
One area I cover in the Outlook 2024 is the teachings of Raymond Lo and how he sees the upcoming Year of the Dragon. Part of my comments on his analysis is based on this statement by Lo:
"Many has the misunderstanding that the Dragon is glamorous auspicious animal...
READ MORE
MEMBERS ONLY

Week Ahead: NIFTY Takes Breather After Seven Weeks of Gains; What to Expect Next?
by Milan Vaishnav,
Founder and Technical Analyst, EquityResearch.asia and ChartWizard.ae
In the previous technical note, it was categorically mentioned that, given the unabated upmove, the markets have risen near-vertically. This has caused the indices to deviate greatly from their mean, making them overextended and prone to violent profit-taking bouts. While weekly, the markets have just consolidated, but on the daily...
READ MORE
MEMBERS ONLY
Inflation Data Brings Holiday Cheer As We Head Into Year-End
by Mary Ellen McGonagle,
President, MEM Investment Research
The markets were handed a holiday gift today after the Commerce Department reported that underlying inflation pressures are continuing to slow down. This has left more income at the disposal of households with increased spending that will help the overall economy. News of declining inflation sets the stage for interest...
READ MORE
MEMBERS ONLY
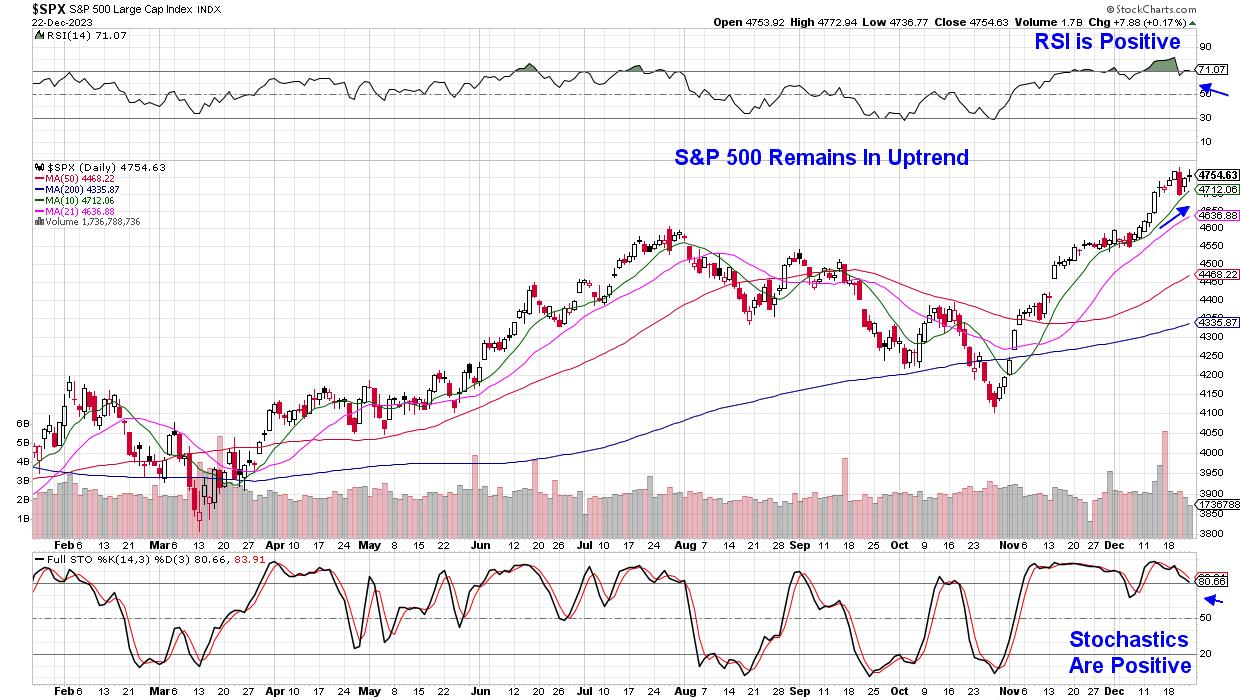
MEM TV: Markets in Bullish Mode as We Head Toward Year-End
by Mary Ellen McGonagle,
President, MEM Investment Research
In this episode of StockCharts TV'sThe MEM Edge, join Mary Ellen as she as she dives into the latest news and trends that are driving price action in the markets. From housing updates to consumer confidence and inflationary data, she breaks it all down and shows you how...
READ MORE
MEMBERS ONLY
The Top Five Charts of 2023
by David Keller,
President and Chief Strategist, Sierra Alpha Research
KEY TAKEAWAYS
* 2023 was dominated by mega cap growth stocks, but the fourth quarter saw a potential change as other sectors experienced renewed vigor.
* Three breadth indicators provided great clarity to the up and down cycles over the course of the year, as extreme readings tended to coincide with major...
READ MORE
MEMBERS ONLY

Sector Spotlight: Stocks vs. Bonds --The Clear Preference
by Julius de Kempenaer,
Senior Technical Analyst, StockCharts.com
On this episode of StockCharts TV's Sector Spotlight, the last one of the year 2023, I assess current rotations in asset classes, as well as US sectors. This big picture calls for a continued/renewed strength for stocks over bonds. As I observe, money is rotating out of...
READ MORE
MEMBERS ONLY

Stock Market Delivered Huge Gift, Wipes Away Recession Fears
by Jayanthi Gopalakrishnan,
Director of Site Content, StockCharts.com
KEY TAKEAWAYS
* Cooling inflation data sends the S&P 500 higher, which is a good start to the Santa Claus rally
* Investors should monitor small-cap stocks and bonds and consider adding them to investment portfolios
* Volatility is low but investors should continue monitoring the VIX to identify changes in...
READ MORE
MEMBERS ONLY

Top Five Charts of 2023 #5: Bitcoin
by David Keller,
President and Chief Strategist, Sierra Alpha Research
In the fifth of a five-part special series on StockCharts TV'sThe Final Bar, Dave dives into the fascinating world of Bitcoin. Discover the incredible growth and performance of cryptocurrencies in 2023, surpassing even the stock market. Find out why Bitcoin's sudden breakouts and significant rallies make...
READ MORE
MEMBERS ONLY

Boost Your Trading Success with This Chart Trick
by Grayson Roze,
Chief Strategist, StockCharts.com
On this week's edition of StockCharts TV'sStockCharts in Focus, Grayson we reveals a useful chart trick that will revolutionize your trading toolkit. Get ready to dive into the site, explore the tools, and walk through the features that will help you maximize the value of your...
READ MORE
MEMBERS ONLY

More from Mish's Outlook 2024 -- Gold and Silver
For last year's Outlook, I wrote:
Perhaps our biggest callout for a major rally in 2023 is in gold.
Here we are over $2000 and, although gold has not doubled in price, it did rise by 25%.
For 2024, we stay with our call for higher gold prices....
READ MORE
MEMBERS ONLY

Is Sentiment Too Bullish?

by Erin Swenlin,
Vice President, DecisionPoint.com
KEY TAKEAWAYS
* NAAIM Sentiment - No Leverage
* AAII Sentiment Highly Bullish
* Rydex Bull Assets Have Room to Move Higher
(This is an excerpt from today's subscriber-only DP Alert.)
We thought it might be a good idea to review sentiment today. It should be no surprise that investors are...
READ MORE
MEMBERS ONLY

GNG TV: Buying Opportunity or Trend Reversal?
by Alex Cole,
Co-founder, GoNoGo Charts®
by Tyler Wood,
Co-founder, GoNoGo Charts®
In this edition of the GoNoGo Charts show, Tyler and Alex dive into the current trends and momentum in the markets, in order to help navigate through the ever-changing landscape of stocks, bonds, commodities, and the dollar. Is the recent pullback in the S&P 500 is just a...
READ MORE
MEMBERS ONLY

Top Five Charts of 2023 #4: Leadership Themes
by David Keller,
President and Chief Strategist, Sierra Alpha Research
In the fourth of a five-part special series on StockCharts TV'sThe Final Bar, Dave discusses the top leadership trends of 2023. From the concept of narrow leadership to the rise of the Magnificent Seven, he explores the most important themes that shaped the year in this engaging episode....
READ MORE
MEMBERS ONLY

More from Mish's Outlook 2024 -- S&P 500
A passage from the Outlook:
SPY's all-time high was made in January 2022 at $479.98.
For now, the chart looks clear. If SPY pushes over 460, we can expect more upside at least until we get near the ATHs.
Should those levels clear, then we are in...
READ MORE
MEMBERS ONLY

Mish's Outlook 2024 is Here -- Macro to Micro
Coming into 2023, we used the theme, "You can't hunt with the hounds and run with the rabbit." Those who stood back with the hounds, in search of a sure hit, were not only left behind, but missed the move higher as the rabbit got the...
READ MORE
MEMBERS ONLY
Top Five Charts of 2023 #3: Market Breadth Indicators
by David Keller,
President and Chief Strategist, Sierra Alpha Research
In the third of a five-part special series on StockCharts TV'sThe Final Bar, Dave breaks down three market breadth indicators that tell the story of market conditions in 2023. By analyzing the S&P 500 Bullish Percent Index, the percentage of stocks above their 50-day moving average,...
READ MORE
MEMBERS ONLY

What Would It Take for Emerging Markets to Emerge?
by Martin Pring,
President, Pring Research
Over the years, emerging markets as a group have experienced huge swings in relative performance. The latest one, which began in 2010, has been quite bearish. When such linear trends dominate the scene, reliable cyclical indicators, such as the long-term KST or monthly MACD, often give premature buy signals and...
READ MORE
