MEMBERS ONLY

Top Five Charts of 2023 #2: Ten-Year Treasury Yield

by David Keller,
President and Chief Strategist, Sierra Alpha Research
In the second of a five-part special series on StockCharts TV'sThe Final Bar, Dave takes a deep dive into the bond markets, talking rising rates, Fed rate hikes, value vs. growth, inverted yield curves, and what the bond markets in 2023 could tell us about potential future paths...
READ MORE
MEMBERS ONLY

DP Trading Room: Finally! Signs of Life in the Energy Sector

by Erin Swenlin,
Vice President, DecisionPoint.com

by Carl Swenlin,
President and Founder, DecisionPoint.com
In this week's edition of The DecisionPoint Trading Room, with Energy (XLE) finally showing signs of life, Carl and Erin dive into the sector to learn more about participation and new momentum. Carl discusses Total Returns on SPX, which are showing new all-time highs before the actual index....
READ MORE
MEMBERS ONLY

Top Five Charts of 2023 #1: S&P 500
by David Keller,
President and Chief Strategist, Sierra Alpha Research
In the first of a five-part special series on StockCharts TV'sThe Final Bar, Dave walks through the S&P 500 index quarter by quarter. From the strong rally phase in the 2nd quarter to the dramatic reversal at the October low, 2023 has provided a perfect case...
READ MORE
MEMBERS ONLY

Stock(ing) Stuffers That Could Be Loving the High 2024
Just for the fun of it, and since we did not include it in our Outlook 2024, I decided to have a look at what experts are saying concerning mushrooms, cannabis, and hemp. After all, recreational and medical alternatives as investments, have been huge underperformers, and are a bit of...
READ MORE
MEMBERS ONLY

Size (Matters) Over Style!

by Julius de Kempenaer,
Senior Technical Analyst, StockCharts.com
KEY TAKEAWAYS
* Growth and Value are moving together in an unusual rotation
* Money from large-cap stocks being distributed into mid- and small-cap segments
* Even all Mag7 names dropping in price is not enough to pull down benchmark indices
Something Strange is Going On
Or, at least, something unusual.
On the...
READ MORE
MEMBERS ONLY

Week Ahead: NIFTY Overextended on Charts; Avoid Chasing Up Moves as Consolidation Look Imminent

by Milan Vaishnav,
Founder and Technical Analyst, EquityResearch.asia and ChartWizard.ae
Continuing with the unabated upmove, the markets went on to post their fresh lifetime highs once again; NIFTY has ended on a fresh lifetime high on a closing basis as well. The rally this week was propelled by the Fed, which kept the interest rates unchanged. While this was widely...
READ MORE
MEMBERS ONLY

Extreme Breadth Readings Say Short-Term Bearish, Long-Term Bullish
by David Keller,
President and Chief Strategist, Sierra Alpha Research
By late October, the market conditions were dire indeed. The S&P 500 had broken below its 200-day moving average for the first time since March. Only 10% of S&P 500 members remained above their 50-day moving average, meaning a full 90% were below this key short-term...
READ MORE
MEMBERS ONLY
MEM TV: Don't Miss the Move Into These NEW Areas!

by Mary Ellen McGonagle,
President, MEM Investment Research
In this episode of StockCharts TV'sThe MEM Edge, Mary Ellen shows you what to be on the alert for, with the broader markets in an oversold position as we head into year-end. She also highlights which areas are poised to continue to trade higher, sharing some individual stocks...
READ MORE
MEMBERS ONLY

Larry Williams' 2024 Market Outlook

by Larry Williams,
Veteran Investor and Author
by David Keller,
President and Chief Strategist, Sierra Alpha Research
On this edition of StockCharts TV'sThe Final Bar, legendary trader and author Larry Williams joins Dave to share his lessons learned in 2023, his outlook for stocks in 2024, and which cycles he feels all investors should be following into the new year.
This video originally premiered on...
READ MORE
MEMBERS ONLY

Are We Seeing 2020 All Over Again!?

by TG Watkins,
Director of Stocks, Simpler Trading
The market exploded higher after already being on a winning streak for 5 weeks. While there are blow-off top vibes, there could be a lot of money able to come in from the sidelines to keep the market going. In this week's edition of Moxie Indicator Minutes, TG...
READ MORE
MEMBERS ONLY

How is the Economic Modern Family Liking Santa Now?
This is a great time to examine the weekly charts of the Economic Modern Family. We like that timeframe for now, with only a short number of trading days left. And there's lots of news constantly unfolding:
1. Rate cuts/no rate cuts
2. Middle East heating up...
READ MORE
MEMBERS ONLY

Small-Caps Rocket to the Upside, Leave Large-Caps in the Dust
by David Keller,
President and Chief Strategist, Sierra Alpha Research
On this edition of StockCharts TV'sThe Final Bar,Julius de Kempenaer of RRG Research points out that growth vs. value is now more of a small vs. large question, with small caps rocketing to the upside in December. Host David Keller, CMT recaps the top charts of the...
READ MORE
MEMBERS ONLY

GNG TV: S&P 500 Breakout -- Will the Rally Continue to All-Time Highs by Year End?

by Alex Cole,
Co-founder, GoNoGo Charts®

by Tyler Wood,
Co-founder, GoNoGo Charts®
In this edition of the GoNoGo Charts show, as equities rally with speed from 4600 to 4700 this week, Alex and Tyler take a look across style boxes, cap scales, asset classes, and sectors, and review small-cap industrials that are part of the broadening leadership groups giving legs to this...
READ MORE
MEMBERS ONLY

Find Aggressive Entry Opportunities & Tradeable Trends with Multi-Timeframe Charts

by Joe Rabil,
President, Rabil Stock Research
On this week's edition of Stock Talk with Joe Rabil, Joe explains how to use multiple timeframes to help when getting an aggressive entry in a stock. He starts by explaining the tradable trend, then shows how an aggressive opportunity develops. To close out the show, he analyzes...
READ MORE
MEMBERS ONLY

The Halftime Show: Crude Oil Back in the "White House Buy Zone"

by Pete Carmasino,
Chief Market Strategist, Chaikin Analytics
On this week's edition ofStockCharts TV'sHalftime, Pete covers the major indexes and reviews the bullish percents of the S&P 500 and Nasdaq 100, before then taking a look at the NYSE FANG+ index. After that, he highlights the fact that crude oil is back...
READ MORE
MEMBERS ONLY

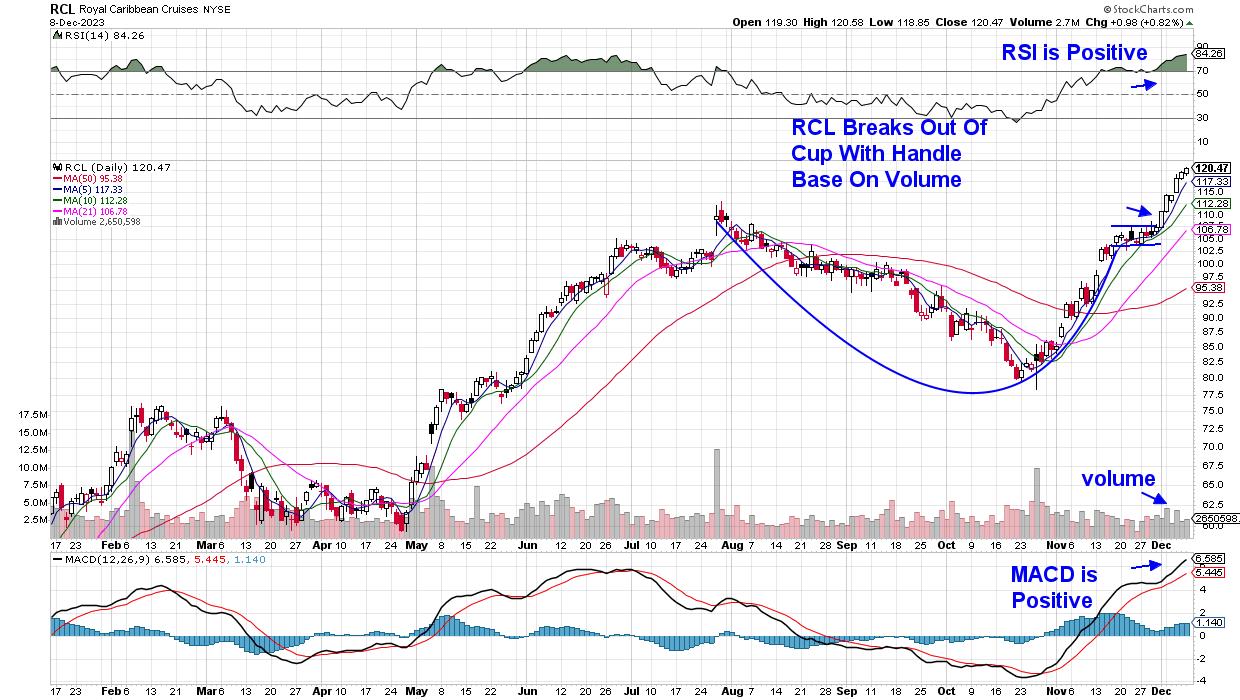
Energy Sector Finally Becoming Bullish?
by Carl Swenlin,
President and Founder, DecisionPoint.com
We publish this table daily to give an overview of the market, sector, and industry group indexes we follow. The Intermediate-Term Trend Model (ITTM) BUY Signals occur when the 20-day EMA crosses up through the 50-day EMA (Silver Cross). Long-Term Trend Model (LTTM) BUY Signals occur when the 50-day EMA...
READ MORE
MEMBERS ONLY

Larry's "Family Gathering" December 14, 2023 Recording
by Larry Williams,
Veteran Investor and Author
In this video, Larry presents his forecast for FANG stocks, including an analysis of the stock selloff for META. He then digs into the cycle of debt and why he's bothered about credit card writeoffs. After that, he examines the weekly economic index and GDP and how they...
READ MORE
MEMBERS ONLY
"Family Gathering" Meeting Today at 2:00 PM Eastern
Today, Larry Williams will be hosting a "Family Gathering" meeting at 2pm Eastern Standard Time (11am Pacific). Sign-in in begins 5 minutes prior. The show will be recorded and posted online for those of you who cannot attend. Use the link below to join:
Link to Join Webinar:...
READ MORE
MEMBERS ONLY

Blow-Off Top?! Market Reacts to the FED Announcement
by David Keller,
President and Chief Strategist, Sierra Alpha Research
Happy Fed Day on this edition of StockCharts TV'sThe Final Bar. There was quite a bit of movement leading into the FOMC announcement, with exceptional amounts of movement afterwards. Markets continued to push aggressively to the upside, with the S&P 500 closing the day out above...
READ MORE
MEMBERS ONLY
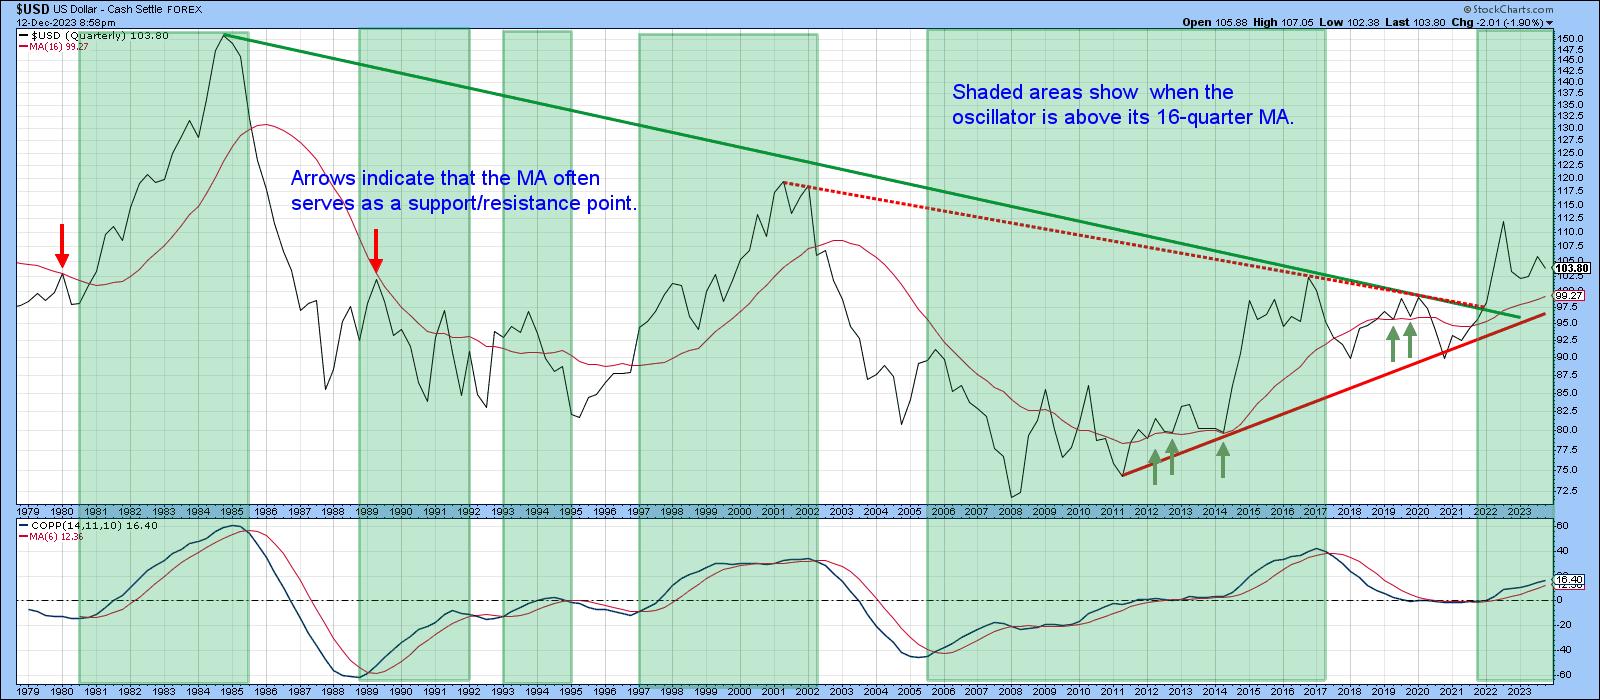
Maybe It's Time for a Santa Claus Rally... in the Dollar

by Martin Pring,
President, Pring Research
I like to start off my approach to any market by taking a look at the long-term trend. That's because a rising tide not only lifts all boats, but the direction of the long-term trend determines the characteristics of those below it. For example, if the primary trend...
READ MORE
MEMBERS ONLY
This Industry Group Outperformed the S&P 500 by OVER 120% in 2023!
by David Keller,
President and Chief Strategist, Sierra Alpha Research
In this edition of StockCharts TV'sThe Final Bar, guest Joe Rabil of Rabil Stock Research shares his biggest takeaway from investing in 2023 and also conducts a deep dive in the Consumer Discretionary sector with a focus on four stocks: SIG, TSLA, RL, and ABNB. Meanwhile, Dave unveils...
READ MORE
MEMBERS ONLY

Sector Spotlight: Timeless Knowledge and Insights into Sector Rotation & Seasonality
by Julius de Kempenaer,
Senior Technical Analyst, StockCharts.com
For the 200th episode of StockCharts TV's Sector Spotlight, I inviteWall Street legend Sam Stovall for an entertaining discussion. Before that, I starts the show with a short look at current market rotations, highlighting the increasing relative weakness for the Energy Sector. I also note money rotating out...
READ MORE
MEMBERS ONLY

Larry's Final LIVE "Family Gathering" Webinar of 2023 Airs THIS WEEK - Thursday, December 14th at 2:00pm EST!
Larry is going LIVE! Don't miss the upcoming "Family Gathering" webinar with Larry Williams, airing live through Zoom this Thursday, December 14 at 2:00pm Eastern Standard Time.
In this must-see event, Larry will be presenting his current opinions on a broad variety of current market...
READ MORE
MEMBERS ONLY
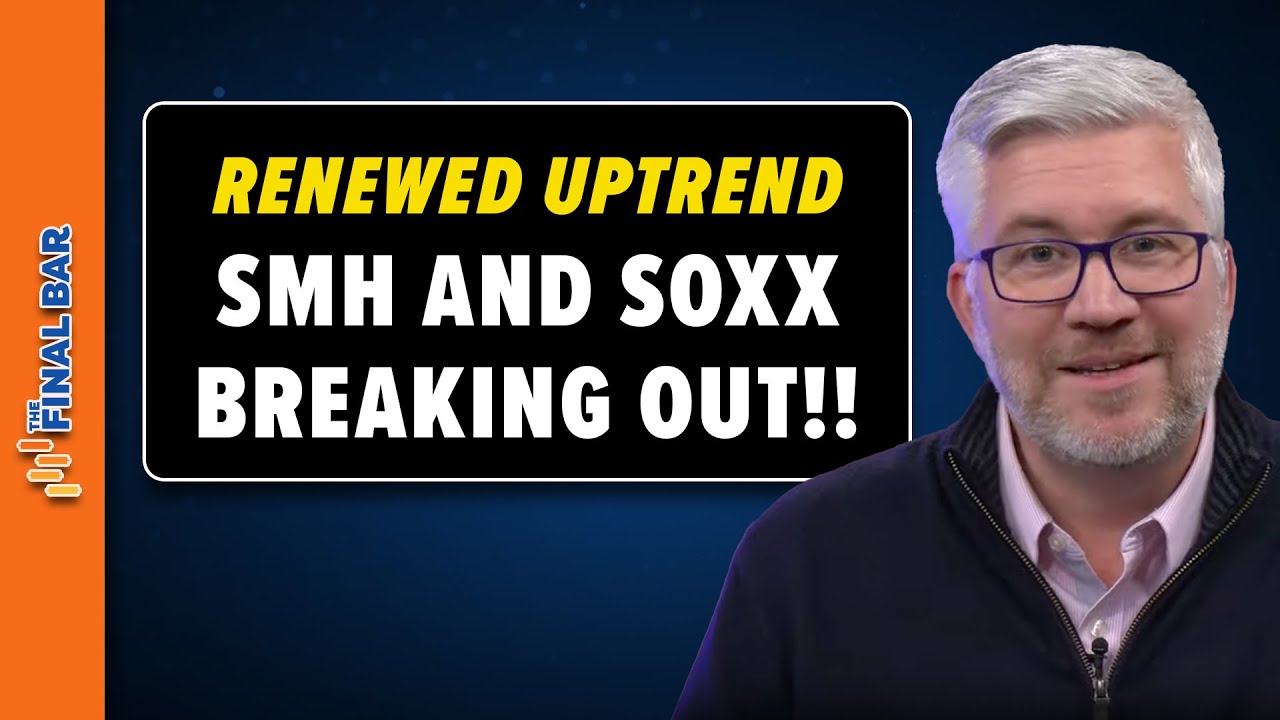
Renewed UPTREND for Semis -- SMH and SOXX ETFs Breaking Out!
by David Keller,
President and Chief Strategist, Sierra Alpha Research
In this edition of StockCharts TV'sThe Final Bar, Dave recaps the renewed uptrend for semis, with ETFs like SMH and SOXX breaking out despite a lack of participation from the largest semiconductor name, Nvidia (NVDA). He answers viewer questions on QQQ, Netflix (NFLX), Resmed (RMD), Avis Budget Group...
READ MORE
MEMBERS ONLY

Is Overbought Really Bearish?

by Arthur Hill,
Chief Technical Strategist, TrendInvestorPro.com
The S&P 500 SPDR (SPY) surged over 10% since late October and exceeded the upper Bollinger Band (125,1). This means price is more than 1 standard deviation above the 125-day SMA. Surely, this means SPY is overbought. But is this actually bearish? Historical evidence suggests that this...
READ MORE
MEMBERS ONLY

Week Ahead: NIFTY Faces An Imminent Consolidation; This Index May Finally Start To Relatively Outperform
by Milan Vaishnav,
Founder and Technical Analyst, EquityResearch.asia and ChartWizard.ae
The markets continued their unabated upmove; following a strongly trending week, the Nifty not only ended at a fresh lifetime high point but also closed with gains for the sixth consecutive week. The markets piled up decent returns despite some signs of consolidation in the second half of the week....
READ MORE
MEMBERS ONLY
The Most Successful Base Pattern is Seeing a Pickup in Breakouts; Here Are Two Examples
by Mary Ellen McGonagle,
President, MEM Investment Research
Last week, the S&P 500 posted a modest 0.2% gain, which puts it within points of a 4-month base breakout at 4607. In addition to a breakout, a move above this level would put this Index above its July high, which is a key area of possible...
READ MORE
MEMBERS ONLY
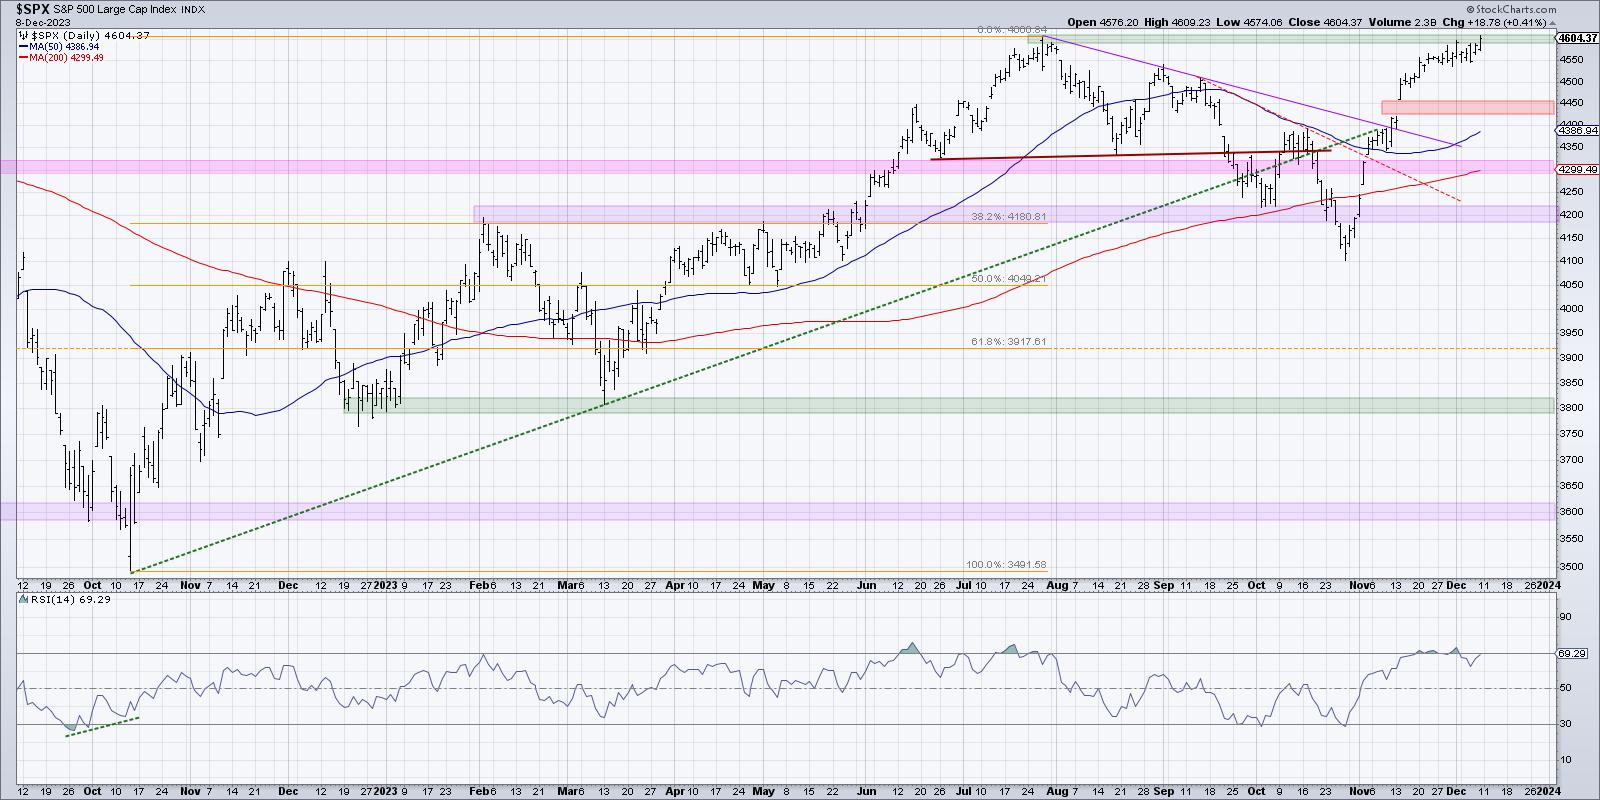
Will the S&P 500 Push Above 4600 Before Year-End?
by David Keller,
President and Chief Strategist, Sierra Alpha Research
KEY TAKEAWAYS
* The S&P 500 index has stalled out at its July high around 4600, and overbought readings from RSI indicate a likely pullback.
* Breadth indicators have reached bullish extreme readings, confirming the long-term bullish, short-term bearish thesis.
* Individual stocks from both growth and value sectors are overbought...
READ MORE
MEMBERS ONLY

This Li'l Checkbox is KEY When Comparing Stocks & Charting Multiple Timeframes

by Grayson Roze,
Chief Strategist, StockCharts.com
On this week's edition of StockCharts TV'sStockCharts in Focus, Grayson shares the secret to comparing symbols and making multi-timeframe analysis a breeze! Using the "Load Symbol Only" checkbox, he demonstrates how to review a list of symbols with different chart templates, all without having...
READ MORE
MEMBERS ONLY
MEM TV: Here's Why Growth Stocks Outperformed Last Week!
by Mary Ellen McGonagle,
President, MEM Investment Research
In this episode of StockCharts TV'sThe MEM Edge, Mary Ellen reviews last week's muted price action in the markets, which occurred despite impactful economic data. She also highlights where the broader markets are headed and best ways to participate in the select areas that are outperforming...
READ MORE
MEMBERS ONLY

Top 10 Charts to Watch in December 2023
by David Keller,
President and Chief Strategist, Sierra Alpha Research
by Grayson Roze,
Chief Strategist, StockCharts.com
In this edition of StockCharts TV'sThe Final Bar, Dave is joined by StockCharts' own Grayson Roze as they break down the trends for the top ten stocks and ETF charts for December 2023. Together, they identify key levels and signals to watch for using technical analysis tools...
READ MORE
MEMBERS ONLY

Small-Caps Take Pole Position In Overbought Market
by TG Watkins,
Director of Stocks, Simpler Trading
In this week's edition of Moxie Indicator Minutes, TG notes that the market is finally letting some steam out which is what we want since we need this to present fresher opportunities for us to buy. TG presents some great examples of how to use and read the...
READ MORE
MEMBERS ONLY

Lift Off! Aerospace and Defense Stocks Showing Multi-Year Breakout
by David Keller,
President and Chief Strategist, Sierra Alpha Research
In this edition of StockCharts TV'sThe Final Bar, guest Jeff Huge, CMT of JWH Investment Partners highlights one industry within the Industrial sector showing a multi-year breakout, and lays out the bull case for gold in 2024. Dave reviews travel and tourism charts, speaks to the strength in...
READ MORE
MEMBERS ONLY

GNG TV: What Lies Ahead For End-of-the-Year Equities?
by Alex Cole,
Co-founder, GoNoGo Charts®
by Tyler Wood,
Co-founder, GoNoGo Charts®
In this edition of the GoNoGo Charts show, Alex and Tyler take a top-down approach to the markets as they apply the GoNoGo suite of tools to all the major asset classes. Starting with a look at macro factors effecting equity investors, they discuss the technical analysis from trend, momentum,...
READ MORE
MEMBERS ONLY

Useful Directional Indicator Criteria for Your Success as a Trader!
by Joe Rabil,
President, Rabil Stock Research
On this week's edition of Stock Talk with Joe Rabil, Joe shows the 2 criteria he is looking for in directional indicators to determine when the buyers or sellers are taking command. He explains how this signal can be used to your advantage in both analysis and trading....
READ MORE
MEMBERS ONLY
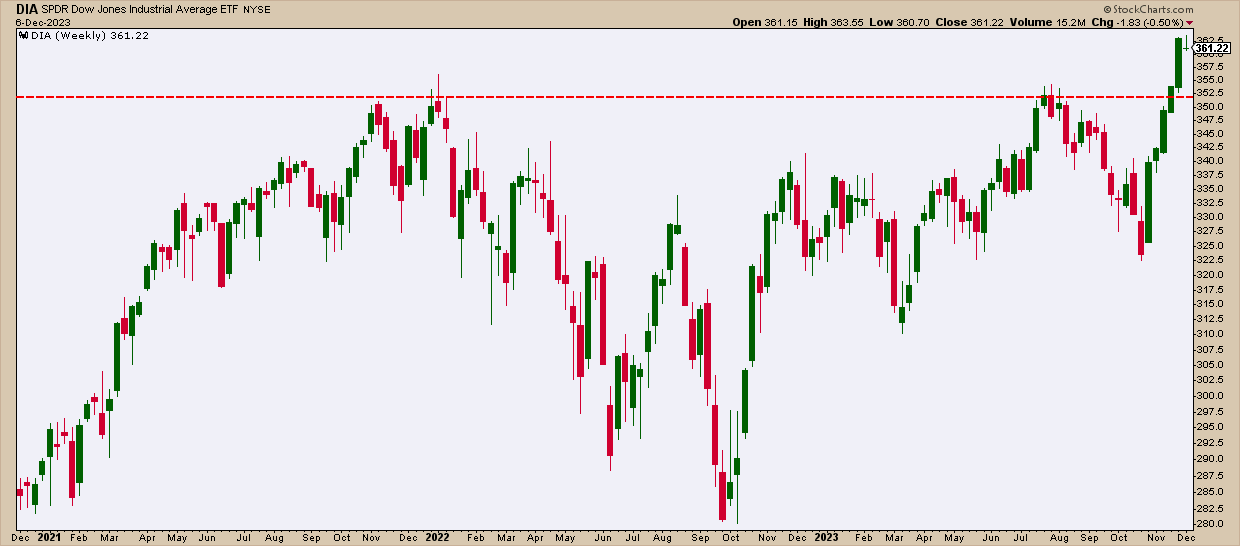
Santa Claus Rally Alert: Predicting a 70% Chance of Surge in the Dow Jones This December!

by Karl Montevirgen,
The StockCharts Insider
KEY TAKEAWAYS
* December has seen the Dow Jones Industrial Average rally 7 out of 10 times in December since 1896.
* DIA is seeing support at its former resistance level of $352.
* DIA has pulled back from "overbought" highs, which looks favorable for market engagement.
It's that...
READ MORE
MEMBERS ONLY
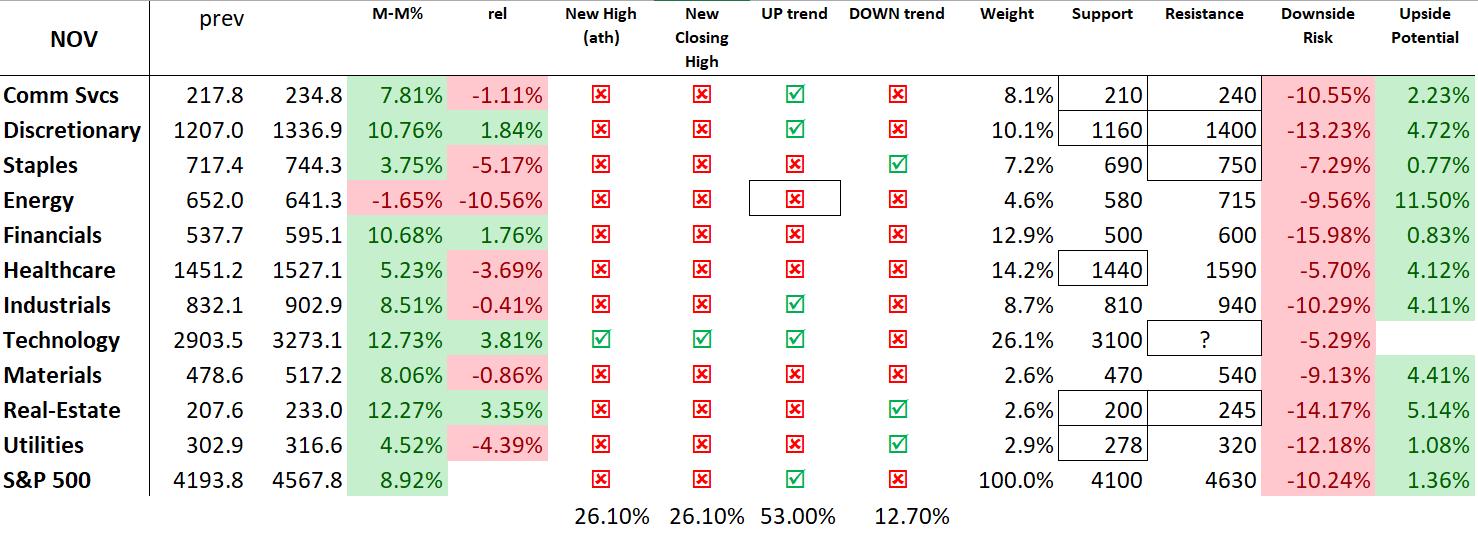
45% of Market Capitalization In S&P 500 Showing Strong Sector Rotation
by Julius de Kempenaer,
Senior Technical Analyst, StockCharts.com
KEY TAKEAWAYS
* RRG showing very distinct opposite rotations
* Once Sector Inside Leading and Two Sectors Inside Improving and Pushing toward Leading
* Energy Sector At Risk of Completing a Massive Double Top Formation
Usually, I would do this week's Sector Spotlight on the completed monthly charts for November. But...
READ MORE
MEMBERS ONLY

High Risk of Market Downside in December?
by David Keller,
President and Chief Strategist, Sierra Alpha Research
In this edition of StockCharts TV'sThe Final Bar, guest John Kosar, CMT of Asbury Research updates his Asbury Six tactical market model and shares how investors can be better positioned for market uncertainty into 2024. Host Dave highlights the strong rally in financials and airlines, and reveals one...
READ MORE
MEMBERS ONLY

Trend Channels Help Define Stock Pullback Scenarios
by David Keller,
President and Chief Strategist, Sierra Alpha Research
In this edition of StockCharts TV'sThe Final Bar, guest Sam Burns, CFA of Mill Street Research focuses on strength in financials, weakness in crude oil, and key macro themes he'll be tracking into 2024. Meanwhile, Dave tracks the relentless upswing for Bitcoin, the pullback in gold...
READ MORE
MEMBERS ONLY
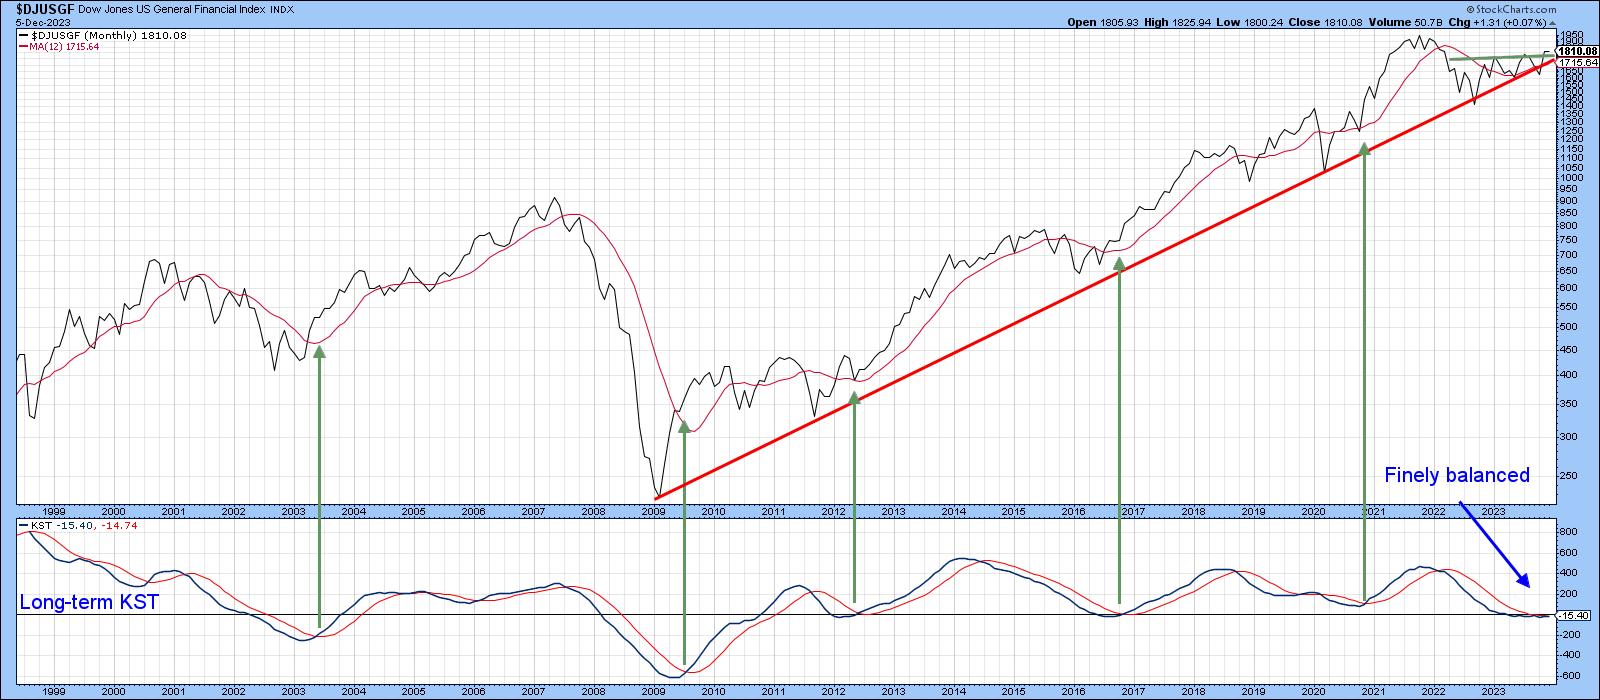
Are Financials Ready to Extend their Leadership?
by Martin Pring,
President, Pring Research
Technology (XLK) and Communications Services (XLC) have been the leaders since the bull market began in October of last year. However, they may need to look over their shoulders, as financials have been creeping up since the October 27 intermediate low. The short answer to the question posed by the...
READ MORE