MEMBERS ONLY

Is Every Stock on the Planet Overbought?!

by David Keller,
President and Chief Strategist, Sierra Alpha Research
In this edition of StockCharts TV'sThe Final Bar, host David Keller, CMT shows how mega-cap growth stocks like NFLX and GOOGL have pulled back from overbought conditions, and reviews how other market segments like gold and small caps are experiencing a similar pattern of upside exhaustion. He takes...
READ MORE
MEMBERS ONLY

Cryptocurrency Prices in the Spotlight, Small Caps Now in an Uptrend

by Jayanthi Gopalakrishnan,
Director of Site Content, StockCharts.com
KEY TAKEAWAYS
* Bitcoin closes above 42,000, a 20-month high
* Small caps also closed higher and are now in an uptrend
* Watch how seasonal patterns play out in December as it can be an indication of what to expect in 2024
The stock market seems to be pulling back after...
READ MORE
MEMBERS ONLY
DP Trading Room: How Bad Data From Major Indexes Leads to Bad Analysis

by Erin Swenlin,
Vice President, DecisionPoint.com

by Carl Swenlin,
President and Founder, DecisionPoint.com
In this week's edition of The DecisionPoint Trading Room, Carl discusses his recent epiphany regarding data derived from major indexes. Bad data will lead to bad analysis, so it's important to understand this concept for analyzing major indexes. He and Erin discuss the implications of Magnificent...
READ MORE
MEMBERS ONLY

Week Ahead: NIFTY Stares At Scaling New Highs; These Sectors May Relatively Outperform

by Milan Vaishnav,
Founder and Technical Analyst, EquityResearch.asia and ChartWizard.ae
Following a strong consolidation in the week before this one, the markets finally staged a decisive rally over the past four sessions of the truncated week. The benchmark index NIFTY50 surged in all four sessions; it went on to move past the previous lifetime high of 20222.45 and managed...
READ MORE
MEMBERS ONLY

Stock Market Starts December On A Strong Note: What This Means For the Rest of the Year
by Jayanthi Gopalakrishnan,
Director of Site Content, StockCharts.com
KEY TAKEAWAYS
* The S&P 500 index closed at its 2023 high
* The Dow Jones Industrial Average hits a new 52-week high
* The S&P 600 Small Cap Index led the rally with a 2.89% gain
The stock market is off to a great start on the...
READ MORE
MEMBERS ONLY
Pullback Imminent for Nasdaq 100
by David Keller,
President and Chief Strategist, Sierra Alpha Research
KEY TAKEAWAYS
* The recent upside gap around $380 was a key moment for the QQQ, but if leading growth stocks continue to drop, this level may come into question.
* While a new all-time high for the Nasdaq 100 is a possibility over the next six to eight weeks, the overbought...
READ MORE
MEMBERS ONLY
MEM TV: Nasdaq Flat But These Top Areas Outperform!

by Mary Ellen McGonagle,
President, MEM Investment Research
In this episode of StockCharts TV'sThe MEM Edge, Mary Ellen reviews the outperformance that took place amid a declining rate environment, while also highlighting price action in Tech, which trended sideways last week. She also reviews Dow stocks that just entered a new uptrend as the Index hits...
READ MORE
MEMBERS ONLY

Fresh Trade Opportunities as Market Eases Up on the Reins!

by TG Watkins,
Director of Stocks, Simpler Trading
In this week's edition of Moxie Indicator Minutes, TG notes that the market is finally letting some steam out which is what we want since we need this to present fresher opportunities for us to buy. TG presents some great examples of how to use and read the...
READ MORE
MEMBERS ONLY

Emerging Markets vs. U.S. Markets
While December 1st brought out the bulls in nearly EVERYTHING, one area caught our attention.
In December 2019, I saw a similar chart showing an unsustainable ratio between equities and commodities, which started me on the notion that something had to give. Now that I see this chart, with emerging...
READ MORE
MEMBERS ONLY

Skepticism Over the OPEC + Oil Cuts
Despite the total cuts by all countries added at the November 30th OPEC+ meeting, oil sold off, testing key support. Countries like Angola have threatened not to stick to the new quota, promising to produce above target. Meanwhile, Brazil confirmed it will join OPEC+. That means that some of the...
READ MORE
MEMBERS ONLY

Unlock the Secrets of Five Candlestick Patterns

by Joe Rabil,
President, Rabil Stock Research
On this week's edition of Stock Talk with Joe Rabil, Joe presents 5 specific candlestick patterns and how to use them. He explains how the location of these candles have an impact on their importance, and also discusses how a higher timeframe candle can help with trades on...
READ MORE
MEMBERS ONLY

Santa Comes to Wall Street | Focus on Stocks: December 2023

by Larry Williams,
Veteran Investor and Author
Santa Comes to Wall Street
Maybe St. Nick gets into the eggnog before he visits Wall Street each year, because the trading pattern has been a step up, then a stumble down before recovering at the end of the year. I first noticed this Up-Down-Up pattern back in the early...
READ MORE
MEMBERS ONLY

Follow This Powerful Seasonal Playbook in Election Years
by David Keller,
President and Chief Strategist, Sierra Alpha Research
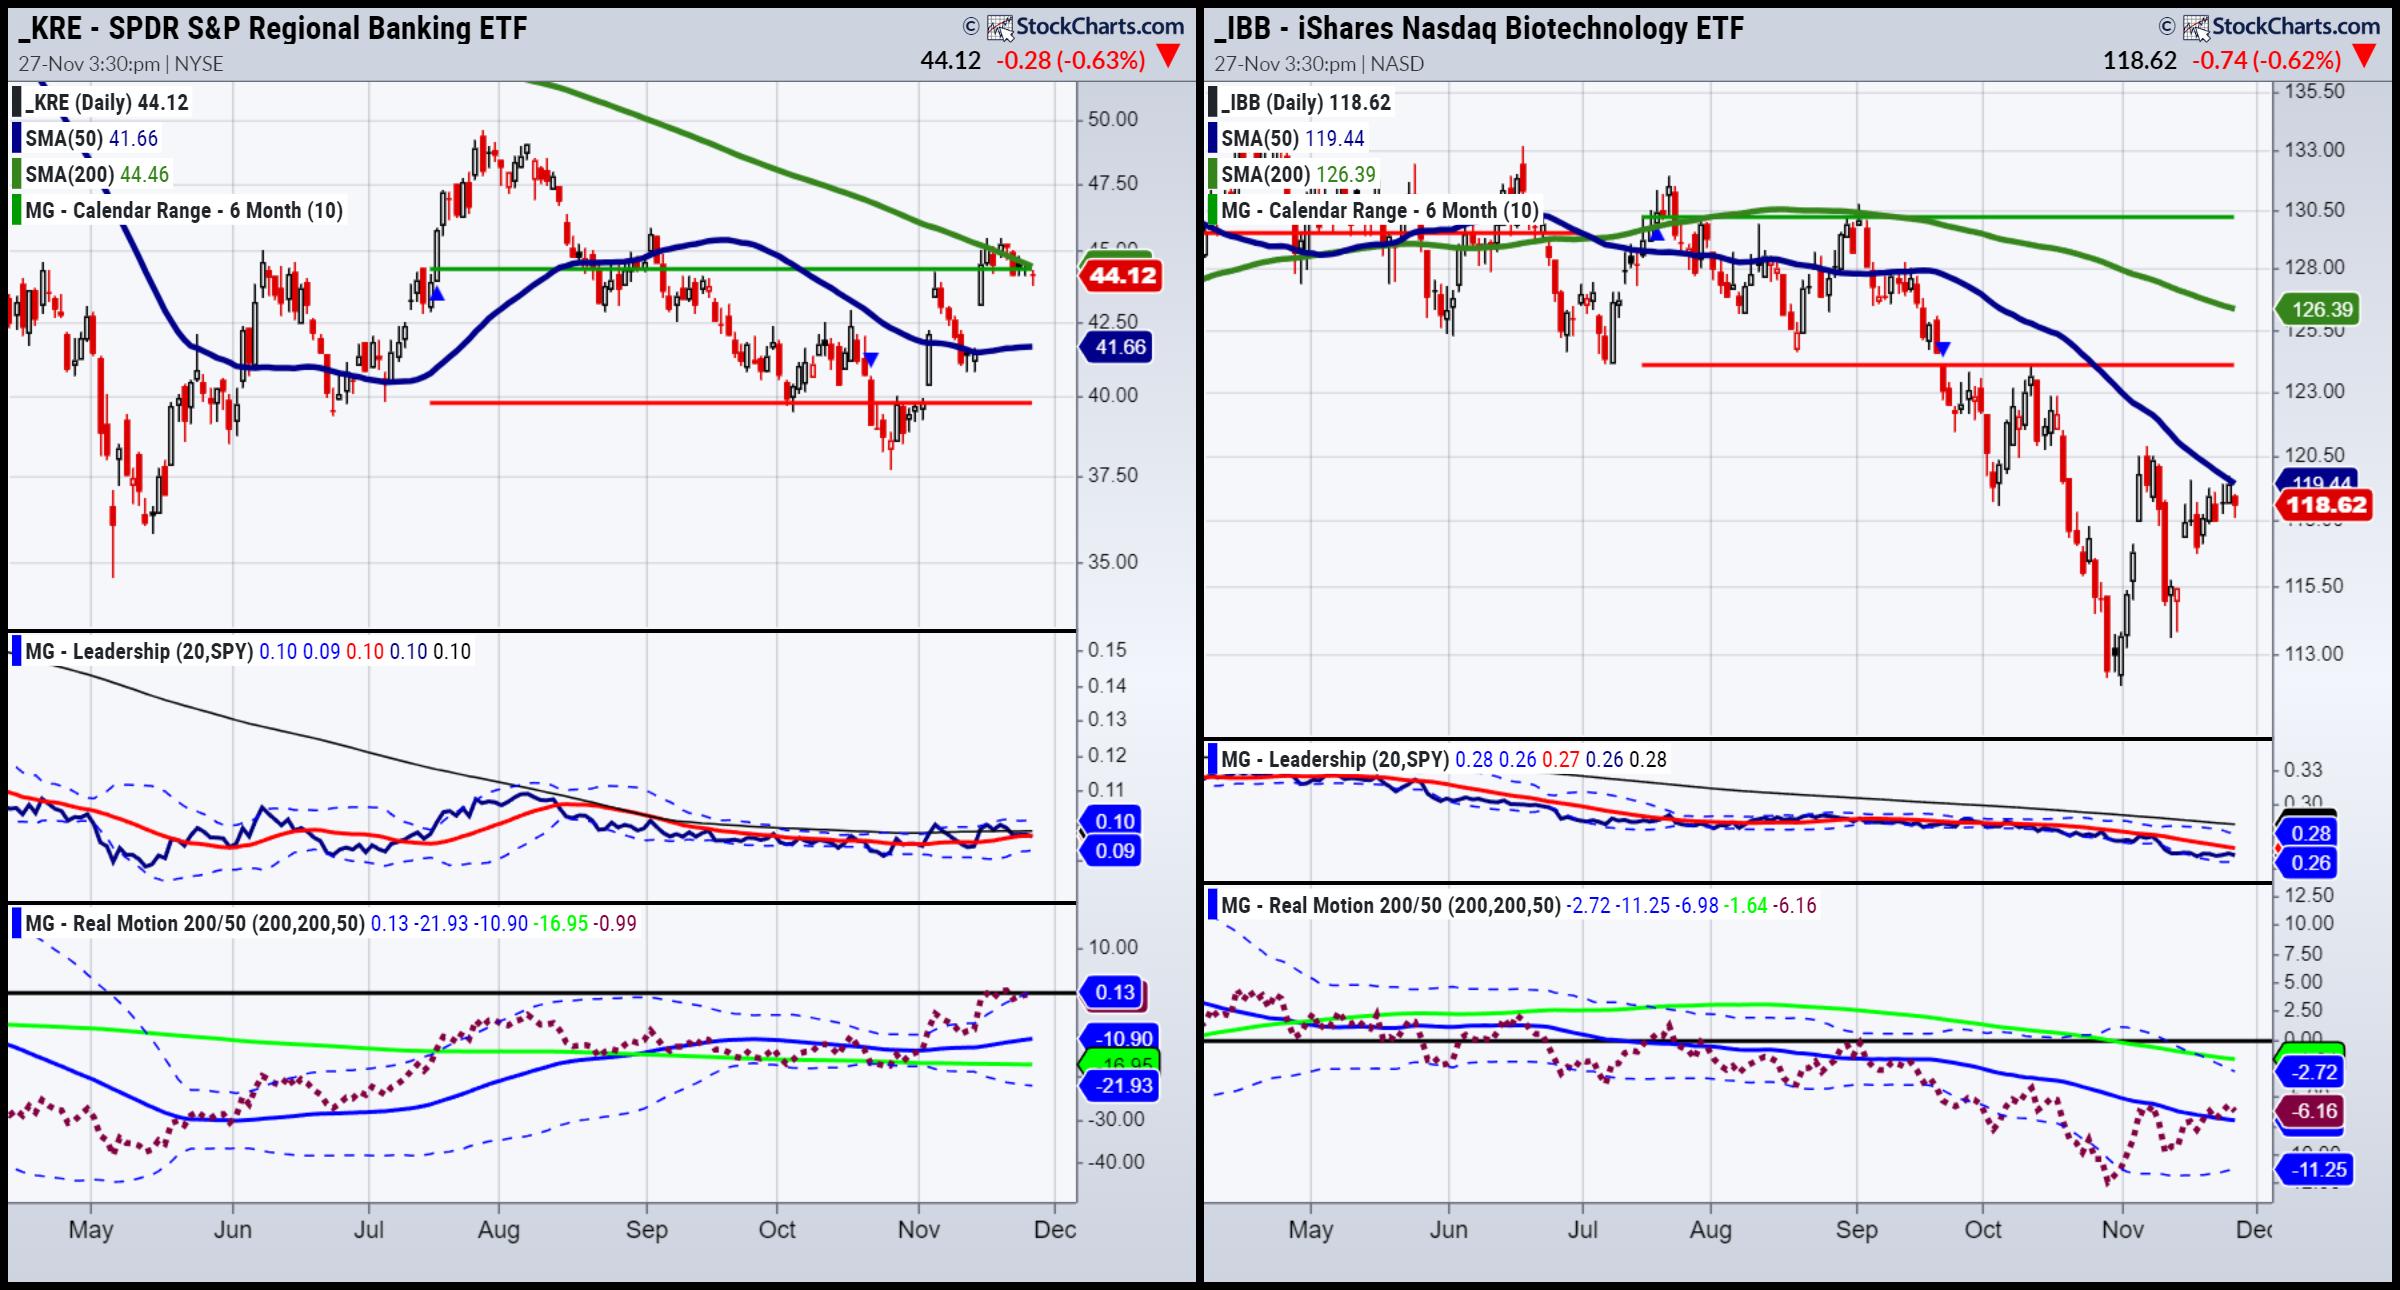
In this edition of StockCharts TV'sThe Final Bar, guest Jeff Hirsch of theStock Trader's Almanacshares the suggested seasonal pattern for 2024 and breaks down how previous election years have played out. Host David Keller, CMT highlights a breakout in gold miners, regional banks breaking above their...
READ MORE
MEMBERS ONLY

The Final Episode: Jesse Livermore Insights and Holding 'Dead Money' Positions

by Dave Landry,
Founder, Sentive Trading, LLC
In the final edition of Trading Simplified, Dave shows his methodology in action by sharing two positions that he continues to hold, even though they were "dead money" most of the time, and why he applied discretion to stick with a losing position to possibly avoid a loss....
READ MORE
MEMBERS ONLY

The Halftime Show: Are Rate Cuts on the Horizon? Watch the Jobless Claims

by Pete Carmasino,
Chief Market Strategist, Chaikin Analytics
As Pete has said several times on theHalftimeshow before, the Fed will likely cut rates when the unemployment rate ticks higher. Year-to-date the unemployment rate is up 14% from its lows in January and even Christopher Waller, an economist and member of the Fed Board of Governors, mentioned the possibility...
READ MORE
MEMBERS ONLY
Three Markets That are Right At Significant Breakout Points

by Martin Pring,
President, Pring Research
A lot of the time, I write articles that focus on markets or technical situations that should be monitored for a potential turn. This one is no different, except to say that these markets are not close to breakout points, but right at them. In short, it's fish-or-cut-bait...
READ MORE
MEMBERS ONLY

Big View Slaps Bulls with Warnings
On Monday, after the close, some warning signs from our risk gauges popped up. These are especially interesting given the number of bulls and the amount of money coming into the market.
Technically, we still have the resistance that has not cleared in small caps, retail, or transportation. And this...
READ MORE
MEMBERS ONLY

Sector Spotlight: Decoding The S&P's Monthly Behavior With Sector Rotation and Insights!

by Julius de Kempenaer,
Senior Technical Analyst, StockCharts.com
It's the end of the month, which means it's time for me to take a look at the seasonal behavior for the S&P 500 and its sectors on this episode of StockCharts TV's Sector Spotlight. Is there is any alignment between historical...
READ MORE
MEMBERS ONLY
Economic Modern Family -- Home for the Holidays, Part 2
Over the weekend, I covered small caps, retail, semiconductors and transportation. The conclusion was that "If you put these four charts all together, we get a reunion that is filled with the makings of a family breakdown. While Granny XRT and Sister Semiconductors SMH give us investors reasons to...
READ MORE
MEMBERS ONLY

DP Trading Room: How To Time Your Trade Entries & Exits Like a Pro
by Erin Swenlin,
Vice President, DecisionPoint.com
In this week's edition of The DecisionPoint Trading Room, Erin flies solo today and gives everyone a refresher course on how to expertly time your entries and exits for trades, using the 5-minute candlestick chart. She covers the market in general, followed by analysis of sectors of interest...
READ MORE
MEMBERS ONLY

Market Secrets Revealed! Final Bar Mailbag -- US Dollar, S&P 500 ETF, Fibonacci Pivots
by David Keller,
President and Chief Strategist, Sierra Alpha Research
In this edition of StockCharts TV'sThe Final Bar, Dave devotes the show to the Mailbag. He answers viewer questions about the impact of the US Dollar on the stock market, why he uses the S&P 500 ETF rather than the S&P Index for relative...
READ MORE
MEMBERS ONLY

Wrong Data Gets Wrong Answers
by Carl Swenlin,
President and Founder, DecisionPoint.com
A recent article on the Business Insider site reported a set of Death Cross/Golden Cross signals on the Dow Jones Industrial Average ($INDU). Specifically, on November 13, the 50-day moving average crossed down through the 200-day moving average, commonly called a Death Cross. Two days later, the 50-day moving...
READ MORE
MEMBERS ONLY

Week Ahead: NIFTY Likely to Continue Consolidating; May Stay Within Broad Trading Range
by Milan Vaishnav,
Founder and Technical Analyst, EquityResearch.asia and ChartWizard.ae
The equity markets consolidated throughout the week. Although they stayed within a narrow range and traded sideways for almost all days of the week, the Indices were devoid of any directional trend. Following strong weekly gains of over 1.58% in the week before, the NIFTY chose to remain in...
READ MORE
MEMBERS ONLY

Long-term Breadth Indicators Hit Moment of Truth

by Arthur Hill,
Chief Technical Strategist, TrendInvestorPro.com
The percentage of stocks in long-term uptrends rebounded sharply in November and returned to the highs from late August and early September. This rebound is impressive, but the absolute levels are still not that inspiring. We need to see participation breakouts and higher participation levels to get the broad bull...
READ MORE
MEMBERS ONLY

Now is NOT the Time to Start a Long Trade - Be Patient!
by TG Watkins,
Director of Stocks, Simpler Trading
In this week's edition of Moxie Indicator Minutes, TG notes that the markets are deciding to hang on tight to their upper levels over the holiday week. He thinks we still need a pullback, but perhaps it will be more of a flag. Either way, initiating long trades...
READ MORE
MEMBERS ONLY

How RRG Helps Us Find Pair Trading Opportunities
by Julius de Kempenaer,
Senior Technical Analyst, StockCharts.com
KEY TAKEAWAYS
* DJ Industrials closing in on overhead resistance
* Weekly RRG showing some strong opposite rotations
* Identifying two potential pair trading setups (MSFT-MRK & NKE-CAT)
The Dow Jones Industrial Index ($INDU) is reaching overhead resistance between 35.5k and 35.7k, which means that upside potential is now limited. Even...
READ MORE
MEMBERS ONLY

Economic Modern Family -- Home for the Holidays
In the 1995 film, Home for the Holidays, family reunions are explored using both drama and comedy. The film illustrates how we outsiders looking in never really know the love and the madness that goes on inside any one family's home during Thanksgiving.
Happily, our Economic Modern Family...
READ MORE
MEMBERS ONLY
These Three Intermarket Relationships are at Key Juncture Points
by Martin Pring,
President, Pring Research
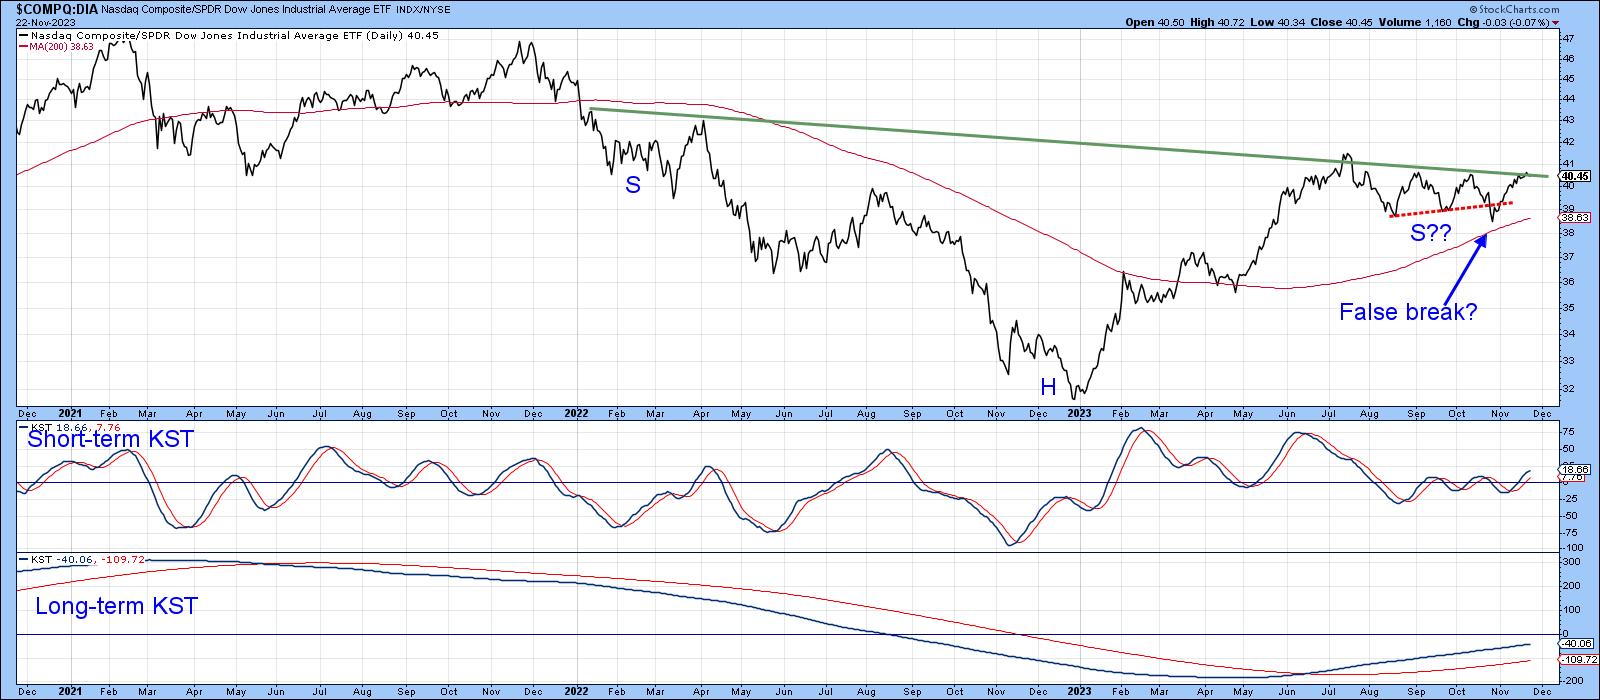
We spend a lot of time analyzing sector rotation, but there are also other relationships that can offer useful insights to internal market dynamics. One aspect of this is the relationship between market averages.
NASDAQ vs. the DJIA
As an example, Chart 1 plots the relationship between the NASDAQ Composite...
READ MORE
MEMBERS ONLY

Breadth Analysis Suggests Pullback From S&P 4600
by David Keller,
President and Chief Strategist, Sierra Alpha Research
In this edition of StockCharts TV'sThe Final Bar, Dave reviews the latest market breadth indicators, some of which are indicating a likely pullback from resistance around the 4600 level for the S&P 500. He also focuses on stocks with actionable patterns including GOOGL, NFLX, SPOT, NVDA,...
READ MORE
MEMBERS ONLY

The Stock Market In 3 Charts: Market Breadth, Bonds, Sentiment
by Jayanthi Gopalakrishnan,
Director of Site Content, StockCharts.com
KEY TAKEAWAYS
* Stock market breadth is widening which is an indication that market internals are strong
* Falling treasury yields suggest that inflation expectations are declining
* Investors are more complacent than in October which is bullish for equities
Stocks are having a good November, which aligns with typical stock market behavior....
READ MORE
MEMBERS ONLY

A NEW ERA of Growth Leadership?
by David Keller,
President and Chief Strategist, Sierra Alpha Research
In this edition of StockCharts TV'sThe Final Bar, guest Mary Ann Bartels of Sanctuary Wealth describes how falling interest rates could pave the way for another leadership by mega-cap growth stocks, including semiconductors. Host David Keller, CMT breaks down two market breadth indicators to watch into December and...
READ MORE
MEMBERS ONLY

HUGE NEWS! New SharpCharts Workbench Updates + Black Friday Week MEGA SALE

by Grayson Roze,
Chief Strategist, StockCharts.com
On this week's edition of StockCharts TV'sStockCharts in Focus, Grayson kicks off the BIGGEST week of the year here at StockCharts with two exciting announcements: our Black Friday Week sale and a fresh round of updates on the new SharpCharts Workbench. He'll show you...
READ MORE
MEMBERS ONLY
Sector Spotlight: S&P 500 - Consumer Discretionary Sector Holds the Key
by Julius de Kempenaer,
Senior Technical Analyst, StockCharts.com
On this episode of StockCharts TV's Sector Spotlight, I dive deep into rotations for asset classes and sectors. Bitcoin, as a proxy for crypto currencies as an asset class, is shooting off into the leading quadrant, while commodities are losing strength and stocks are back in the lead....
READ MORE
MEMBERS ONLY

Equity and Inflation Outlook -- Watch These Videos!
On Monday the 20th, I gave 2 interviews. The first is the clip below is from Yahoo Finance where we focus on oil and agricultural commodities.
The second interview is the Daily Briefing with Maggie Lake on Real Vision. This chart above is featured, along with:
1. Inflation thesis
2....
READ MORE
MEMBERS ONLY
Magnificent 7 Stocks Testing HUGE Resistance
by David Keller,
President and Chief Strategist, Sierra Alpha Research
In this edition of StockCharts TV'sThe Final Bar, Dave breaks down the technical setups on all of the Magnificent 7 stocks, addressing the balance between strong trends and overbought conditions. He answers viewer questions on investor sentiment, trailing stops, potential upside for TSLA, and the latest thinking on...
READ MORE
MEMBERS ONLY
Check These Out: Buyable Pullbacks Under the Surface!
by TG Watkins,
Director of Stocks, Simpler Trading
In the previous episode, TG explained that we needed to wait for the right opportunities to buy pullbacks from when the market shot up. The mega-caps and the major indexes did one small day of pulling back, but underneath that, many individual stocks have pulled back and come into buyable...
READ MORE
MEMBERS ONLY

EB Weekly Market Report - Monday, November 20, 2023

by Tom Bowley,
Chief Market Strategist, EarningsBeats.com
Sample Report
Below is our latest Weekly Market Report (WMR), which is published on Sunday/Monday of every trading week. It's unlike our Daily Market Report (DMR) as the WMR focuses almost exclusively on the Big Picture and is more designed for those with longer-term investing/trading horizons....
READ MORE
MEMBERS ONLY
My Market Trend Model is Pretty Bulled Up
by David Keller,
President and Chief Strategist, Sierra Alpha Research
KEY TAKEAWAYS
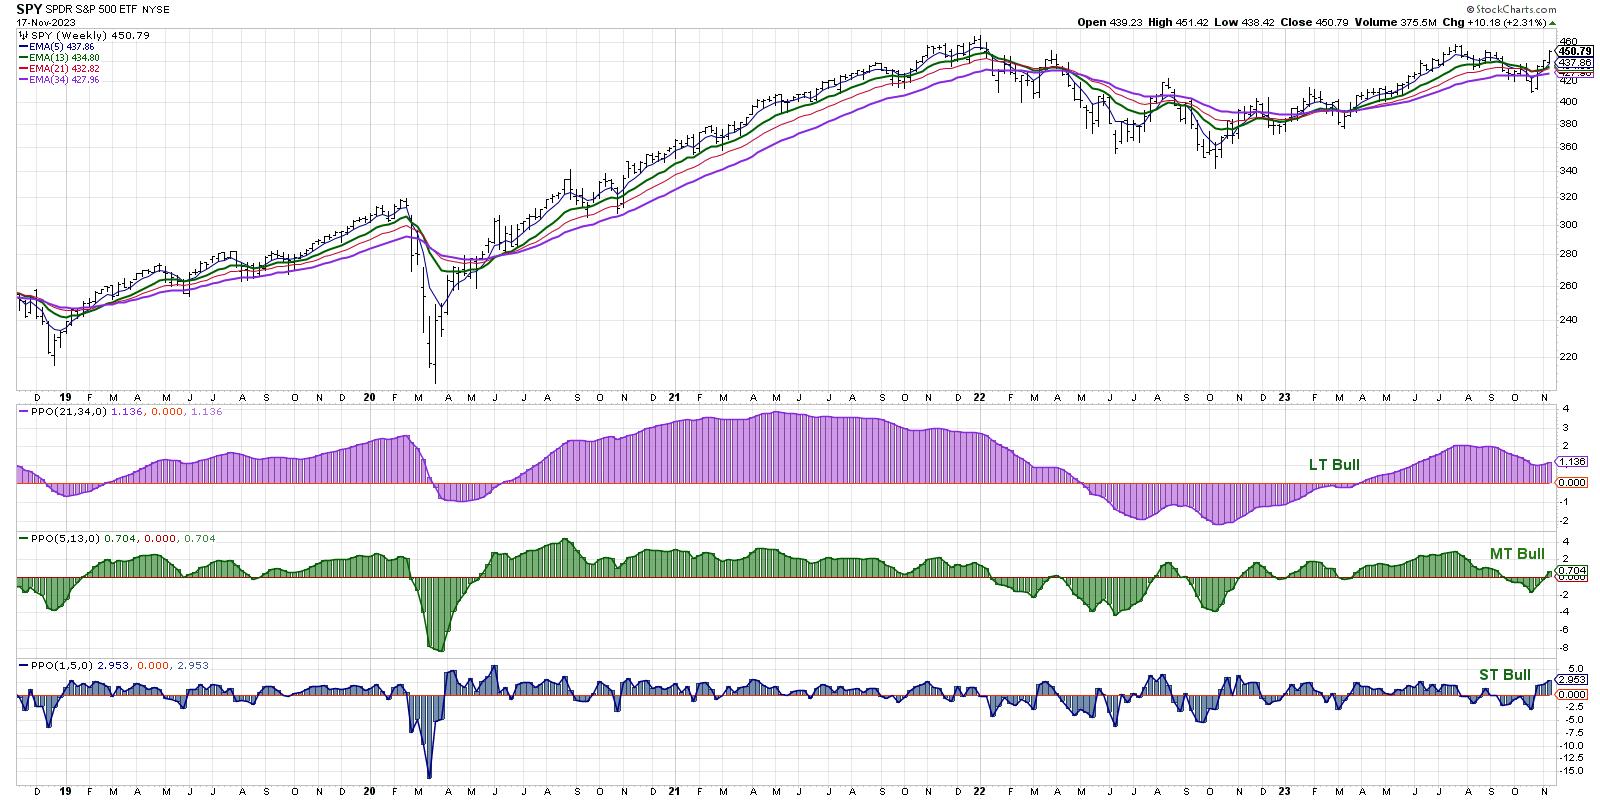
* We use a series of weekly exponential moving averages to define the trend on three time frames.
* The medium-term model just turned bullish, suggesting a risk-on environment for stocks.
* Our Market Trend Model had a similar setup in March 2022, before a downturn eliminated the bullish configuration.
Am...
READ MORE
MEMBERS ONLY

Cap-Weighted Leadership Is Unhealthy
by Carl Swenlin,
President and Founder, DecisionPoint.com
by Erin Swenlin,
Vice President, DecisionPoint.com
Below is a reprint of an article written Thursday in the subscriber-only DecisionPoint Alert:
One of the things we keep track of is the performance of the S&P 500 Index (SPY), which is cap-weighted, versus the S&P 500 Equal Weight Index (RSP). In a healthy bull...
READ MORE
MEMBERS ONLY

MEM TV: Easy Way To Uncover Best Candidates for These Markets
by Mary Ellen McGonagle,
President, MEM Investment Research
In this episode of StockCharts TV'sThe MEM Edge, Mary Ellen reveals areas of the market that are reversing lengthy downtrends and the best way to participate. She also highlights where the strength is in the markets as the uptrend remains firmly in place.
This video originally premiered November...
READ MORE
