MEMBERS ONLY

Sector Rotation Signals an Important Week Ahead for Stocks

by Julius de Kempenaer,
Senior Technical Analyst, StockCharts.com
KEY TAKEAWAYS
* Short Term, Risk-Off Sector Rotation While Heading into new week
* Did The Market Complete a H&S Top, or Is SPY Looking For Support?
* 430 Is The Crucial Level To Watch in SPY
First of all, my apologies for everybody who has been waiting for a Sector...
READ MORE
MEMBERS ONLY

GNG TV: "Go" Trends in Rates & Dollar Causing Problems for Equity

by Alex Cole,
Co-founder, GoNoGo Charts®

by Tyler Wood,
Co-founder, GoNoGo Charts®
In this edition of the GoNoGo Charts show, with rates gapping higher and breaking above resistance, Alex and Tyler walk through the macro charts that can have an impact on markets. After discussing rates, they look at the dollar, which also is in a strong "Go" trend.
This...
READ MORE
MEMBERS ONLY
Confirmed! Head-and-Shoulders Top Pattern for the S&P 500!

by David Keller,
President and Chief Strategist, Sierra Alpha Research
In this edition of StockCharts TV'sThe Final Bar, Mish Schneider of MarketGauge shares why the most important ETFs to watch are Retailers (XRT) and Small Caps (IWM) and also shares their latest plugin on the StockCharts ACP platform. Host David Keller, CMT tracks today's risk-off move...
READ MORE
MEMBERS ONLY

1-2-3 Change in Trend Setup

by Joe Rabil,
President, Rabil Stock Research
On this week's edition of Stock Talk with Joe Rabil, Joe explains the 1-2-3 change in trend sequence in multiple timeframes. First, he discusses focuses on the higher timeframe and how to identify a zone or a pool of support. Then, he shows how to take advantage of...
READ MORE
MEMBERS ONLY

It's Time to Get Long

by Larry Williams,
Veteran Investor and Author
As a follower of my "Focus on Stocks" blog, you know we had a signal to sell on the opening Sunday night (10th day left).
That was forecast last month... now I think it's time to start to get long.
Where? At the August lows.
When?...
READ MORE
MEMBERS ONLY
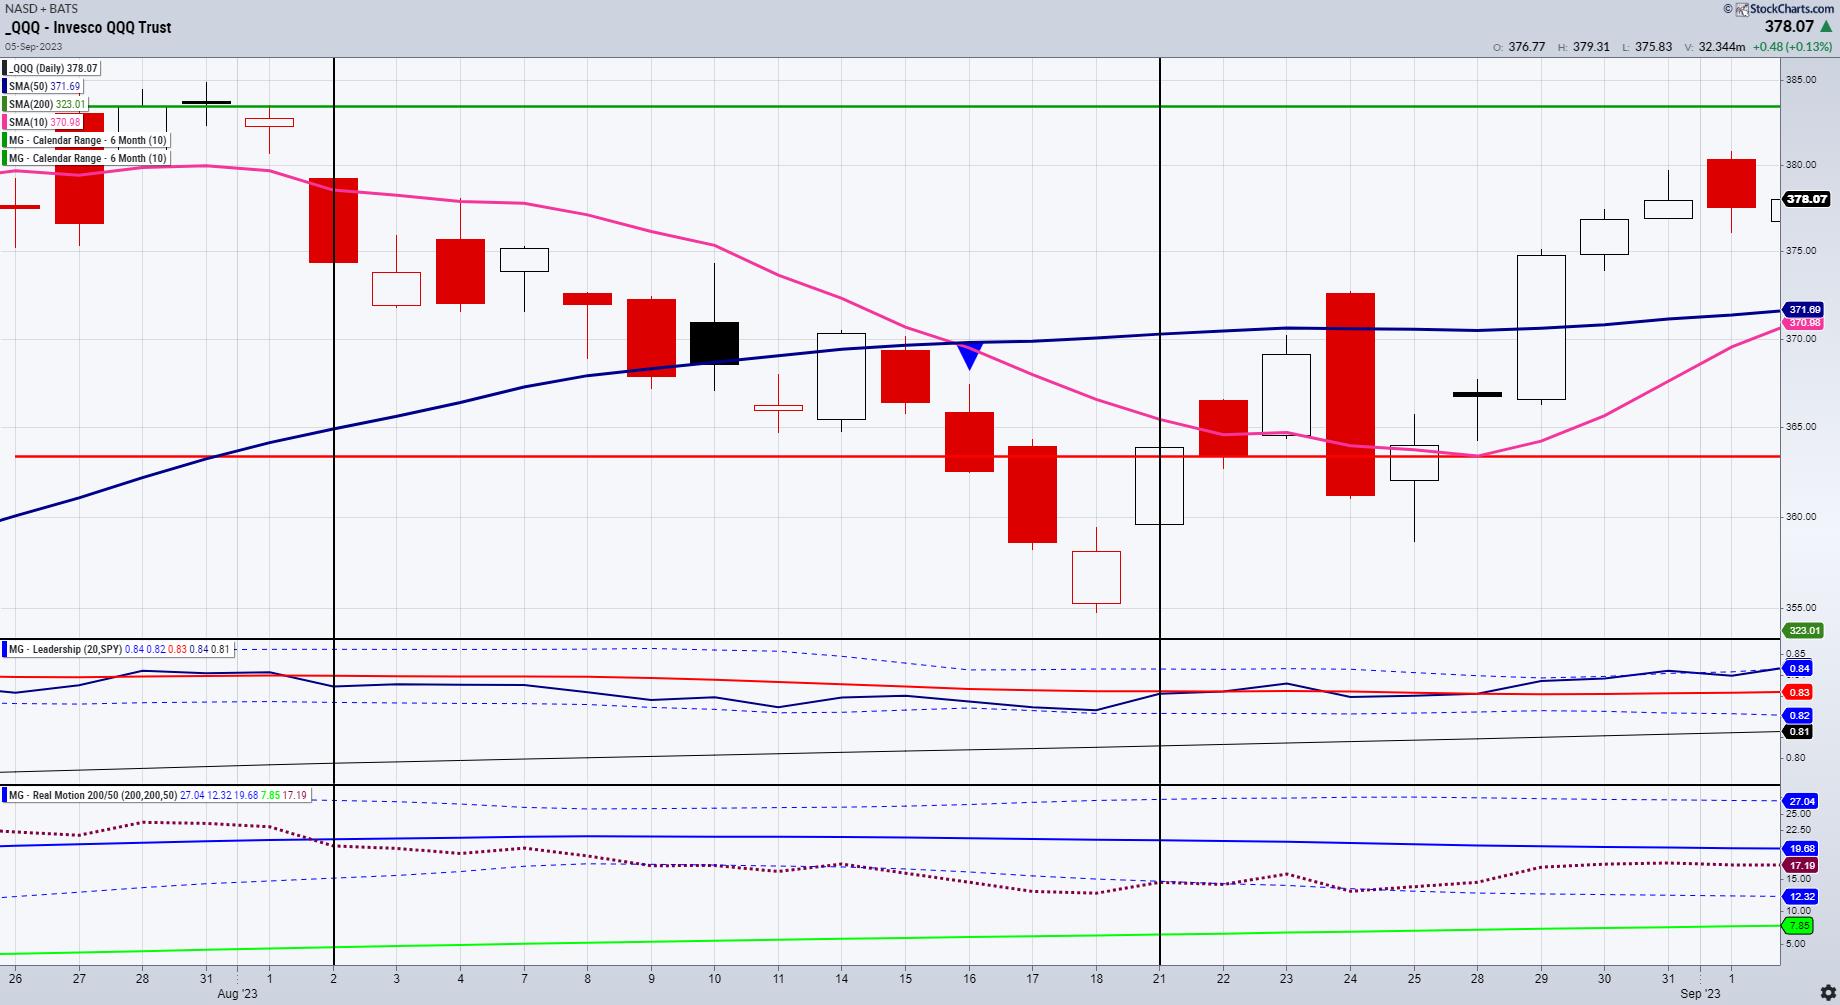
When Calendar Ranges, Leadership, Momentum and Price Align
We are so excited that StockCharts.com is now offering you our ACP plugins, we had to write about it for today's Daily, especially since you can read anywhere the thousands of differing opinions on what Powell said today and the implications for the market. Simply put, these...
READ MORE
MEMBERS ONLY

Fed Keeps Hands Off Rates, Leaves DOOR OPEN for More Hikes!
by David Keller,
President and Chief Strategist, Sierra Alpha Research
In this edition of StockCharts TV'sThe Final Bar, Danielle Shay of Simpler Trading joins Dave to discuss what's the technical take on the FAANG stocks after today's Fed announcement going into earnings season? Powell and Co. leave rates unchanged, leave the door open for...
READ MORE
MEMBERS ONLY

Jesse Livermore on Mistakes & Rising From the Ashes

by Dave Landry,
Founder, Sentive Trading, LLC
In this week's edition of Trading Simplified, Dave continues his series on Jesse Livermore. In spite of Livermore's greatness, he made a lot of mistakes, and these mistakes often resulted in him blowing up. In this episode, Dave discusses how Livermore let extraneous influences force him...
READ MORE
MEMBERS ONLY
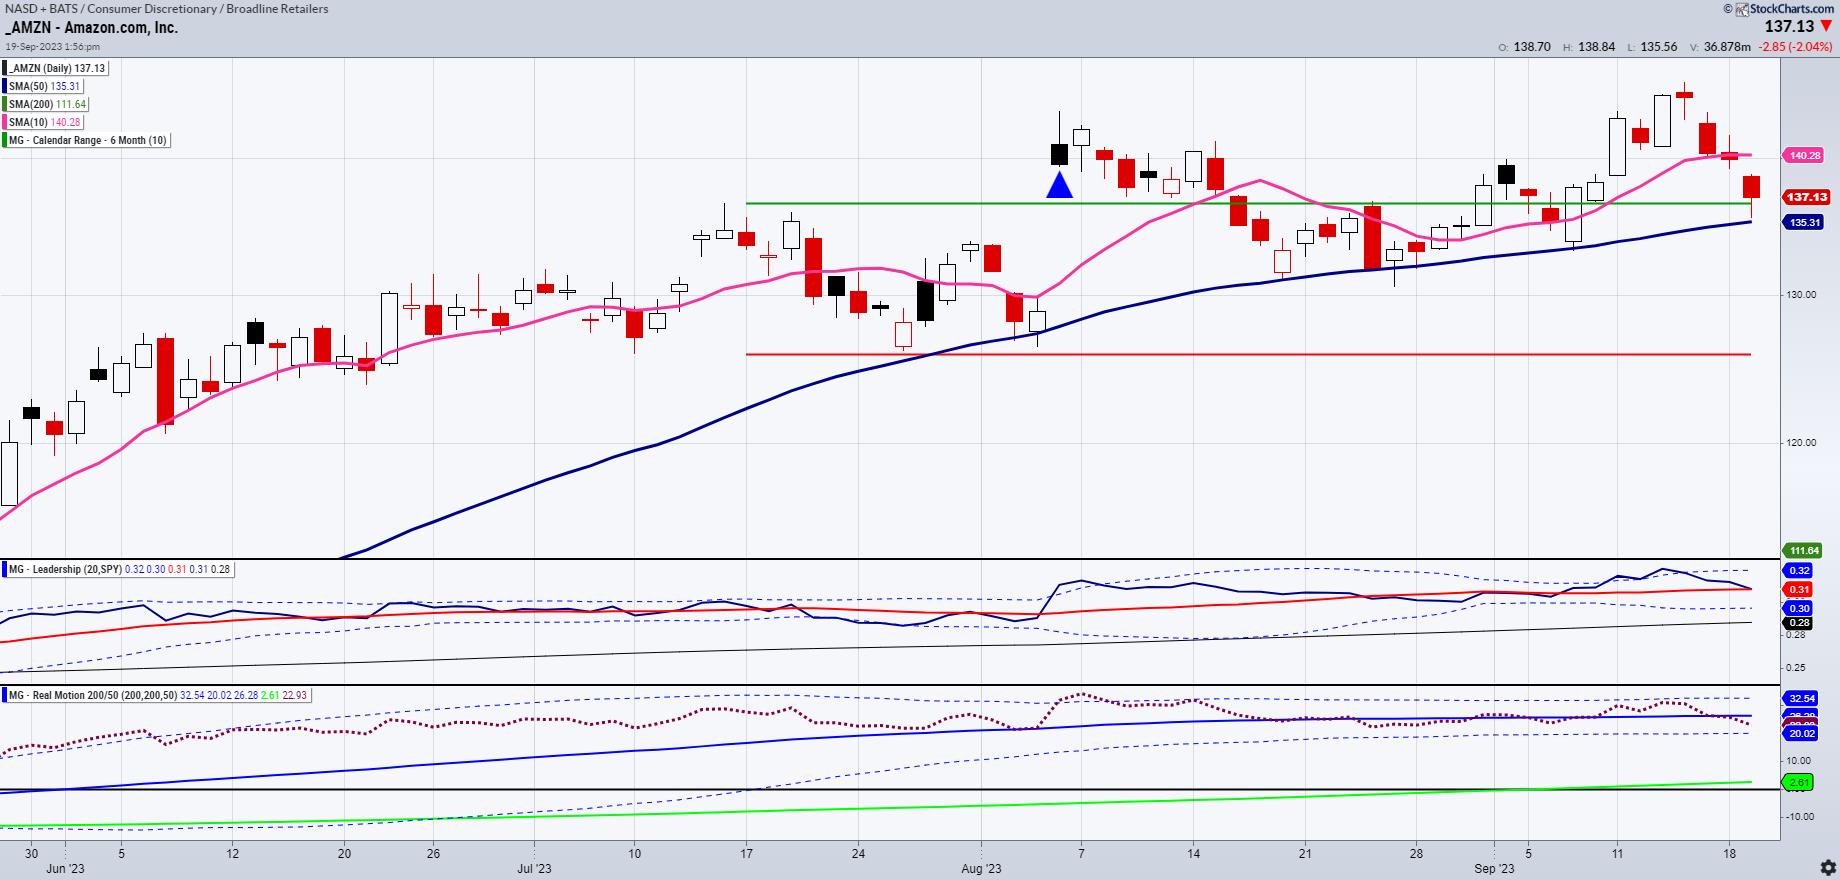
Wage Inflation: The Stats and the Underlying Implications
While the UAW strike continues, and the debate on how much it matters in the scheme of things rages on, other wage trends are emerging.
Amazon (AZMN) today announced it will hire about 250,000 logistics personnel for the holiday season at a wage of $20.50 per hour. The...
READ MORE
MEMBERS ONLY

When to BUY, When to SELL, and When to SIT On Your Hands
by David Keller,
President and Chief Strategist, Sierra Alpha Research
In this edition of StockCharts TV'sThe Final Bar, guest Dave Landry of DaveLandry.com shares his own approach to what he calls the "Three Whens"- when to buy, when to sell, and when to sit on your hands! Meanwhile, host Dave Keller reviews charts of...
READ MORE
MEMBERS ONLY
Two Charts I'm Watching Closely for Potential Breakouts

by Martin Pring,
President, Pring Research
The title of this article should really be more in the vein of two technical situations I am watching, because the long-term forces look as if they may be converging with short-term ones to form a kind of potential bullish reverse domino effect. Let's consider our first candidate,...
READ MORE
MEMBERS ONLY
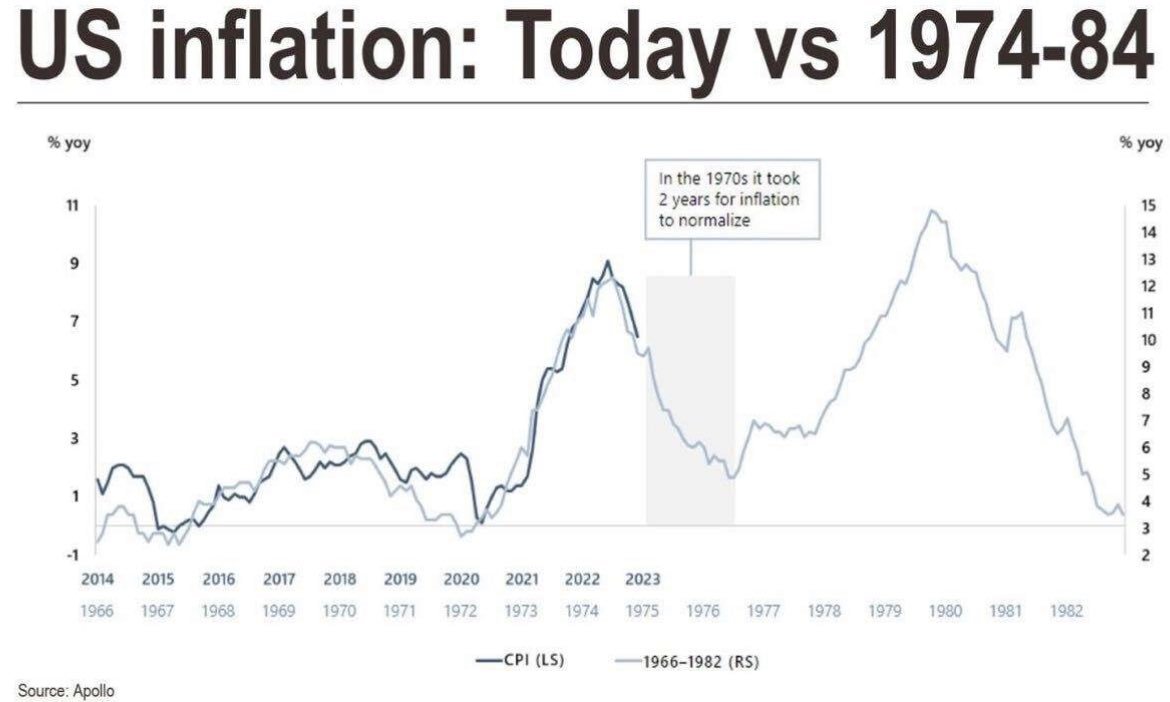
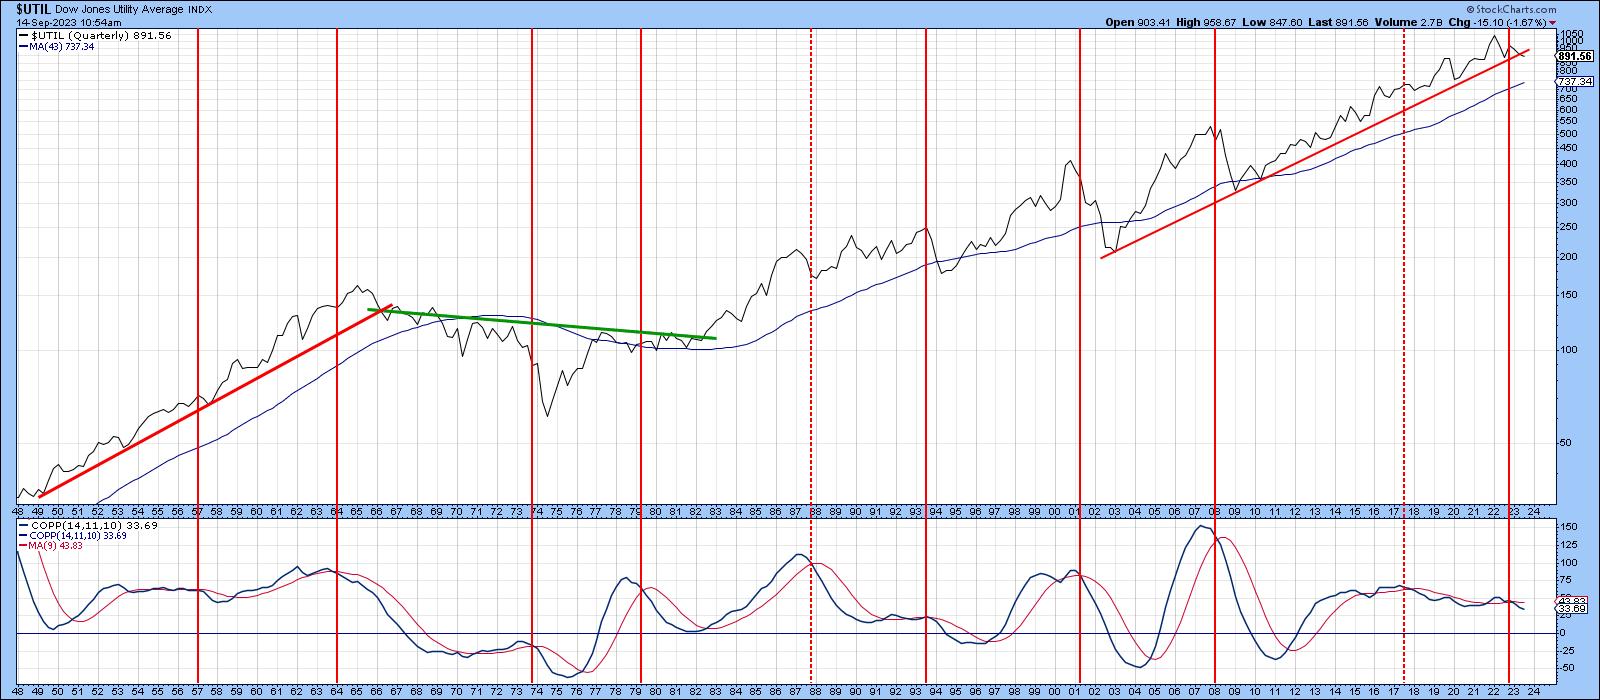
History Rhymes: 1974-1976 vs. 2022-2024?
How many of you have heard me say that commodities are inherently volatile?
Clearly, from this chart, you can see that after the oil rally in the mid 1970s, the CPI went from nearly 9% in 1974 down to 2% in 1976. Sugar, my favorite barometer of inflation, ran to...
READ MORE
MEMBERS ONLY
Analyzing Risks for Mega-Cap Growth Stocks Before Key FED Meeting
by David Keller,
President and Chief Strategist, Sierra Alpha Research
In this edition of StockCharts TV'sThe Final Bar, Dave conducts a deep dive into current market breadth indicators, including advance-decline data, the McClellan Oscillator, and the Bullish Percent Index. He reviews key support and resistance levels for AAPL, TSLA, NVDA, and other growth stocks as the market waits...
READ MORE
MEMBERS ONLY

The Halftime Show: Homebuilder and Building Product Stocks in Downtrend

by Pete Carmasino,
Chief Market Strategist, Chaikin Analytics
In this week's edition of StockCharts TV'sHalftime, Pete reviews the NVDA chart, which closed its nearest gap today. He then looks at the S&P 500 and the Nasdaq 100 charts, as well as home builder DR Horton and building products company Masco -- both...
READ MORE
MEMBERS ONLY

DP Trading Room: Mega-Caps Looking Bearish

by Erin Swenlin,
Vice President, DecisionPoint.com

by Carl Swenlin,
President and Founder, DecisionPoint.com
In this week's edition of The DecisionPoint Trading Room, Carl notes that the "Magnificent 7" stocks are looking "toppy", with only a few exceptions. These leadership stocks could put downside pressure on an already weak market. Erin picks out the strongest of the sectors...
READ MORE
MEMBERS ONLY

Q4 Stock Market Outlook: 3 Analysts, 3 Insights

by Jayanthi Gopalakrishnan,
Director of Site Content, StockCharts.com
KEY TAKEAWAYS
* Although September is considered a seasonally weak period for the stock market the fourth quarter is typically a strong period
* There's a high probability of the S&P 500 Index reaching a new high in Q4
* Growth stocks, Industrials, Financials, and Commodities could all see...
READ MORE
MEMBERS ONLY

Market Up & Down -- Don't Try to Push Your Trades

by TG Watkins,
Director of Stocks, Simpler Trading
The market continues to be weak and thin, as TG explains in this week's edition of Moxie Indicator Minutes. There are a few stocks moving up, but the majority are going sideways or down. This is not a great environment for going long, so don't try...
READ MORE
MEMBERS ONLY
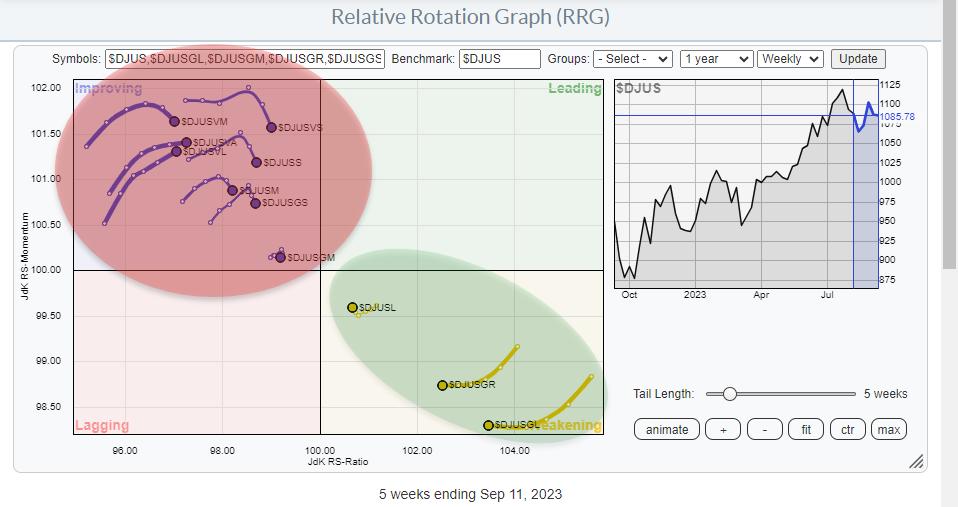
This Is The Only Segment Of The Market Worth Paying Attention To Now
by Julius de Kempenaer,
Senior Technical Analyst, StockCharts.com
KEY TAKEAWAYS
* Growth-Value Rotating Back in Favor of Growth
* Large-Cap stocks picking up Strength Over Mid- and Small-cap segments
* Hence, Large-Cap Growth Stands out Positively
RRG sending a clear message
The Relative Rotation Graph above shows the rotation for the combined Size and Growth/Value segments in the market.
And...
READ MORE
MEMBERS ONLY
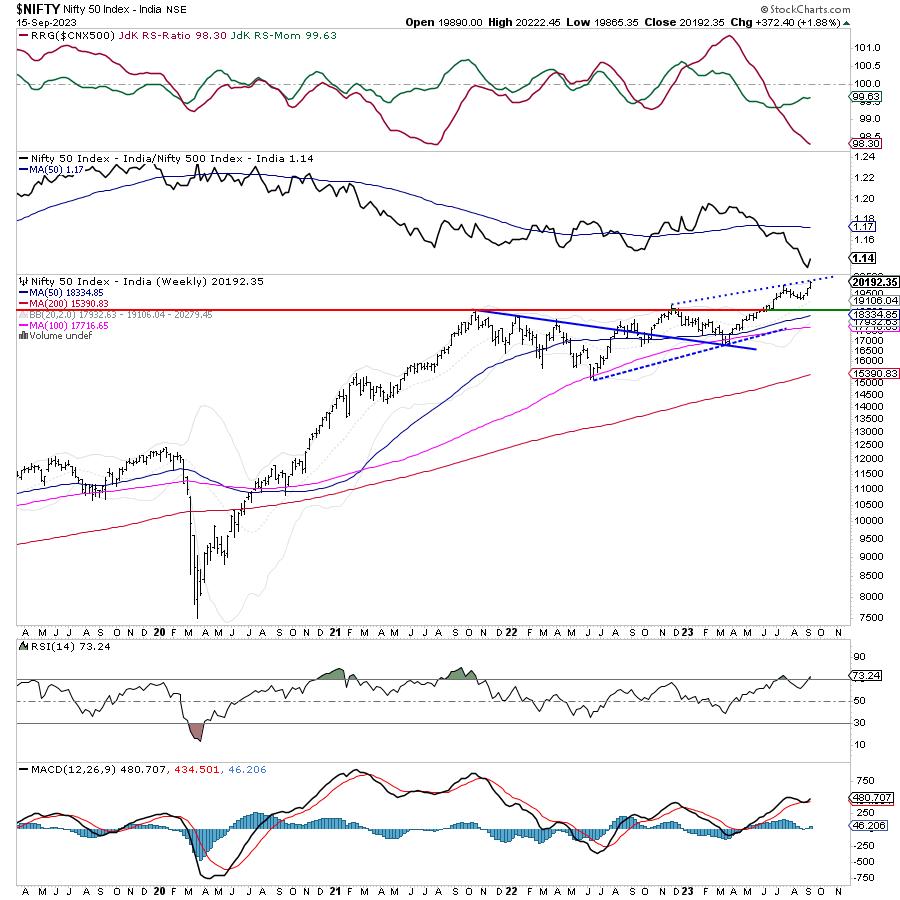
Week Ahead: Low VIX May Keep NIFTY Vulnerable To Profit-Taking Bouts; These Sectors May Offer Resilience

by Milan Vaishnav,
Founder and Technical Analyst, EquityResearch.asia and ChartWizard.ae
Extending their move, Indian equities advanced higher and closed with yet another weekly gain. Four out of five days over the past week saw the markets ending with gains. In the previous technical note, it was mentioned that the undercurrents in the market remain strong, and NIFTY can retest the...
READ MORE
MEMBERS ONLY
Sector Spotlight: The Current State of ARGoN -- Applying the Concept to 30 DOW Stocks
by Julius de Kempenaer,
Senior Technical Analyst, StockCharts.com
In this episode of StockCharts TV's Sector Spotlight, I continue my chat with Ralph Acampora in the StockCharts.com studio.
After recording our previous video (see here!), I put Ralph on the spot, and together we flip through the 30 Dow stocks, calling the current price and relative...
READ MORE
MEMBERS ONLY

MEM TV: Best Ways for You to Hedge Tech Weakness

by Mary Ellen McGonagle,
President, MEM Investment Research
In this episode of StockCharts TV'sThe MEM Edge, Mary Ellen McGonagle shares her outlook for the markets heading into next week's interest rate decision by the Federal Reserve. She also reviews why Technology was the weakest sector and what it means for the group. She then...
READ MORE
MEMBERS ONLY

Sector Spotlight: The Story of ARGoN (Acampora's Relative Grid of Nine)
by Julius de Kempenaer,
Senior Technical Analyst, StockCharts.com
In this episode of StockCharts TV's Sector Spotlight, I chat with guest Ralph Acampora in the StockCharts.com studio in Redmond, WA. We discuss the birth of ARGoN, a special way of looking at markets from both a price and a relative perspective.
Once upon a time, Ralph...
READ MORE
MEMBERS ONLY
Three ETFs Suggest Further Downside
by David Keller,
President and Chief Strategist, Sierra Alpha Research
This past week had all the potential to see a revival of the great bull market of 2023. The September inflation data, Apple's latest product announcements, and Arm's IPO all seemed had the possibility to reignite the fire of bullishness for investors.
By Friday's...
READ MORE
MEMBERS ONLY
Deep Dive Into Stop Losses, Volatility Hacks, and Bullish Rotation
by David Keller,
President and Chief Strategist, Sierra Alpha Research
In this edition of StockCharts TV'sThe Final Bar, Dave drops a special all-mailbag episode, including viewer questions on using Average True Range for stop losses, stocks vs. bonds, India's test of all-time highs, and best practices for price volatility.
This video originally premiered on September 15,...
READ MORE
MEMBERS ONLY

Larry's "Family Gathering" Full September Webinar -- AVAILABLE NOW!
by Larry Williams,
Veteran Investor and Author
Larry's "Family Gathering" webinar is now available! Whether you missed it and need to catch up, or just want to review the information Larry presented, you can now see the full recording below.
In this special presentation, Larry coaches viewers for success and explains his strategies...
READ MORE
MEMBERS ONLY

Timeless Lessons from the Godfather of Technical Analysis
by David Keller,
President and Chief Strategist, Sierra Alpha Research
In this edition of StockCharts TV'sThe Final Bar, Dave sits down with Ralph Acampora, CMT, co-founder of the CMT Association, for a memorable conversation on all things technical analysis. They review lessons learned from the October 2022 market low, words of wisdom for traders new to technical analysis,...
READ MORE
MEMBERS ONLY
GNG TV: Growth & Energy LEAD as S&P Chops Around
by Alex Cole,
Co-founder, GoNoGo Charts®
by Tyler Wood,
Co-founder, GoNoGo Charts®
In this edition of the GoNoGo Charts show, Alex and Tyler present trend analysis across the asset classes, sectors, and individual securities. The continued strong "Go" conditions in the US Dollar index (UUP) and US Treasury rates ($TNX) on both the daily and weekly timeframes highlights some headwinds...
READ MORE
MEMBERS ONLY
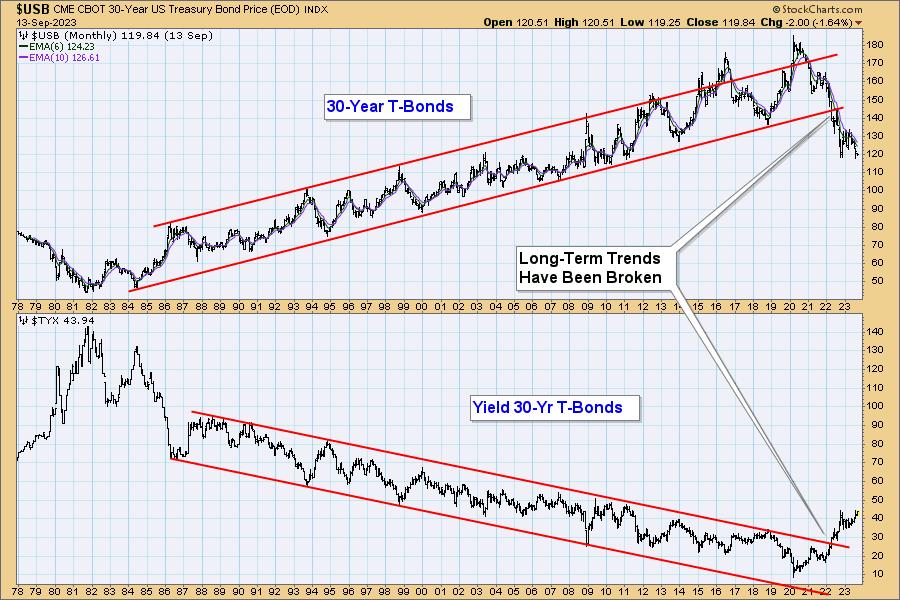
Bonds: Don't Forget the Long-Term Trend
by Carl Swenlin,
President and Founder, DecisionPoint.com
Many of the forecasts I hear regarding bonds seem to be based upon what bonds have done for most of the last 40 years, without acknowledging what has happened more recently. The chart below shows that 30-Year T-Bonds were in a rising trend from the 1982 low, but, in early...
READ MORE
MEMBERS ONLY
This Sector Looks Really Sick Long-Term
by Martin Pring,
President, Pring Research
The overall market has been rallying since registering its low last October. However, there is one sector which, in August, fell below its October low on a monthly closing basis. More serious is the fact that it recently violated a 23-year secular up trendline. Can you guess which sector I...
READ MORE
MEMBERS ONLY
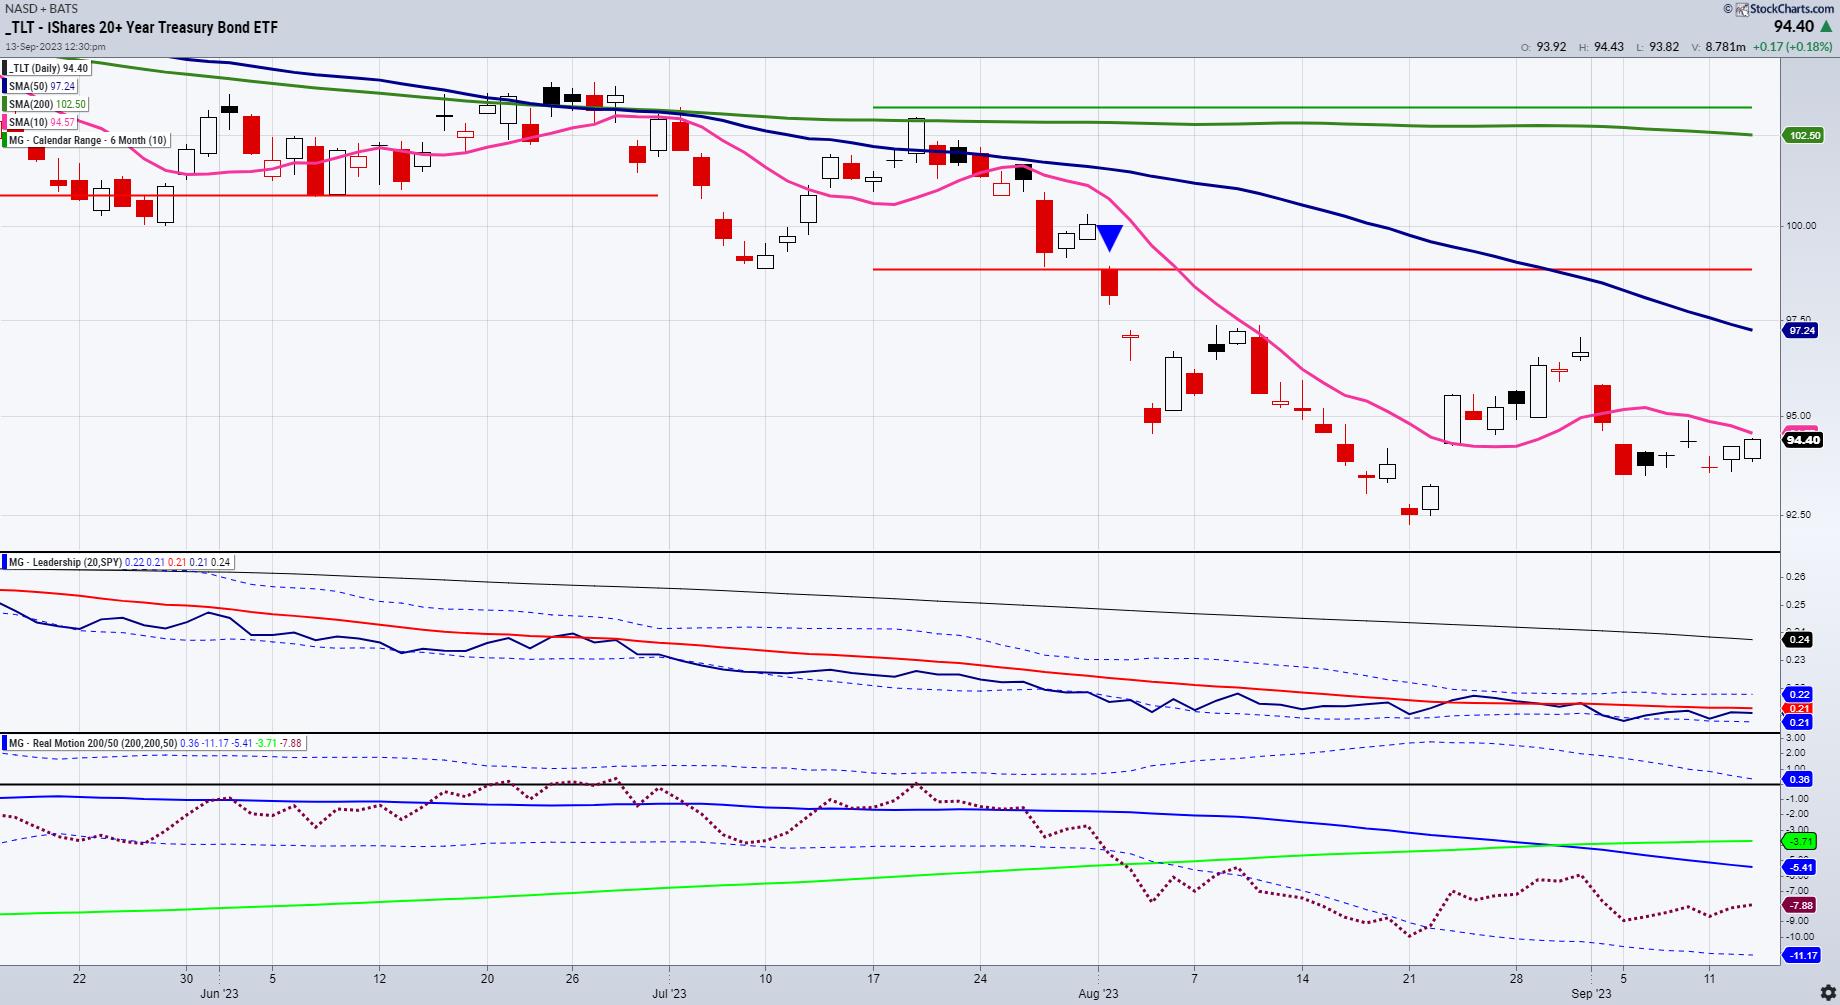
Fresh Look at Long Bonds
I doubt any of our readers are too surprised by the CPI reading coming in a bit hotter than expected.
The bulk of it was in energy costs. Food costs were, mixed with bread and meat, up, while eggs and milk were down. Services inflation was up slightly, while shelter...
READ MORE
MEMBERS ONLY
Sector Rotation Analysis Still Quite Bullish
by David Keller,
President and Chief Strategist, Sierra Alpha Research
In this edition of StockCharts TV'sThe Final Bar, guest Julius de Kempenaer of RRG Research shows how his market visualizations still show stocks over bonds and offense over defense. Host David Keller, CMT highlights one industry sector breaking down due to higher crude oil prices.
This video originally...
READ MORE
MEMBERS ONLY
The Halftime Show: 6 ETFs That Are on My Radar
by Pete Carmasino,
Chief Market Strategist, Chaikin Analytics
In this week's edition of StockCharts TV'sHalftime, Pete reviews 6 ETFs that are in different stages of trends. Two in the banking sector are in downtrends that are undeniable: KRE and KBE. This review ties in the recent commentary from Jamie Dimon, the CEO of JP...
READ MORE
MEMBERS ONLY
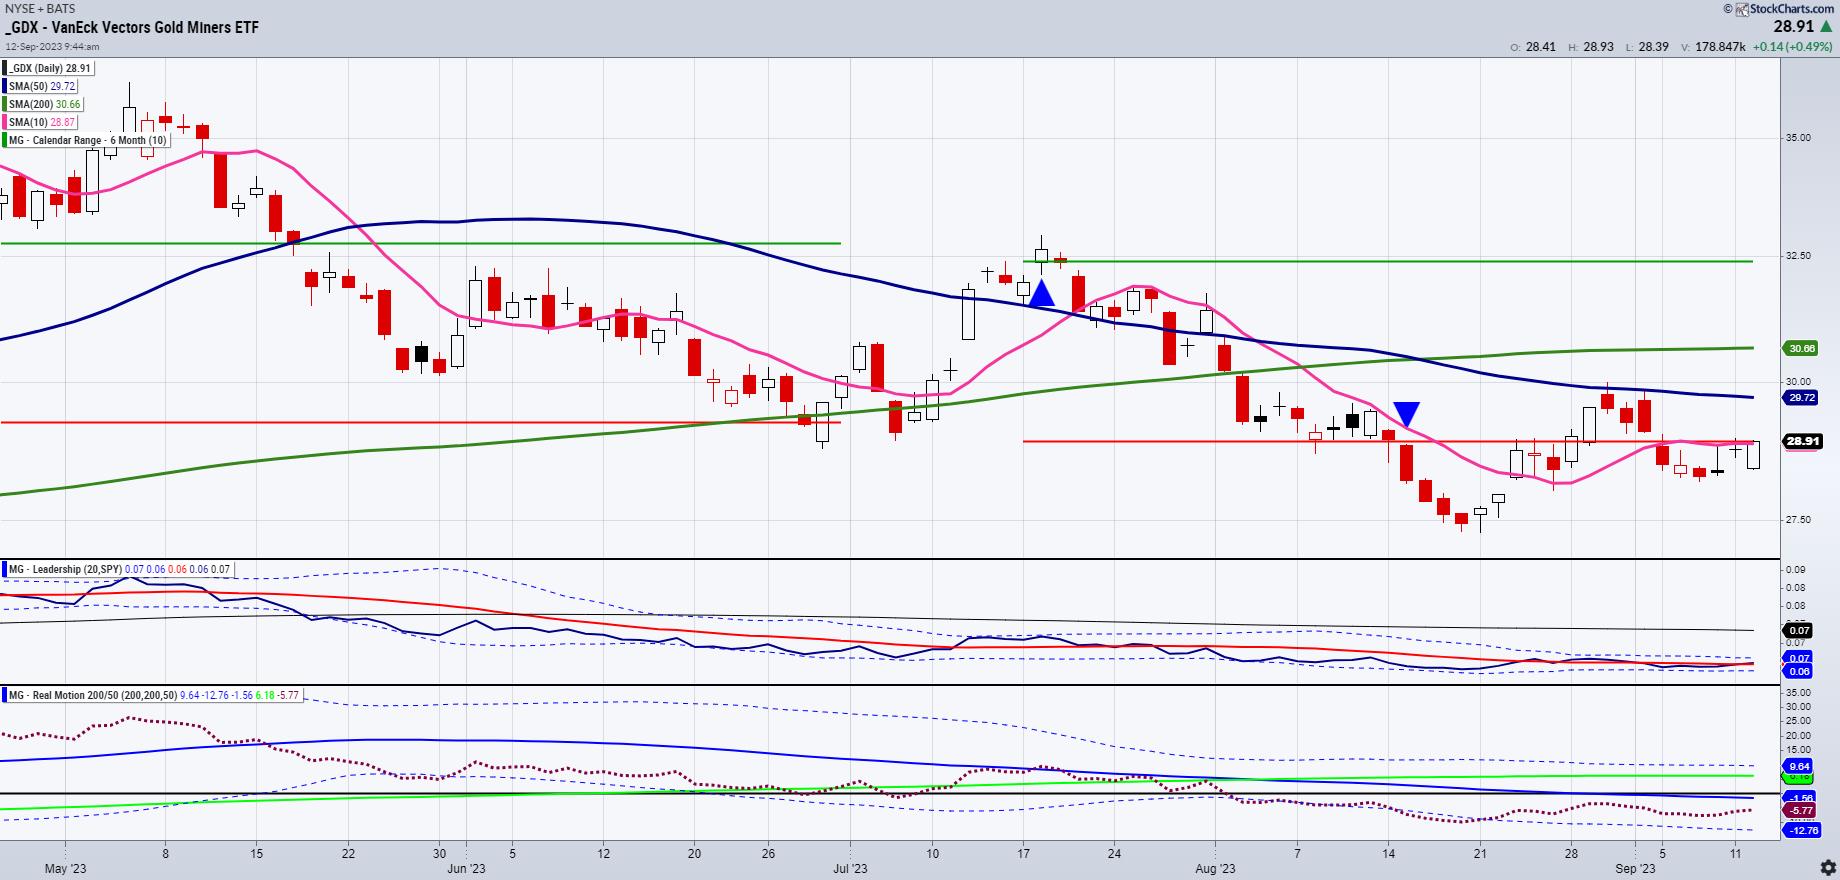
Finding and Trading Instrument Bottoms
In June, we wrote about the bottom in oil and cannabis through USO and MSOS (ETFs) respectively. In July, we wrote about the potential top in NASDAQ and SPY. In August, we wrote about the importance of the retail sector; XRT is below the July calendar range and a major...
READ MORE
MEMBERS ONLY
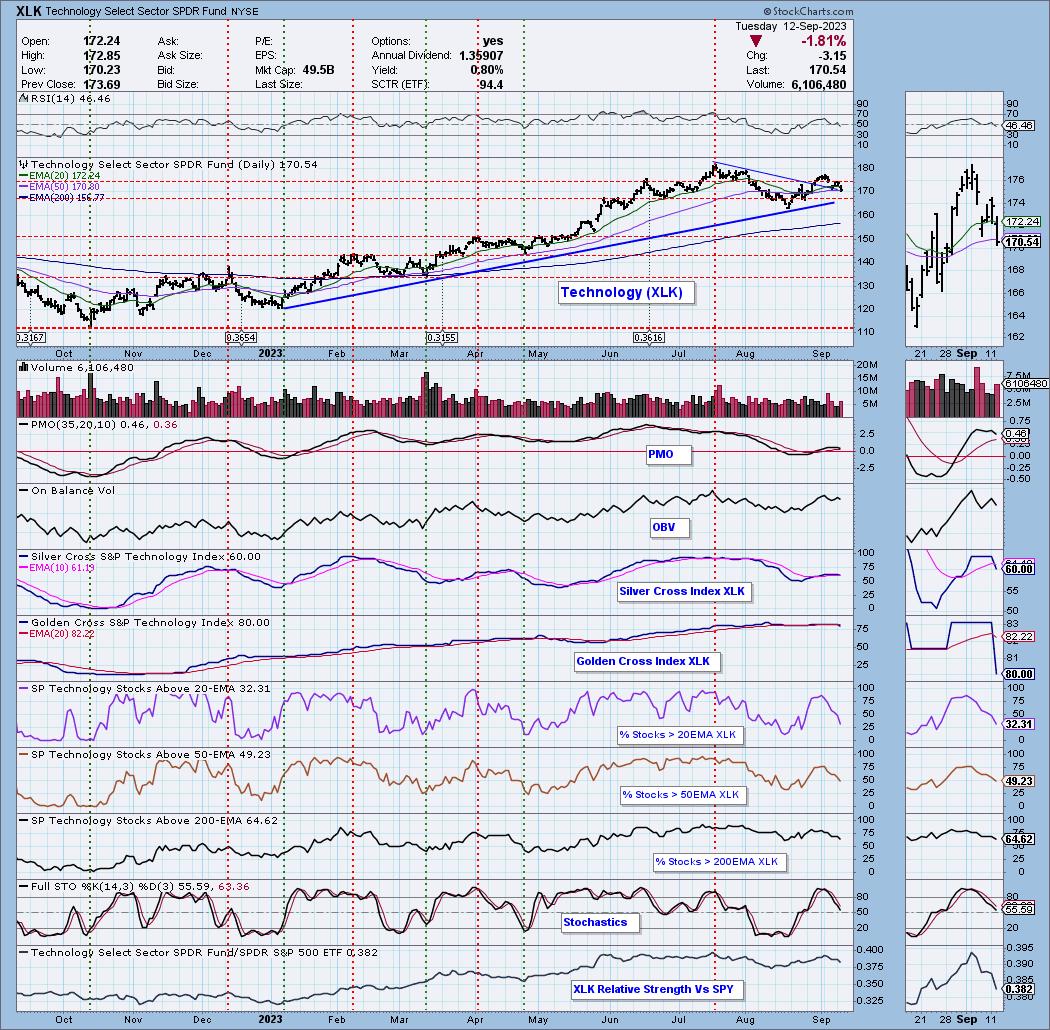
Technology, Last Man Standing... Falls
by Erin Swenlin,
Vice President, DecisionPoint.com
KEY TAKEAWAYS
* XLK "Bearish Shifts" Move IT and LT Bias to BEARISH
* XLK PMO Nearing Crossover SELL Signal
In Monday's DecisionPoint Trading Room we discussed that Technology (XLK) was the last one standing on our Bias Scoreboard with a Bullish Bias in both the intermediate term...
READ MORE
MEMBERS ONLY
The Bull Case for Commodities
by David Keller,
President and Chief Strategist, Sierra Alpha Research
In this edition of StockCharts TV'sThe Final Bar, David Cox, CFA CMT of Raymond James reviews underperformance for defensive sectors like Utilities and describes why commodities should be an area of focus for investors. Host David Keller, CMT reviews today's drop in ORCL and AAPL as...
READ MORE
MEMBERS ONLY
Larry's LIVE "Family Gathering" Webinar Airs THIS WEEK - Thursday, September 14th at 3:00pm EDT!
by Larry Williams,
Veteran Investor and Author
Larry is going LIVE! Don't miss the upcoming "Family Gathering" webinar with Larry Williams, airing live through Zoom this Thursday, September 14th at 3:00pm EDT.
In this must-see event, Larry will be presenting his current opinions on a broad variety of current market topics, directly...
READ MORE
MEMBERS ONLY

Chesapeake Energy: A Stock That Could Pump Much More
by Jayanthi Gopalakrishnan,
Director of Site Content, StockCharts.com
KEY TAKEAWAYS
* Chesapeake Energy stock has been trending higher since June 2023
* Chesapeake Energy stock has room for upside growth
* CHK could benefit from the rise in crude oil prices
In addition to analyzing the stock market's overall performance, running scans when the market opens and after it...
READ MORE
MEMBERS ONLY
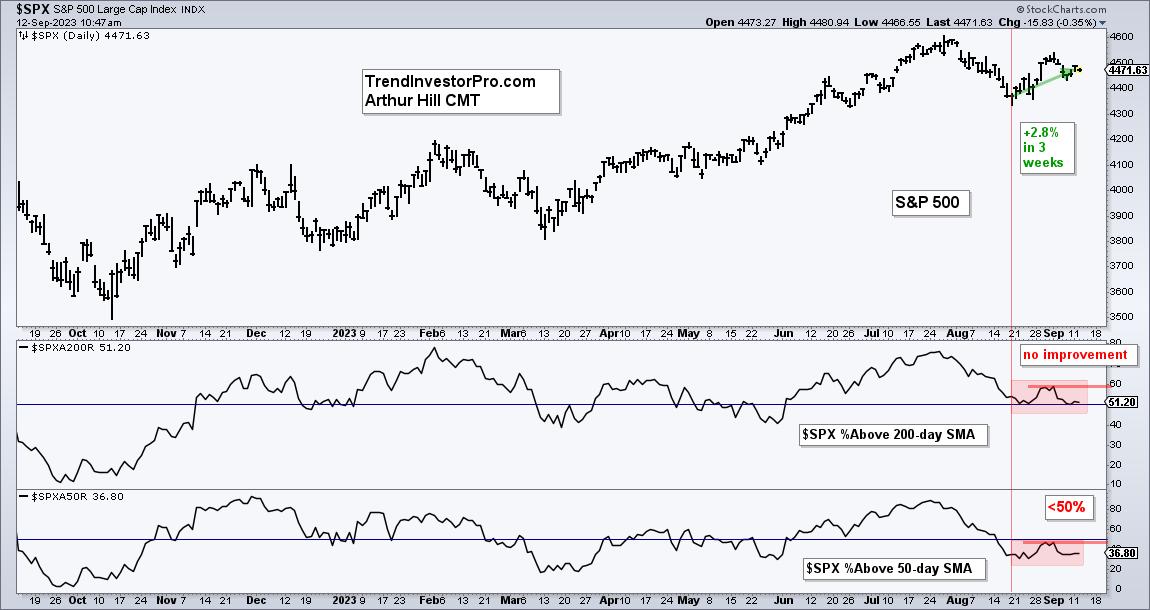
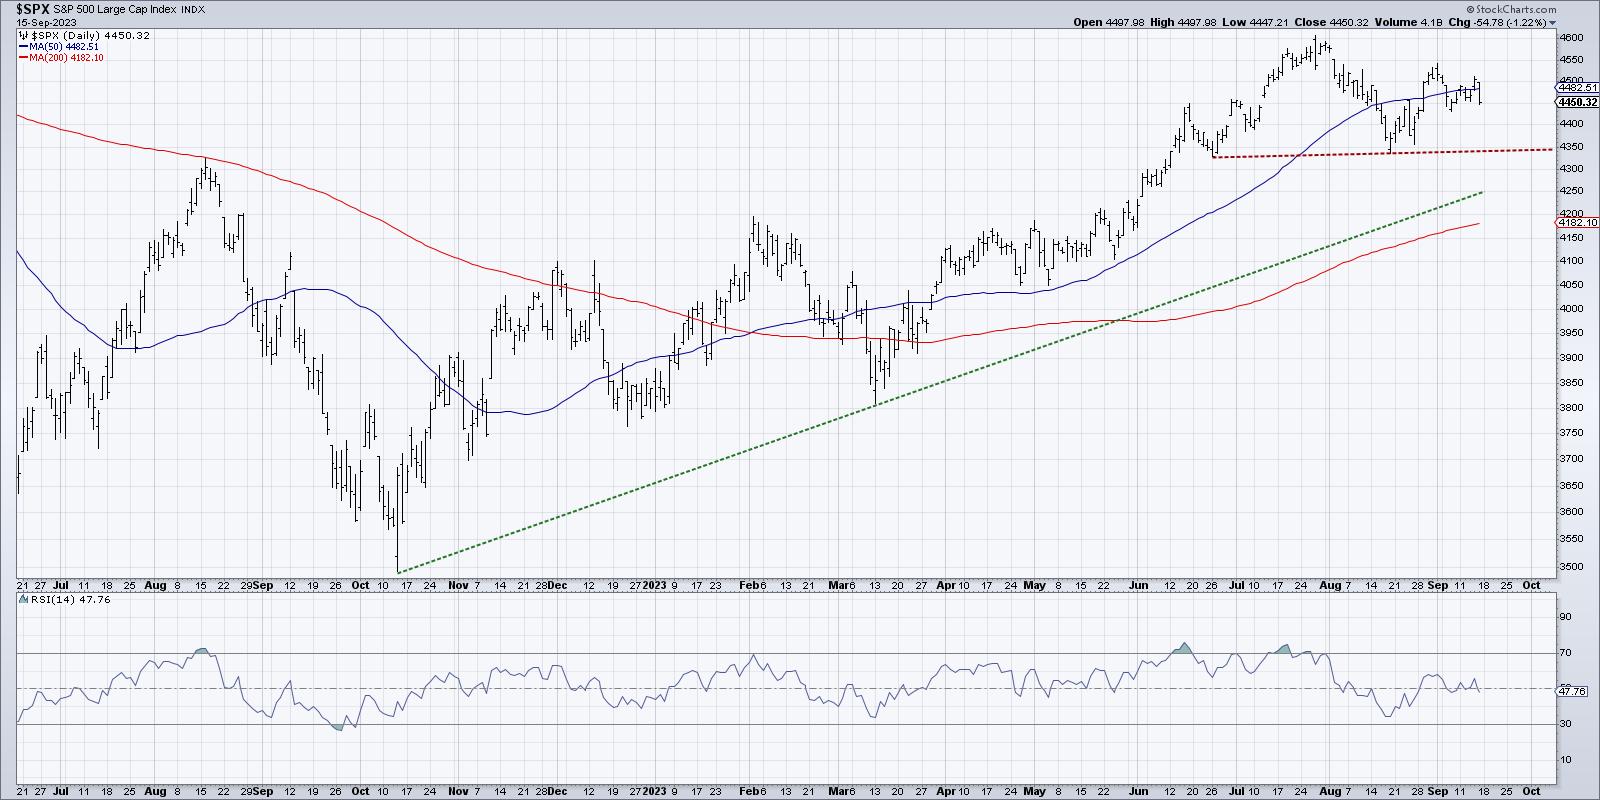
Breadth is Not Keeping Pace with the Bounce

by Arthur Hill,
Chief Technical Strategist, TrendInvestorPro.com
The S&P 500 SPDR bounced the last three weeks, but we did not see an improvement in breadth. Weak breadth is also reflected in performance for mid-caps and small-caps, which are lagging. Even so, SPY and QQQ are in short-term uptrends and I am watching the tech sector...
READ MORE
MEMBERS ONLY
DP Trading Room: Can Tech's Bullish Bias Hold?
by Erin Swenlin,
Vice President, DecisionPoint.com
by Carl Swenlin,
President and Founder, DecisionPoint.com
In this week's edition of The DecisionPoint Trading Room, Carl reviews the markets and shares the new DecisionPoint BIAS assessment list. Erin concentrates on Technology (XLK) and Utilities (XLU). Technology is only sector holding a bullish bias in the intermediate and long terms, will that hold up? Utilities...
READ MORE
MEMBERS ONLY
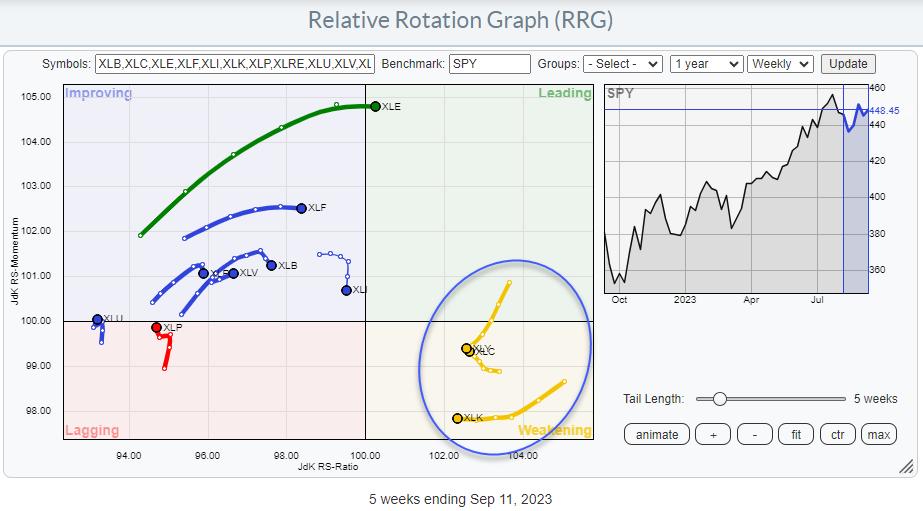
Looks Like a Strong Rotation to The Leading RRG Quadrant is Around the Corner for Three Sectors
by Julius de Kempenaer,
Senior Technical Analyst, StockCharts.com
KEY TAKEAWAYS
* Three Sectors Are Ready to Rotate Back Towards the Leading Quadrant
* Technology, Discretionary, and Communication Services Together Are Almost Half Of Total Market Cap
* Daily Tails for these sectors are supporting the looming positive rotation for their weekly counterparts
First of all, for those who are awaiting a...
READ MORE
