MEMBERS ONLY

NASDAQ BREAKS SUPPORT -- THE DOW AND S&P 500 MAY BE NEXT -- HALFWAY TO RECESSION?

by John Murphy,
Chief Technical Analyst, StockCharts.com
A BAD APRIL ENDS UNDER PRESSURE... Stocks fell sharply on Friday to end one of the weakest months in recent memory. The Nasdaq market lost -13.2% to register its worst month since 2008. The S&P 500 and Dow lost -8.8% and -4,9 % and experienced the...
READ MORE
MEMBERS ONLY

Yields May Be Peaking for a While

by Martin Pring,
President, Pring Research
A few weeks ago, I wrote a piece entitled "The Fed Raises Rates; What if it's Already Priced into the Market?". The idea was to point out that the Fed is a lagging indicator and that multiple bond yields had already reached mega resistance in the...
READ MORE
MEMBERS ONLY

HAWKISH FED PUSHES STOCKS SHARPLY LOWER -- MAJOR INDEXES SUFFER DOWNSIDE REVERSAL DAY -- 200 DAY AVERAGES PROVIDE RESISTANCE
by John Murphy,
Chief Technical Analyst, StockCharts.com
50-BASIS POINT HIKE ON THE TABLE FOR FED MAY MEETING... Today's statement by Fed Chairman Jerome Powell that a 50-basis point rate hike was on the table for May, combined with other hawkish comments, pushed stocks sharply lower today. And their technical condition continues to weaken. Particularly disturbing...
READ MORE
MEMBERS ONLY

Does Recent Stock Market Action Indicate a Recession?
by Martin Pring,
President, Pring Research
I've been reading and hearing a lot about an impending recession, which reminds me of the saying that, when everyone thinks alike, everyone is usually wrong. That's not to say everyone is expecting a recession, but we may have reached a point where there is sufficient...
READ MORE
MEMBERS ONLY

Is it Time to Get Bearish?

by Larry Williams,
Veteran Investor and Author
Larry is back in this new StockCharts TV special! There's a lot of opinions out there about what the curve means and talking heads are flapping all over about inflation. In this video, Larry shows the actual history of what this means so you can make informed decisions....
READ MORE
MEMBERS ONLY

STOCKS END THE WEEK ON THE DOWNSIDE -- SECTOR ALIGNMENTS SEND WARNING SIGNALS
by John Murphy,
Chief Technical Analyst, StockCharts.com
STOCKS CONTINUE TO WEAKEN... The technical condition of major U.S. stock indexes continues to weaken. All three shown below lost more ground during the week. Chart 1 shows the Dow Industrials meeting overhead resistance near their red 200-day moving average. Chart 2 shows the S&P 500 trading...
READ MORE
MEMBERS ONLY

Has the Bitcoin Bubble Burst?
by Martin Pring,
President, Pring Research
In early December of last year, I wrote an article on whether Bitcoin had reached the tipping point in terms of signaling a peak in the crypto bubble. Some may disagree about the "bubble" label; however, it seems to me that a financial category coming out of nowhere...
READ MORE
MEMBERS ONLY

SECTOR RANKINGS REMAIN DEFENSIVE...HEALTHCARE HITS NEW RECORD WHILE TECHNOLOGY WEAKENS....DOW AVERAGES SIGNAL MORE CAUTION
by John Murphy,
Chief Technical Analyst, StockCharts.com
WEEKLY SECTOR RANKING... A rebound on Friday leaves the major stock indexes either flat or with minor losses for the week. The weekly sector rankings in Chart 1, however, show a lot of movement beneath the surface. One factor that stands out is that defensive stock groups continue to show...
READ MORE
MEMBERS ONLY
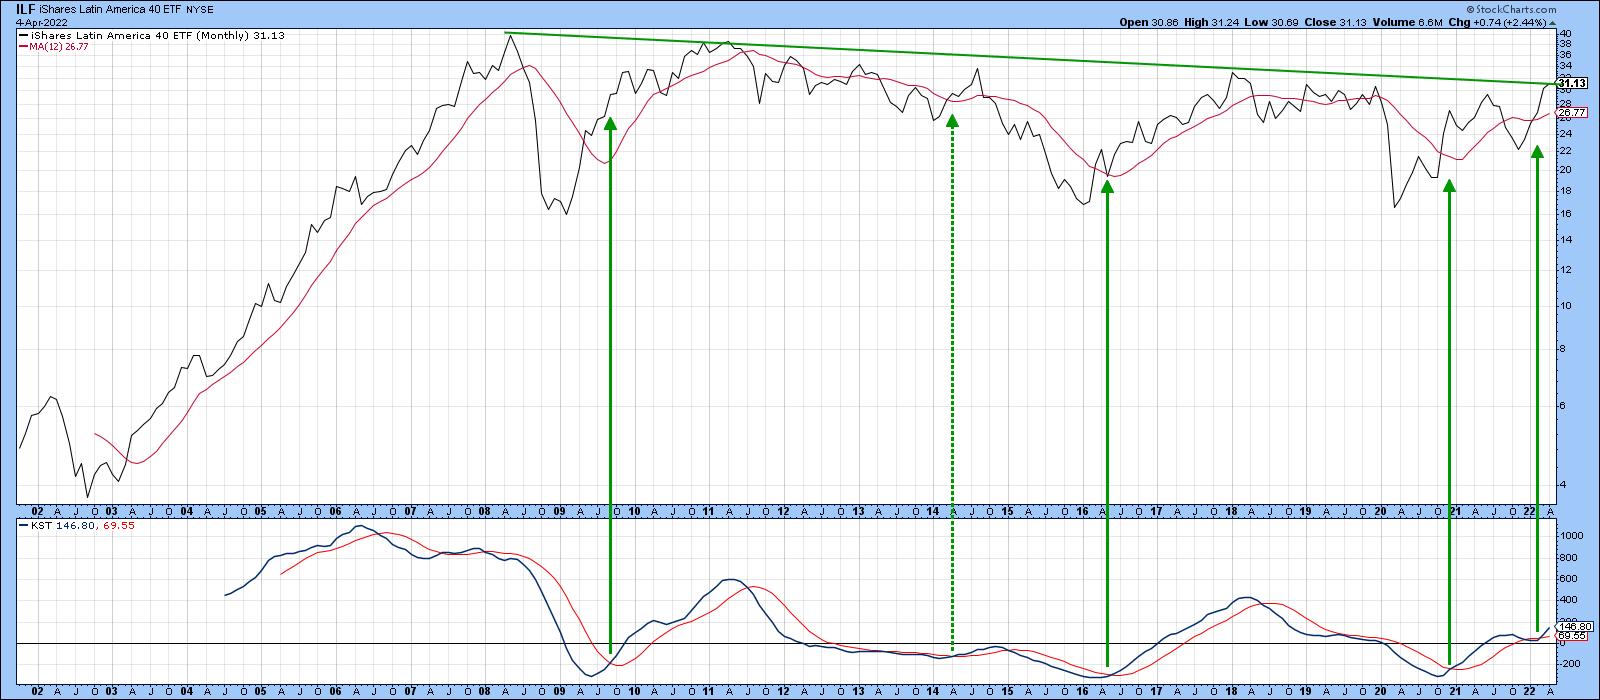
Watch this Market for a Huge Potential Upside Breakout
by Martin Pring,
President, Pring Research
At the turn of the century, this ETF achieved a ten-timer, rallying from $4 in 2002 to $40 in 2008. It's been consolidating for the last 12 years and looks set to embark on a move to new all-time highs. It's not a tech stock, nor...
READ MORE
MEMBERS ONLY

DEFENSIVE SECTORS LEAD THIS WEEK -- FLATTER YIELD CURVE MAY BE HURTING BANKS -- YIELD CURVE NEARS INVERSION
by John Murphy,
Chief Technical Analyst, StockCharts.com
STOCKS HAVE WORST QUARTER IN TWO YEARS...The month of March has seen a rebound in stocks. Even with that rebound, however, the first quarter of this year has been the weakest in two years. Which raises the bigger question of whether or not the recent rebound is the start...
READ MORE
MEMBERS ONLY

The Fed Raises Rates; What If it's Already Priced into the Market?
by Martin Pring,
President, Pring Research
Markets discount the future, so if the Fed tells the market it's going to raise rates, it goes ahead and raises them anyway. Why wait on the railroad tracks when you know a train is coming? Ironically, the widely-telegraphed rate rise has arrived at a time when bond...
READ MORE
MEMBERS ONLY

S&P 500 CLEARS ITS 200-DAY MOVING AVERAGE -- COMMODITY STOCKS CONTINUE TO LEAD -- UTILITIES HIT A NEW RECORD
by John Murphy,
Chief Technical Analyst, StockCharts.com
STOCKS ADVANCE FOR A SECOND WEEK...Major U.S. stock indexes gained ground for the second week in a row building the case for a short-term bottom having been formed. And one of them has cleared an important resistance line. Chart 1 shows the S&P 500 moving back...
READ MORE
MEMBERS ONLY

Three Intermarket Relationships that are Forecasting Higher Stocks and Yields
by Martin Pring,
President, Pring Research
Changing relationships between differing asset classes and markets do not speak that often. When they do, strong evidence that important changes may be afoot is often provided. One of the characteristics that has caught my attention since the beginning of the year is that, on one side, stocks been reacting...
READ MORE
MEMBERS ONLY

PULLBACK IN OIL CONTRIBUTES TO STOCK RALLY -- BUT HAWKISH FED MAY LIMIT UPSIDE POTENTIAL
by John Murphy,
Chief Technical Analyst, StockCharts.com
STOCKS HAVE VERY STRONG WEEK... Major U.S. stock indexes registered their strongest week since November 2020. And they also broke through some initial resistance levels. The week's strong action signals that stocks have put in a short-term bottom and may continue to gain some ground. Their longer-range...
READ MORE
MEMBERS ONLY

Don't Be Surprised if the NASDAQ Jumps from Here
by Martin Pring,
President, Pring Research
I've been bearish on the NASDAQ -- or, more specifically, on its relative action against the S&P Composite -- for about a year. Now that the financial press has announced that the Index, by virtue of passing the somehow magic -20% level, has "entered bear...
READ MORE
MEMBERS ONLY

SURGE IN COMMODITY PRICES IS TYPICAL LATE - CYCLE BEHAVIOR
by John Murphy,
Chief Technical Analyst, StockCharts.com
STOCKS USUALLY PEAK AFTER BONDS... One of the most important features of intermarket analysis is the rotation that normally takes place between bonds, stocks, and commodities at major turning points in the business cycle. That rotation between the three asset classes is especially relevant to the current global situation. Those...
READ MORE
MEMBERS ONLY

A Tale of Two Sectors
by Martin Pring,
President, Pring Research
The Business Cycle and Sector Rotation
The business cycle undergoes a set series of chronological events which are also related to primary trend peaks in bonds stocks and commodities, as laid out in Figure 1. You can read about this concept in greater detail here. Based on the position of...
READ MORE
MEMBERS ONLY

GLOBAL STOCKS REMAIN UNDER PRESSURE AS CRUDE OIL TESTS OVERHEAD RESISTANCE -- GRAIN PRICES ARE ALSO SURGING
by John Murphy,
Chief Technical Analyst, StockCharts.com
WEST TEXAS CRUDE OIL REACHES 11-YEAR HIGH... The war in Ukraine continues to push oil prices sharply higher along with other commodities. That includes metals and agricultural products. Gold continues to gain ground as a traditional haven during times of rising inflation and increased global tensions. Some defensive money is...
READ MORE
MEMBERS ONLY
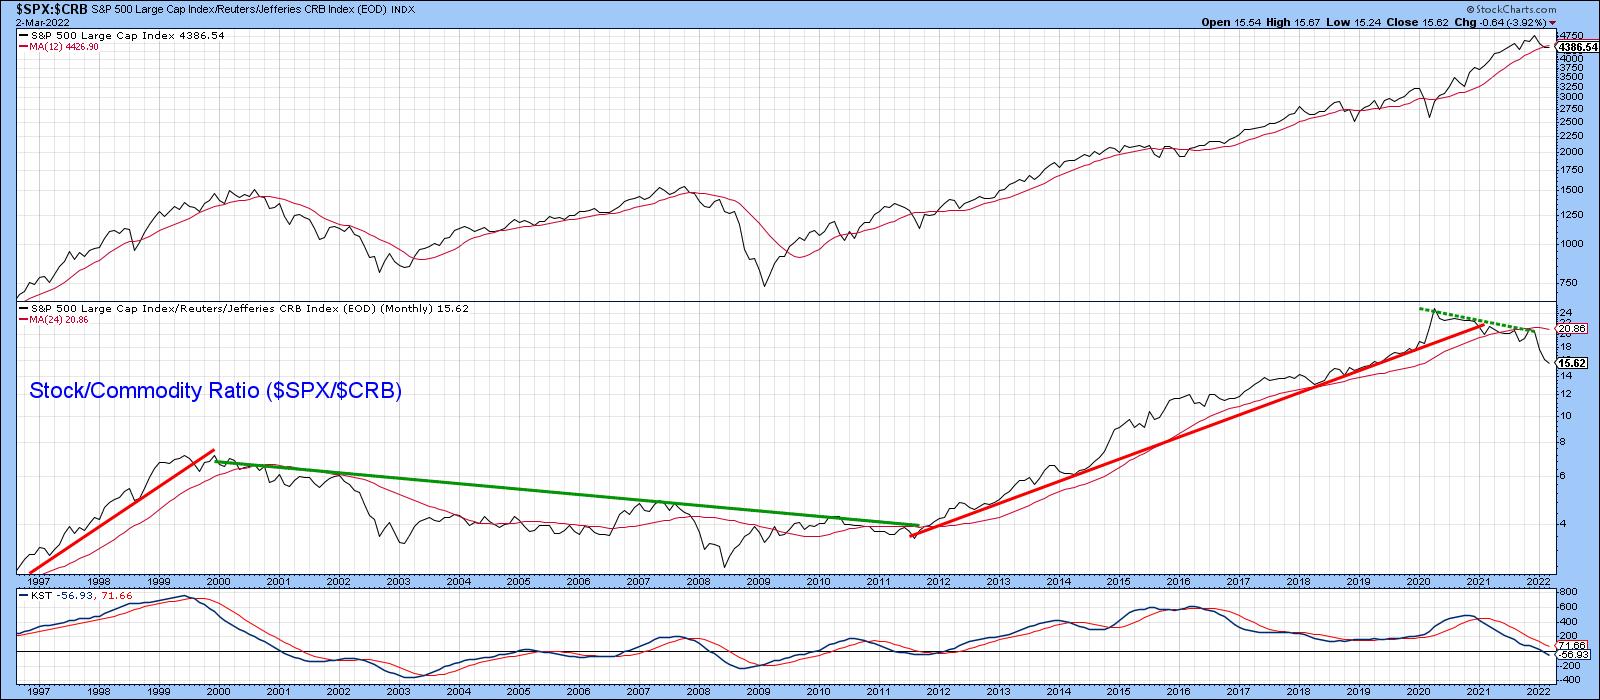
Three Implications if Commodities Outperform Stocks
by Martin Pring,
President, Pring Research
Chart 1 shows that, starting in early 2020, stocks began to slowly but quietly underperform commodities. Since the start of this year, though, this trend has begun to really accelerate on the downside, i.e. moving in favor of commodities. The center window also shows when a lengthy trendline of...
READ MORE
MEMBERS ONLY

STOCKS REGAIN EARLIER LOSSES FOLLOWING OUTBREAK OF WAR IN EUROPE -- LONGER-RANGE TREND NOT ENCOURAGING
by John Murphy,
Chief Technical Analyst, StockCharts.com
SELLING THE RUMOR AND BUYING THE FACT... Thursday morning's heavy selling of stocks and the buying of traditional safe havens like bonds, gold, and oil reversed sharply that same afternoon. Stocks rose while safe havens lost most of their morning's gains. That more positive trend continued...
READ MORE
MEMBERS ONLY

STOCK INDEXES BREAK JANUARY LOWS -- GOLD AND OIL SPIKE HIGHER WHILE BONDS REBOUND -- WE MAY BE HEADING INTO STAGFLATION
by John Murphy,
Chief Technical Analyst, StockCharts.com
STOCK INDEXES REACH NEW LOWS ON RUSSIAN INVASION... News of a full-scale Russian invasion of Ukraine is pushing global stocks sharply lower and pushing money into traditional safe havens like gold, oil, and bonds. The price of West Texas crude oil spiked to $100 this morning while gold prices also...
READ MORE
MEMBERS ONLY

Major Top or Double Bottom?
by Martin Pring,
President, Pring Research
In a recent late January article,I pointed out that many market averages had fallen to key support levels at a time when a lot of them were experiencing selling climaxes. This kind of condition is usually followed by a rally or basing period, but I also noted that other...
READ MORE
MEMBERS ONLY

RISING UKRAINE TENSIONS ARE PUSHING GOLD TO THE HIGHEST LEVEL IN EIGHT MONTHS -- GOLD MINERS ARE ALSO RALLYING
by John Murphy,
Chief Technical Analyst, StockCharts.com
RISING TENSIONS BOOST GOLD... With increased warnings that a Russian invasion of Ukraine is likely, investors are selling stocks around the world. And they're buying gold which is usually viewed as a traditional safe haven in times of heightened global tensions. Chart 1 shows the Gold Shares SPDR...
READ MORE
MEMBERS ONLY

Gold Breaks Out for the Fourth Time in the Past Year -- But is it for Real this Time?
by Martin Pring,
President, Pring Research
Since its August 2020 high, gold has been a very tricky market to call. Let me put it another way; it has been easy to call, but exasperatingly difficult to call correctly because of the numerous false breakouts that have taken place in the last 18 months-or-so. Monday's...
READ MORE
MEMBERS ONLY
Will There Be a Bear Market?
by Larry Williams,
Veteran Investor and Author
In this new StockCharts TV special, Larry Williams shares what he thinks is coming up. He walks us through the historical data, shares the points he believes are the most important to take into consideration and goes on record with his answer to the question everyone is asking - are...
READ MORE
MEMBERS ONLY

INFLATION FEARS PUSH BOND YIELDS HIGHER AND STOCKS LOWER --THE DOW AND S&P 500 TRADE BELOW 200-DAY LINES -- THE NASDAQ 100 MEETS RESISTANCE AT ITS RED LINE
by John Murphy,
Chief Technical Analyst, StockCharts.com
STOCKS FAIL TEST OF MOVING AVERAGE LINES... Thursday's CPI report showed January inflation rising 7.5% on an annual basis which was the highest number in four decades (since 1982). That higher inflation number raised prospects for a more aggressive Fed starting next month, and pushed stocks sharply...
READ MORE
MEMBERS ONLY

The Effect of this Bearish Weekly Two-Bar Reversal is About to Test the Bull Market Case for the Dollar Index
by Martin Pring,
President, Pring Research
Before we look at the two-bar reversal, let's first review the long-term technical position for the Dollar Index. It's laid out on a quarterly basis in Chart 1, along with a Coppock momentum indicator. The first thing to note is that the Index is positioned below...
READ MORE
MEMBERS ONLY

SHORT-TERM MARKET BOUNCE RUNS INTO SELLING -- MEASURING OVERHEAD RESISTANCE LEVELS
by John Murphy,
Chief Technical Analyst, StockCharts.com
SHORT-TERM BOUNCE RUNS INTO RESISTANCE... My last message showed the three major stock indexes in an oversold condition and trying to bounce from underlying chart support. So the recent stock rebound wasn't a surprise. Neither was the size of the rebound. The combination of overhead resistance and today&...
READ MORE
MEMBERS ONLY

Examining the Monthly Bar Charts for a Possible Reversal
by Martin Pring,
President, Pring Research
Usually, when we are identifying one or two bar price patterns or candlesticks, it's because they appear close to a turning point, thereby giving us a trading edge. From a practical point of view, it makes sense to observe daily or intraday price action. That's because...
READ MORE
MEMBERS ONLY

OVERSOLD STOCK INDEXES ATTEMPT TO STABILIZE NEAR CHART SUPPORT -- BUT BREADTH FIGURES PAINT A WEAKER PICTURE
by John Murphy,
Chief Technical Analyst, StockCharts.com
OVERSOLD MARKET ATTEMPTS TO STABILIZE... After an incredibly volatile week of trading, stocks are in a short-term oversold condition and attempting to stabilize near chart support. Chart 1 shows the Dow Industrials stabilizing near a flat support line drawn under their June low. At the same time, the 14-day RSI...
READ MORE
MEMBERS ONLY

Some Indexes Break Down from Major Price Patterns: Selling Climaxes Offer Hope!
by Martin Pring,
President, Pring Research
I am a great believer in the principle of false breaks being followed by above-average moves in the opposite direction to the break. It happens because those who bought on it are caught on the wrong side of the market and are forced to re-position themselves, just as correctly positioned...
READ MORE
MEMBERS ONLY

THE STOCK MARKET'S TECHNICAL CONDITION CONTINUES TO WEAKEN -- IMPORTANT SUPPORT LEVELS ARE BEING TESTED OR BROKEN
by John Murphy,
Chief Technical Analyst, StockCharts.com
NASDAQ CONTINUES TO LEAD MARKET DECLINE...Stocks are suffering through another bad week, with the Nasdaq market continuing to lead the decline. The Nasdaq Composite Index has also suffered the most technical damage. It fell below its 200-day moving average last week. Chart 1 shows the COMPQ falling below its...
READ MORE
MEMBERS ONLY

Two Market Segments That Look Set for a Big Move
by Martin Pring,
President, Pring Research
Recently, I have been drawn to two specific-but-unrelated areas of market activity. Both are experiencing an extremely fine balance between buyers and sellers and, as a result, are likely to experience a big move in one direction or the other. These are the copper price and small cap stocks. Let&...
READ MORE
MEMBERS ONLY

NEGATIVE DIVERGENCES WEIGH ON STOCKS -- NASDAQ COMPOSITE TESTS ITS 200-DAY AVERAGE -- SMALL CAPS CONTINUE TO UNDERPERFORM -- ENERGY SECTOR LEADS WHILE TECHNOLOGY LAGS.
by John Murphy,
Chief Technical Analyst, StockCharts.com
NEGATIVE DIVERGENCES ON SPX... A number of negative divergences have shown up on the major stock indexes which have weakened the market's technical condition. Those divergences are showing up mainly in daily momentum oscillators. Chart 1 shows the S&P 500 rallying to a new record at...
READ MORE
MEMBERS ONLY

What Do Staples, Energy and Financials Have in Common?
by Martin Pring,
President, Pring Research
Technology outperformed throughout the second decade of this century, but the times they are a-changin', as it is clear that this sector has lost enough mojo in the last year to indicate that a basic transformation in market leadership is underway. Just to be clear, I am not saying...
READ MORE
MEMBERS ONLY
A Look into the Future: 2022 Forecast
by Larry Williams,
Veteran Investor and Author
Larry presents his predictions for the markets in 2022 in this new StockCharts TV special. Can the future really be known? In general, Larry thinks so. But, as he always says, trust but verify, and the proof is in the pudding. Larry looks back at his previous presentations and forecasts...
READ MORE
MEMBERS ONLY

BOND YIELDS RISE ON MORE HAWKISH FED -- TECH STOCKS LEAD NASDAQ LOWER -- ENERGY AND FINANCIAL STOCKS SHOW LEADERSHIP
by John Murphy,
Chief Technical Analyst, StockCharts.com
FED MINUTES PUSH STOCKS LOWER... The release of Fed minutes yesterday from its December meeting reflected a more hawkish tone which pushed stocks lower and interest rates higher. The Nasdaq took the biggest hit owing to a big drop in technology shares which are the most vulnerable to rising rates....
READ MORE
MEMBERS ONLY

Yields Breaking or About to Break Out All Over
by Martin Pring,
President, Pring Research
I had thought that rates would moderate a little at the beginning of 2022, as the economic growth rate slowed due to COVID and other factors. Not so, as yields across the spectrum have resumed their bull market rally in anticipation of higher inflation and a less accommodative central bank....
READ MORE
MEMBERS ONLY

STOCKS ENDING TRADING WEEK ON A STRONG NOTE -- S&P 500 NEARS OLD HIGH -- SEASONAL TREND REMAINS POSITIVE -- BUT MARKET BREADTH LAGS BEHIND
by John Murphy,
Chief Technical Analyst, StockCharts.com
STOCK INDEXES GAIN GROUND... Stocks are ending the trading week on a strong note as shown in the three charts below. The most notable one belongs to the S&P 500 in Chart 2 which is nearing a test of its old high. Ten of eleven stock sectors are...
READ MORE
MEMBERS ONLY

Two Intermarket Relationships Worth Monitoring for Early 2022
by Martin Pring,
President, Pring Research
Last week, I pointed out three charts that had triggered bullish signals and suggested that these characteristics were strong enough to power the market higher. Prices immediately sold off, but have subsequently rebounded. Since those charts are still positive, I am sticking to the higher market over the next 2-4...
READ MORE