MEMBERS ONLY

FOUR DECADE HIGH IN INFLATION PUSHES STOCK AND BOND PRICES SHARPLY LOWER -- BOND YIELD NEARING MAJOR UPSIDE BREAKOUT -- NO SIGN OF A TOP IN OIL

by John Murphy,
Chief Technical Analyst, StockCharts.com
HOT CPI REPORT SIGNALS LOWER STOCK PRICES... Friday's report that the May Consumer Price Index gained 8.6% from the previous year was the highest inflation rate in more than forty years and pushed stock prices sharply lower for the day and week. Going into the report, expectations...
READ MORE
MEMBERS ONLY

This Sector Bucked Last Friday's Decline and Could Be Ready to Take Off

by Martin Pring,
President, Pring Research
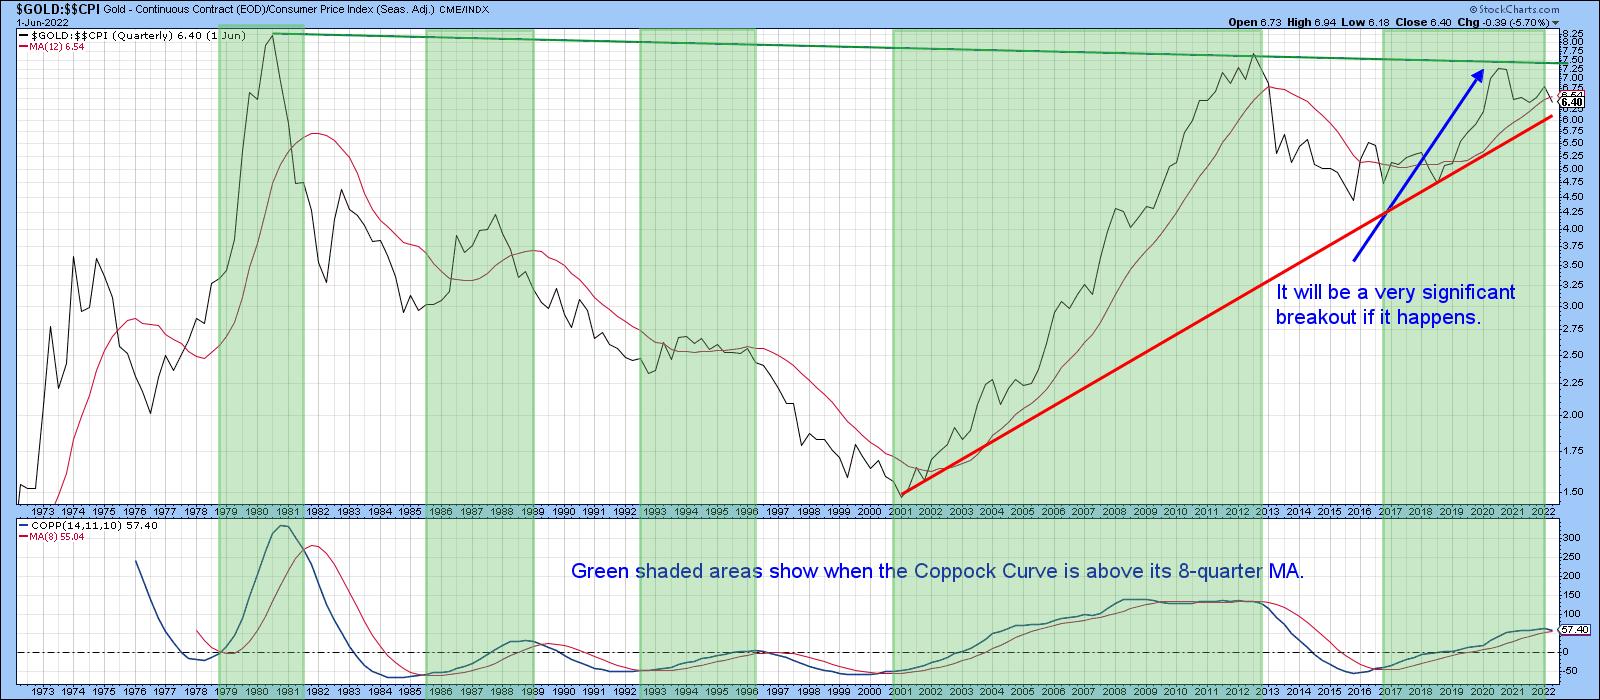
A couple of weeks ago, I wrote about the fact that the technical position of gold was extremely finely balanced, and that it was "Either in a Hard Place or a Sweet Spot". My conclusion was that its short-term position was improving and that the sweet spot...
READ MORE
MEMBERS ONLY

What Happens When Bonds Start to Outperform Stocks?
by Martin Pring,
President, Pring Research
It is possible for prices of individual asset classes to move in a linear up or down trend for an extended period. However, this rarely happens with inter-asset relationships, which rotate around the business cycle. As a result, it is helpful to monitor inter-asset relationships and their momentum...
READ MORE
MEMBERS ONLY

SHORT-TERM STOCK REBOUND NOT THAT IMPRESSIVE
by John Murphy,
Chief Technical Analyst, StockCharts.com
NOT MUCH OF REBOUND...This time last week it seemed clear that stocks had put in a short-term bottom marking the start of a potential bear market rally. So far at least, that rally hasn't gone very far. The three charts shown below show the same overhead...
READ MORE
MEMBERS ONLY
Gold: Either in a Hard Place or a Sweet Spot
by Martin Pring,
President, Pring Research
The long-term technical position of gold is extremely finely balanced and could easily tip into a full-fledged bear market, or start a new secular up leg to the bull trend that began in the opening years of this century.
Chart 1 really says it all. First, it expresses...
READ MORE
MEMBERS ONLY

Where Do We Go From Here? And Will This Rally Last?

by Larry Williams,
Veteran Investor and Author
Larry is back and ready to weigh in with his forecast of where stocks—and the economy—are headed in this new StockCharts TV special. He takes a look at some of the "Fallen Angels" of the market and discusses the ongoing situation with inflation. Afterwards, he focuses...
READ MORE
MEMBERS ONLY

THIS WEEK'S REBOUND SUGGESTS SHORT-TERM STOCK BOTTOM IN PLACE -- BUT HOW FAR CAN IT RALLY?
by John Murphy,
Chief Technical Analyst, StockCharts.com
WEEKLY S&P CHART SHOWS OVERSOLD CONDITION... Stocks are having their best week in two months which suggests that a short-term bottom may be in place. Before looking at daily charts, however, it's worth checking a weekly chart to keep things in perspective. The weekly bars...
READ MORE
MEMBERS ONLY

It's Time for a Rally, But that Comes with a Catch
by Martin Pring,
President, Pring Research
The stock market's recent sell-off has made the front pages and top headlines in TV broadcasts, and CNN's famous Fear and Greed Index has fallen to an extreme level of fear. My contrarian bones say it's time for a rally. Is that right?...
READ MORE
MEMBERS ONLY

STOCKS REMAIN UNDER PRESSURE -- BREADTH FIGURES CONFIRM BEARISH OUTLOOK
by John Murphy,
Chief Technical Analyst, StockCharts.com
S&P 500 REMAINS IN DOWNTREND...Stock prices continue to weaken with no sign of a bottom. The daily bars in Chart 1 show the S&P 500 having fallen to the lowest level in more than a year and nearing a 20% loss which signals a bear...
READ MORE
MEMBERS ONLY

Commodities on the Verge of an Upside Breakout, But Participation Will Likely Narrow
by Martin Pring,
President, Pring Research
Chart 1 shows that the Invesco DB Commodity Tracking Fund could be on the verge of breaking out from a 3-month consolidation pattern. It also points out that the number of commodities participating in the rally has been narrowing of late. That's because the indicator monitoring a...
READ MORE
MEMBERS ONLY

USING FIBONACCI RETRACEMENT LINES FOR POTENTIAL DOWNSIDE TARGETS
by John Murphy,
Chief Technical Analyst, StockCharts.com
INFLATION REMAINS THE BIGGEST THREAT TO MARKETS... It was reported this morning that April's Producer Price Index for the past year came in at 11%. That followed yesterday's report that the Consumer Price Index was 8.3%. Both reports confirm that inflation remains dangerously high with...
READ MORE
MEMBERS ONLY

Bitcoin Bubble Finally Bursts
by Martin Pring,
President, Pring Research
I have written two articles about Bitcoin in recent months. The first,last December, concluded that "there are definitely some cracks appearing (in the technical structure), but a shrinking consensus of evidence continues to point to an uptrend." Thesecond, entitled "Has the Bitcoin Bubble Burst", noted...
READ MORE
MEMBERS ONLY

STOCKS RESUME SELLING AFTER FED RELIEF RALLY -- BOND YIELDS NEAR TEST OF OVERHEAD RESISTANCE
by John Murphy,
Chief Technical Analyst, StockCharts.com
STOCK SELLING RESUMES... Stocks are being sold heavily today and are totally reversing yesterday's Fed relief rally. Stocks have given back all of Wednesday's price gains and look poised to fall further. Chart 1 shows the Dow Industrials falling sharply today after meeting resistance at their...
READ MORE
MEMBERS ONLY

It's Not What the Fed Does, But How the Market Reacts to its Decision, That Counts
by Martin Pring,
President, Pring Research
I'll get to the Fed element later, but, first, a few words on the Dow Jones Global Stock Index. Chart 1 shows that it has been experiencing a series of declining peaks and troughs since last November. That's not a bullish sign. Neither is the fact...
READ MORE
MEMBERS ONLY

NASDAQ BREAKS SUPPORT -- THE DOW AND S&P 500 MAY BE NEXT -- HALFWAY TO RECESSION?
by John Murphy,
Chief Technical Analyst, StockCharts.com
A BAD APRIL ENDS UNDER PRESSURE... Stocks fell sharply on Friday to end one of the weakest months in recent memory. The Nasdaq market lost -13.2% to register its worst month since 2008. The S&P 500 and Dow lost -8.8% and -4,9 % and experienced the...
READ MORE
MEMBERS ONLY

Yields May Be Peaking for a While
by Martin Pring,
President, Pring Research
A few weeks ago, I wrote a piece entitled "The Fed Raises Rates; What if it's Already Priced into the Market?". The idea was to point out that the Fed is a lagging indicator and that multiple bond yields had already reached mega resistance in the...
READ MORE
MEMBERS ONLY

HAWKISH FED PUSHES STOCKS SHARPLY LOWER -- MAJOR INDEXES SUFFER DOWNSIDE REVERSAL DAY -- 200 DAY AVERAGES PROVIDE RESISTANCE
by John Murphy,
Chief Technical Analyst, StockCharts.com
50-BASIS POINT HIKE ON THE TABLE FOR FED MAY MEETING... Today's statement by Fed Chairman Jerome Powell that a 50-basis point rate hike was on the table for May, combined with other hawkish comments, pushed stocks sharply lower today. And their technical condition continues to weaken....
READ MORE
MEMBERS ONLY

Does Recent Stock Market Action Indicate a Recession?
by Martin Pring,
President, Pring Research
I've been reading and hearing a lot about an impending recession, which reminds me of the saying that, when everyone thinks alike, everyone is usually wrong. That's not to say everyone is expecting a recession, but we may have reached a point where there is sufficient...
READ MORE
MEMBERS ONLY
Is it Time to Get Bearish?
by Larry Williams,
Veteran Investor and Author
Larry is back in this new StockCharts TV special! There's a lot of opinions out there about what the curve means and talking heads are flapping all over about inflation. In this video, Larry shows the actual history of what this means so you can make informed decisions....
READ MORE
MEMBERS ONLY

STOCKS END THE WEEK ON THE DOWNSIDE -- SECTOR ALIGNMENTS SEND WARNING SIGNALS
by John Murphy,
Chief Technical Analyst, StockCharts.com
STOCKS CONTINUE TO WEAKEN... The technical condition of major U.S. stock indexes continues to weaken. All three shown below lost more ground during the week. Chart 1 shows the Dow Industrials meeting overhead resistance near their red 200-day moving average. Chart 2 shows the S&P 500...
READ MORE
MEMBERS ONLY

Has the Bitcoin Bubble Burst?
by Martin Pring,
President, Pring Research
In early December of last year, I wrote an article on whether Bitcoin had reached the tipping point in terms of signaling a peak in the crypto bubble. Some may disagree about the "bubble" label; however, it seems to me that a financial category coming out of nowhere...
READ MORE
MEMBERS ONLY

SECTOR RANKINGS REMAIN DEFENSIVE...HEALTHCARE HITS NEW RECORD WHILE TECHNOLOGY WEAKENS....DOW AVERAGES SIGNAL MORE CAUTION
by John Murphy,
Chief Technical Analyst, StockCharts.com
WEEKLY SECTOR RANKING... A rebound on Friday leaves the major stock indexes either flat or with minor losses for the week. The weekly sector rankings in Chart 1, however, show a lot of movement beneath the surface. One factor that stands out is that defensive stock groups continue to show...
READ MORE
MEMBERS ONLY
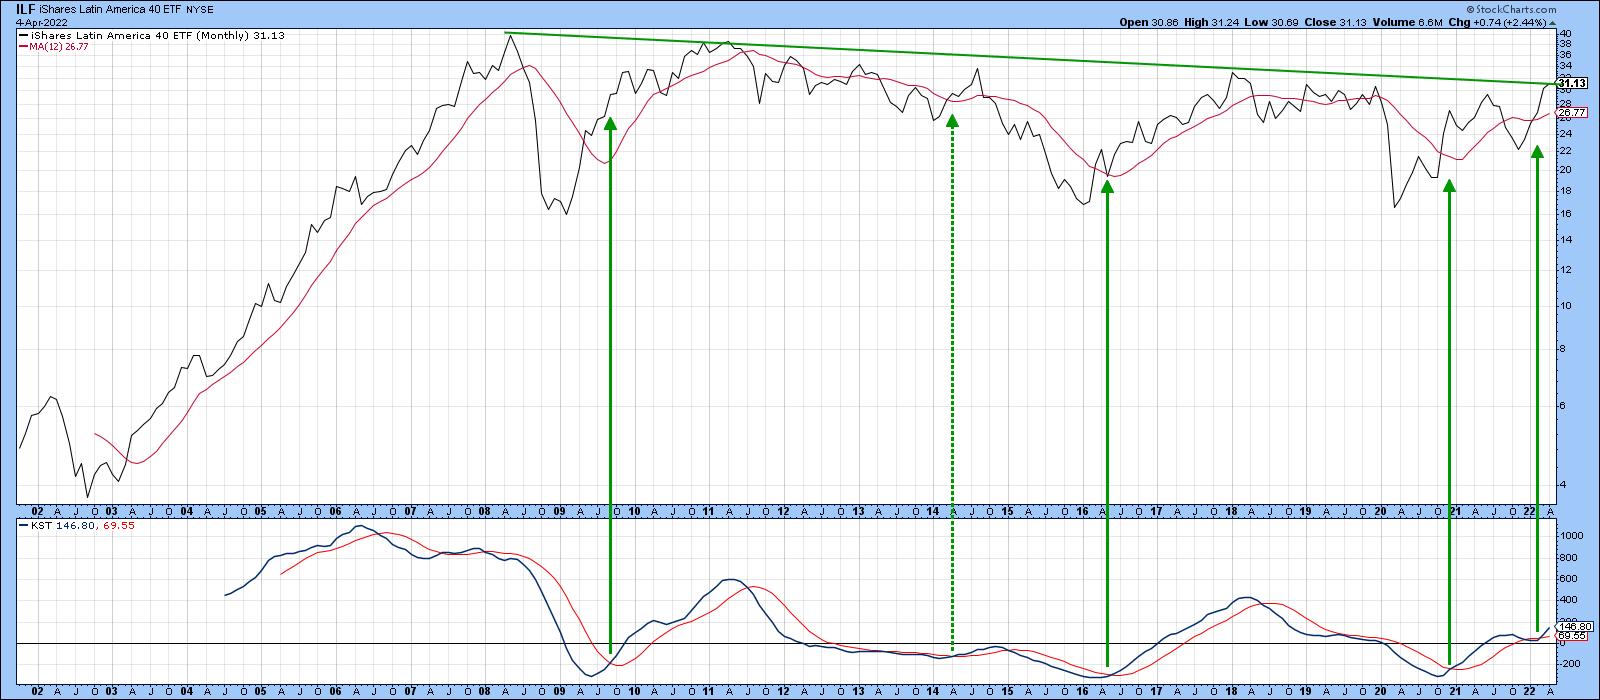
Watch this Market for a Huge Potential Upside Breakout
by Martin Pring,
President, Pring Research
At the turn of the century, this ETF achieved a ten-timer, rallying from $4 in 2002 to $40 in 2008. It's been consolidating for the last 12 years and looks set to embark on a move to new all-time highs. It's not a tech...
READ MORE
MEMBERS ONLY

DEFENSIVE SECTORS LEAD THIS WEEK -- FLATTER YIELD CURVE MAY BE HURTING BANKS -- YIELD CURVE NEARS INVERSION
by John Murphy,
Chief Technical Analyst, StockCharts.com
STOCKS HAVE WORST QUARTER IN TWO YEARS...The month of March has seen a rebound in stocks. Even with that rebound, however, the first quarter of this year has been the weakest in two years. Which raises the bigger question of whether or not the recent rebound is the start...
READ MORE
MEMBERS ONLY

The Fed Raises Rates; What If it's Already Priced into the Market?
by Martin Pring,
President, Pring Research
Markets discount the future, so if the Fed tells the market it's going to raise rates, it goes ahead and raises them anyway. Why wait on the railroad tracks when you know a train is coming? Ironically, the widely-telegraphed rate rise has arrived at a time when...
READ MORE
MEMBERS ONLY

S&P 500 CLEARS ITS 200-DAY MOVING AVERAGE -- COMMODITY STOCKS CONTINUE TO LEAD -- UTILITIES HIT A NEW RECORD
by John Murphy,
Chief Technical Analyst, StockCharts.com
STOCKS ADVANCE FOR A SECOND WEEK...Major U.S. stock indexes gained ground for the second week in a row building the case for a short-term bottom having been formed. And one of them has cleared an important resistance line. Chart 1 shows the S&P 500 moving...
READ MORE
MEMBERS ONLY

Three Intermarket Relationships that are Forecasting Higher Stocks and Yields
by Martin Pring,
President, Pring Research
Changing relationships between differing asset classes and markets do not speak that often. When they do, strong evidence that important changes may be afoot is often provided. One of the characteristics that has caught my attention since the beginning of the year is that, on one side, stocks been reacting...
READ MORE
MEMBERS ONLY

PULLBACK IN OIL CONTRIBUTES TO STOCK RALLY -- BUT HAWKISH FED MAY LIMIT UPSIDE POTENTIAL
by John Murphy,
Chief Technical Analyst, StockCharts.com
STOCKS HAVE VERY STRONG WEEK... Major U.S. stock indexes registered their strongest week since November 2020. And they also broke through some initial resistance levels. The week's strong action signals that stocks have put in a short-term bottom and may continue to gain some ground. Their...
READ MORE
MEMBERS ONLY

Don't Be Surprised if the NASDAQ Jumps from Here
by Martin Pring,
President, Pring Research
I've been bearish on the NASDAQ -- or, more specifically, on its relative action against the S&P Composite -- for about a year. Now that the financial press has announced that the Index, by virtue of passing the somehow magic -20% level, has "entered bear market territory&...
READ MORE
MEMBERS ONLY

SURGE IN COMMODITY PRICES IS TYPICAL LATE - CYCLE BEHAVIOR
by John Murphy,
Chief Technical Analyst, StockCharts.com
STOCKS USUALLY PEAK AFTER BONDS... One of the most important features of intermarket analysis is the rotation that normally takes place between bonds, stocks, and commodities at major turning points in the business cycle. That rotation between the three asset classes is especially relevant to the current global situation. Those...
READ MORE
MEMBERS ONLY

A Tale of Two Sectors
by Martin Pring,
President, Pring Research
The Business Cycle and Sector Rotation
The business cycle undergoes a set series of chronological events which are also related to primary trend peaks in bonds stocks and commodities, as laid out in Figure 1. You can read about this concept in greater detail here. Based on the position of...
READ MORE
MEMBERS ONLY

GLOBAL STOCKS REMAIN UNDER PRESSURE AS CRUDE OIL TESTS OVERHEAD RESISTANCE -- GRAIN PRICES ARE ALSO SURGING
by John Murphy,
Chief Technical Analyst, StockCharts.com
WEST TEXAS CRUDE OIL REACHES 11-YEAR HIGH... The war in Ukraine continues to push oil prices sharply higher along with other commodities. That includes metals and agricultural products. Gold continues to gain ground as a traditional haven during times of rising inflation and increased global tensions. Some defensive money...
READ MORE
MEMBERS ONLY
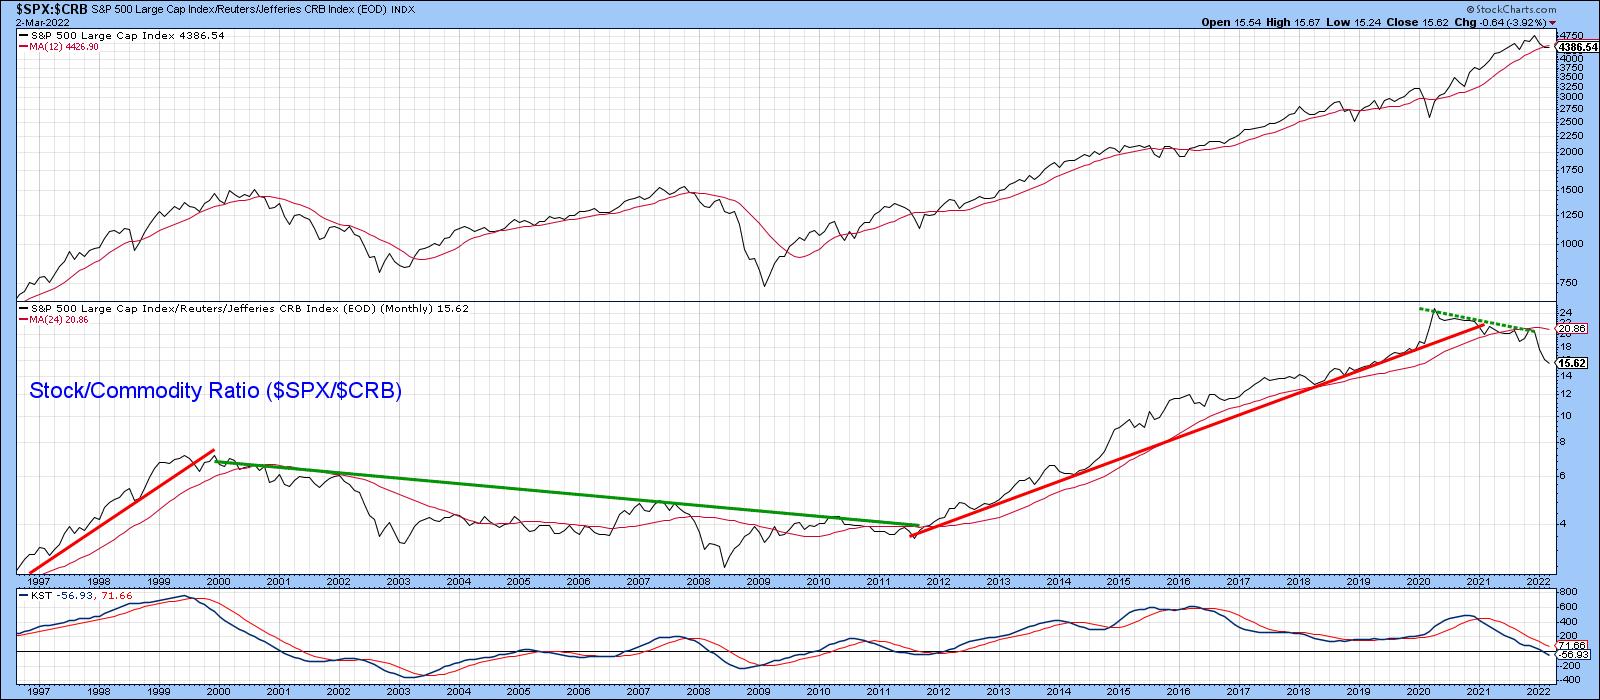
Three Implications if Commodities Outperform Stocks
by Martin Pring,
President, Pring Research
Chart 1 shows that, starting in early 2020, stocks began to slowly but quietly underperform commodities. Since the start of this year, though, this trend has begun to really accelerate on the downside, i.e. moving in favor of commodities. The center window also shows when a lengthy trendline of...
READ MORE
MEMBERS ONLY

STOCKS REGAIN EARLIER LOSSES FOLLOWING OUTBREAK OF WAR IN EUROPE -- LONGER-RANGE TREND NOT ENCOURAGING
by John Murphy,
Chief Technical Analyst, StockCharts.com
SELLING THE RUMOR AND BUYING THE FACT... Thursday morning's heavy selling of stocks and the buying of traditional safe havens like bonds, gold, and oil reversed sharply that same afternoon. Stocks rose while safe havens lost most of their morning's gains. That more positive trend continued...
READ MORE
MEMBERS ONLY

STOCK INDEXES BREAK JANUARY LOWS -- GOLD AND OIL SPIKE HIGHER WHILE BONDS REBOUND -- WE MAY BE HEADING INTO STAGFLATION
by John Murphy,
Chief Technical Analyst, StockCharts.com
STOCK INDEXES REACH NEW LOWS ON RUSSIAN INVASION... News of a full-scale Russian invasion of Ukraine is pushing global stocks sharply lower and pushing money into traditional safe havens like gold, oil, and bonds. The price of West Texas crude oil spiked to $100 this morning while gold prices...
READ MORE
MEMBERS ONLY

Major Top or Double Bottom?
by Martin Pring,
President, Pring Research
In a recent late January article,I pointed out that many market averages had fallen to key support levels at a time when a lot of them were experiencing selling climaxes. This kind of condition is usually followed by a rally or basing period, but I also noted that other...
READ MORE
MEMBERS ONLY

RISING UKRAINE TENSIONS ARE PUSHING GOLD TO THE HIGHEST LEVEL IN EIGHT MONTHS -- GOLD MINERS ARE ALSO RALLYING
by John Murphy,
Chief Technical Analyst, StockCharts.com
RISING TENSIONS BOOST GOLD... With increased warnings that a Russian invasion of Ukraine is likely, investors are selling stocks around the world. And they're buying gold which is usually viewed as a traditional safe haven in times of heightened global tensions. Chart 1 shows the Gold Shares SPDR...
READ MORE
MEMBERS ONLY

Gold Breaks Out for the Fourth Time in the Past Year -- But is it for Real this Time?
by Martin Pring,
President, Pring Research
Since its August 2020 high, gold has been a very tricky market to call. Let me put it another way; it has been easy to call, but exasperatingly difficult to call correctly because of the numerous false breakouts that have taken place in the last 18 months-or-so. Monday&...
READ MORE
MEMBERS ONLY
Will There Be a Bear Market?
by Larry Williams,
Veteran Investor and Author
In this new StockCharts TV special, Larry Williams shares what he thinks is coming up. He walks us through the historical data, shares the points he believes are the most important to take into consideration and goes on record with his answer to the question everyone is asking - are we...
READ MORE
MEMBERS ONLY

INFLATION FEARS PUSH BOND YIELDS HIGHER AND STOCKS LOWER --THE DOW AND S&P 500 TRADE BELOW 200-DAY LINES -- THE NASDAQ 100 MEETS RESISTANCE AT ITS RED LINE
by John Murphy,
Chief Technical Analyst, StockCharts.com
STOCKS FAIL TEST OF MOVING AVERAGE LINES... Thursday's CPI report showed January inflation rising 7.5% on an annual basis which was the highest number in four decades (since 1982). That higher inflation number raised prospects for a more aggressive Fed starting next month, and pushed stocks sharply...
READ MORE