MEMBERS ONLY

STOCKS STRUGGLE WITH RATE HIKES AND OMICRON --STOCK INDEXES TEST 50-DAY AVERAGES --DEFENSIVE STOCK SECTORS HIT NEW RECORDS

by John Murphy,
Chief Technical Analyst, StockCharts.com
STOCK INDEXES WEAKEN... Stock prices are ending a volatile week on the downside. So far, no serious chart damage has been done as the three major stock indexes shown below are testing potential support at their 50-day moving averages. Stocks are struggling with the spread of the omicron virus (and...
READ MORE
MEMBERS ONLY
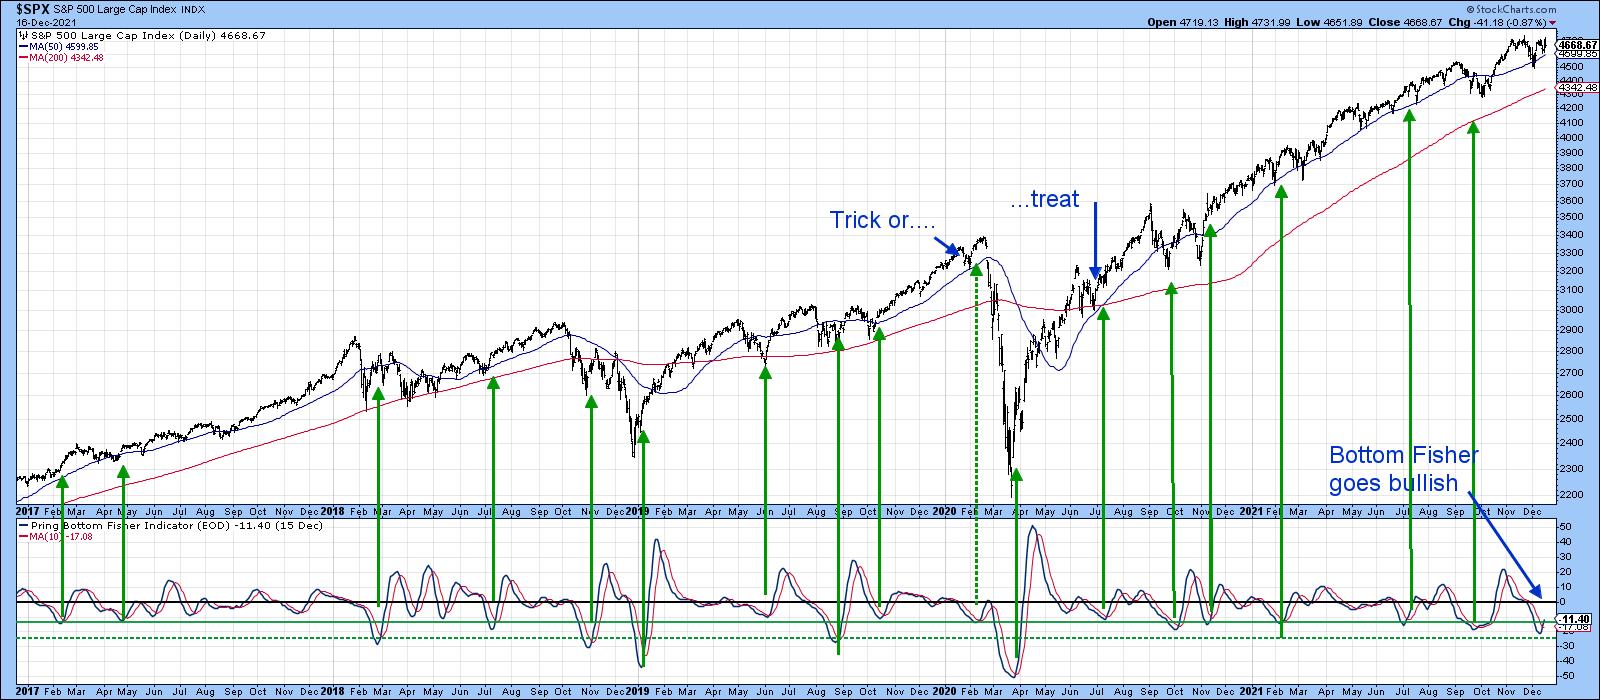
Three Charts That Suggests This Rally Has Legs.... For the Time Being

by Martin Pring,
President, Pring Research
A lot of indicators, such as the percentage of NYSE stocks above their 200-day MA and the NYSE bullish percentage, remain in confirmed downtrends that will take time to reverse. However, some of the shorter-term charts that have proved reliable in the past have just begun to offer some bullish...
READ MORE
MEMBERS ONLY

Is Dr. Copper About to Make a Diagnosis?
by Martin Pring,
President, Pring Research
The copper price is reputed to have a "Ph.D. in economics" because of its ability to predict turning points in the global economy. That role is justified due to copper's widespread use in most sectors of the economy, from homes and factories to electronics, power...
READ MORE
MEMBERS ONLY

STOCKS REBOUND ON CPI REPORT -- SMALL CAPS LAG BEHIND -- DIP IN BOND YIELDS SHOULD BE SHORT-LIVED
by John Murphy,
Chief Technical Analyst, StockCharts.com
LARGE CAPS ARE ENDING THE WEEK HIGHER DESPITE RISING CPI... This morning CPI report showed annual inflation rising 6.8% to the highest level in nearly forty years. Despite that high reading, major stock indexes are gaining ground on the day and week. Chart 1 shows the Dow Industrials climbing...
READ MORE
MEMBERS ONLY
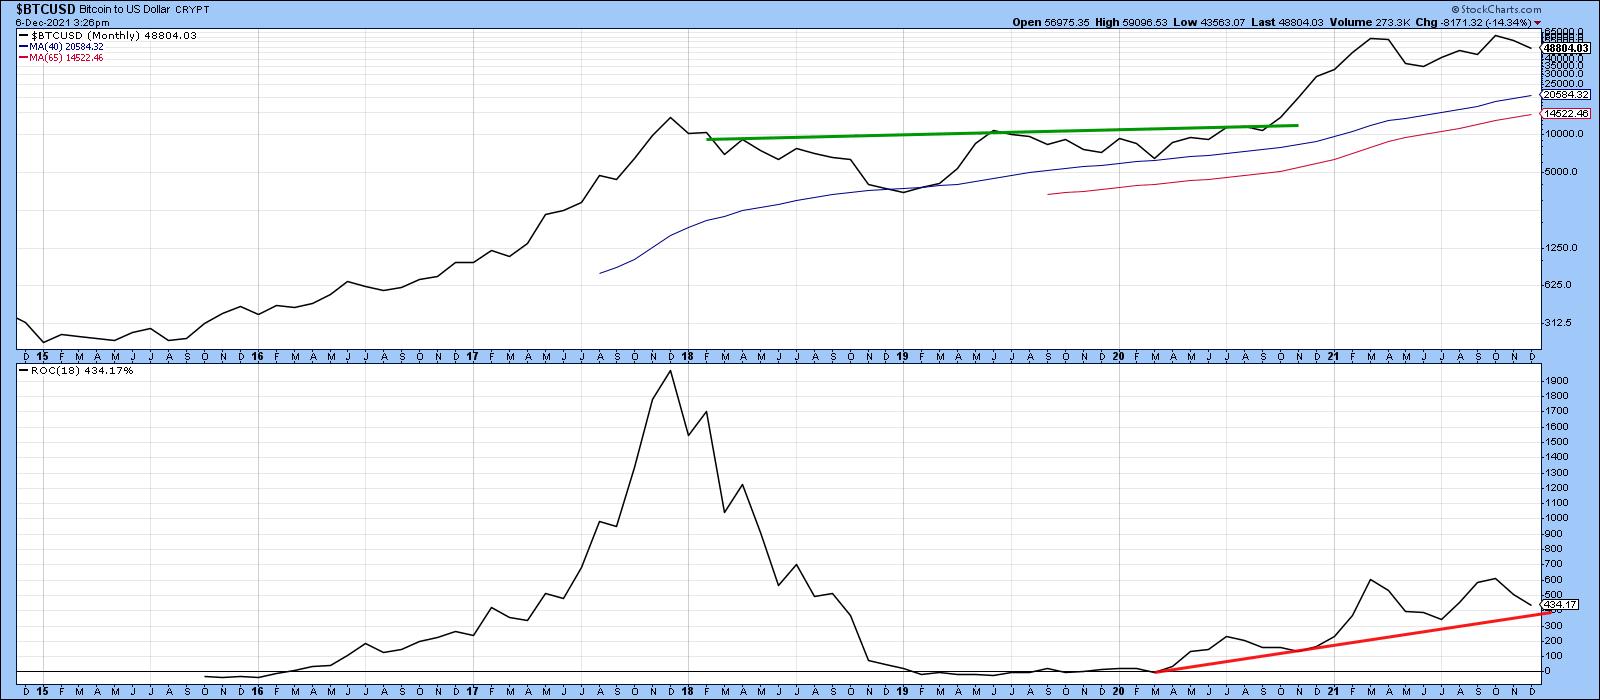
Does Last Week's Bitcoin Sell-Off Signal a Bear Market?
by Martin Pring,
President, Pring Research
According to CoinGecko, total crypto market capitalization, which came from almost nothing 10 years ago, stood at $3 trillion in early November. To put that in perspective, total US GDP currently stands at $23 trillion, so, at its recent high, global crypto was worth 13% of US GDP and more...
READ MORE
MEMBERS ONLY

Will We Get a Christmas Rally?

by Larry Williams,
Veteran Investor and Author
Will stocks rally this Christmas? Larry answers the question and explores when the ideal short-term trading opportunity will be in this new StockCharts TV special. Larry also presents his forecast for Bitcoin and gold, sharing what he thinks is in store for gold over the next several months.
This video...
READ MORE
MEMBERS ONLY

STOCKS INDEXES REMAIN UNDER PRESSURE -- MOVING AVERAGE LINES ARE BEING THREATENED -- INVESTORS BUY BONDS AND GOLD
by John Murphy,
Chief Technical Analyst, StockCharts.com
MOVING AVERAGE LINES ARE BEING THREATENED... A combination of factors are pushing stocks lower again today to extend weekly losses. A weak jobs report this morning, fears of accelerated Fed tightening to fight inflation, and worries about the Omicron coronavirus are keeping stocks on the defensive. Ånd moving lines are...
READ MORE
MEMBERS ONLY

Bullish Two-Bar Reversal Patterns Suggest a Temporary Bottom for Some Sectors -- and Maybe the Market Itself
by Martin Pring,
President, Pring Research
Thursday's action was quite positive for several sectors, as they experienced positive two-day price formations. These patterns are only of a short-term nature and usually have an effect for between 5- and 10-days, so they do not represent major signals. However, since this action is coming off an...
READ MORE
MEMBERS ONLY

STOCKS PLUNGE ON NEW COVID VARIANT -- ALL ELEVEN SECTORS LOSE GROUND -- TREASURY YIELDS ALSO PLUNGE IN FLIGHT TO SAFETY
by John Murphy,
Chief Technical Analyst, StockCharts.com
STOCK INDEXES PLUNGE... Reports of a new covid variant in South Africa pushed stocks sharply lower the day after Thanksgiving. As a result, all three major U.S. stock indexes suffered short-term technical damage. Chart 1 shows the Dow Industrials falling -904 points (-2.5%) and ending the day well...
READ MORE
MEMBERS ONLY

Key Index Experiences a Bearish Outside Day: Could There Be More Downside to Come?
by Martin Pring,
President, Pring Research
One piece of Monday's market action that really stood out to me was a bearish outside day in the NASDAQ, as shown in Chart 1. A classic outside day develops after a persistent short-term rally and signals a short-term reversal in sentiment. The outside part refers to the...
READ MORE
MEMBERS ONLY

BREADTH FIGURES WEAKEN -- MARKET MAY BE DUE FOR A PULLBACK
by John Murphy,
Chief Technical Analyst, StockCharts.com
S&P 500 SHOWS SOME NEGATIVE DIVERGENCE... Stocks are ending the week in a mixed fashion. The Dow Jones Industrials are weakening, while the Nasdaq 100 is hitting a new record. That being the case, this message will focus on the S&P 500 which is in the...
READ MORE
MEMBERS ONLY

After Seven Months of Consolidation Food Prices are Starting to Resume their Advance
by Martin Pring,
President, Pring Research
The Invesco DB Agricultural Fund (DBA) consists of grains (37%), softs (sugar, coffee and cocoa; 35%) and livestock (24%). A small allocation is also given to cotton. Chart 1 shows that this ETF began a bull market back in the spring of last year. Late 2020 also saw it break...
READ MORE
MEMBERS ONLY

STOCK INDEXES MAINTAIN UPTRENDS -- MATERIALS ARE WEEK'S STRONGEST SECTOR -- BOND YIELDS RISE ON INFLATION REPORT -- SO DOES GOLD
by John Murphy,
Chief Technical Analyst, StockCharts.com
STOCK INDEXES MAINTAIN UPTRENDS... Stocks are ending the week trying to make up some losses from Wednesday's sharp selloff after the CPI annual inflation report of 6.2% was the highest level in thirty years. Chart 1 shows the Dow Industrial staying above its 20-day moving average. Charts...
READ MORE
MEMBERS ONLY

Watch the Metal; It May Soon be Time to Pedal
by Martin Pring,
President, Pring Research
The gold price zig-zagged its way down between August of last year and April of this one. Since then, it's really been in a trading range and now looks poised to break out. Whether it will or not is another question that only the market can decide.
I&...
READ MORE
MEMBERS ONLY

AIRLINES LEAD INDUSTRIAL SPDR TO A NEW RECORD -- DELTA AND UAL LEAD AIRLINES
by John Murphy,
Chief Technical Analyst, StockCharts.com
INDUSTRIAL SPDR HITS NEW RECORD... A strong jobs report has boosted major stock indexes into record territory with most sectors also rising. Industrials are one of the day's strongest sectors. Chart 1 shows the Industrial Sector SPDR (XLI) moving into record territory today. It's being led...
READ MORE
MEMBERS ONLY

The S&P is at New Highs: Now What, Especially for Small Caps?
by Martin Pring,
President, Pring Research
The major averages have recently been scoring new highs for the year, strongly hinting that the post-May correction has run its course. So where do we go from here? Is the market overbought and likely to digest recent gains, or is a rally into the bullish year-end period a better...
READ MORE
MEMBERS ONLY

A LONGER TERM LOOK AT OIL -- ENERGY STOCKS TESTING MAJOR TRENDLINE
by John Murphy,
Chief Technical Analyst, StockCharts.com
A LONGER TERM LOOK AT OIL... Energy inflation is grabbing a lot of headlines these days and for good reason. Energy prices are hitting the highest level in years. That includes natural gas and crude oil. Today's message will focus on the next potential upside target for oil....
READ MORE
MEMBERS ONLY

Identifying Intermediate Buying Opportunities with the Hourly Special
by Martin Pring,
President, Pring Research
Sometimes, when I mess around with the charts, I discover an entirely new approach that I had not thought of before. Last week saw one of those breakthrough moments when, for the first time ever, I applied the Special K to hourly charts and came up with some interesting results....
READ MORE
MEMBERS ONLY

RAILS AND TRUCKERS LEAD THE TRANSPORTS HIGHER
by John Murphy,
Chief Technical Analyst, StockCharts.com
DOW TRANSPORTS CONTINUE TO RALLY... While the Dow Industrials continue to test their old highs, transportation stocks continue to act much stronger. Chart 1 shows the Dow Transports rising today to the highest level in nearly five months. That shouldn't be too surprising with companies dealing with supply...
READ MORE
MEMBERS ONLY

Which Asset Class is Likely to Outperform Going Forwards?
by Martin Pring,
President, Pring Research
The business cycle undergoes a set series of chronological sequences, just like the calendar year goes through seasons. Over the course of many decades, economists have recognized this phenomenon and devised composite indicators to follow this progression. By way of an example, the Conference Board publishes leading, coincident and lagging...
READ MORE
MEMBERS ONLY

Impending Super Cycle Commodity Signal Argues Against Transitory Inflation
by Martin Pring,
President, Pring Research
Aging demographics, technological innovation and an ever-expanding debt overhang are three reasons why inflation has been largely kept under wraps in the last three decades. They are still relevant, so why not extrapolate a benign inflation trend into the future?
One reason might lie in the Fed's extraordinary...
READ MORE
MEMBERS ONLY

There is a Pretty Good Chance the Correction is Over
by Martin Pring,
President, Pring Research
The S&P peaked in early September, but most other major averages and many internal indicators of breadth have been rangebound since March. Price action this week, though, suggests that there is a good chance this corrective process has run its course and we will see significant new highs...
READ MORE
MEMBERS ONLY

STOCK INDEXES END WEEK ON A STRONG NOTE -- CONSUMER DISCRETIONARY AND FINANCIALS ARE HITTING NEW RECORDS
by John Murphy,
Chief Technical Analyst, StockCharts.com
STOCK INDEXES CLEAR 50-DAY LINES... Stocks are rising again today following yesterday's strong rally. And their technical condition is looking stronger. Chart 1 shows the Dow Industrials rising to the highest level in a month and moving back above its blue 50-day average. Chart 2 shows the S&...
READ MORE
MEMBERS ONLY
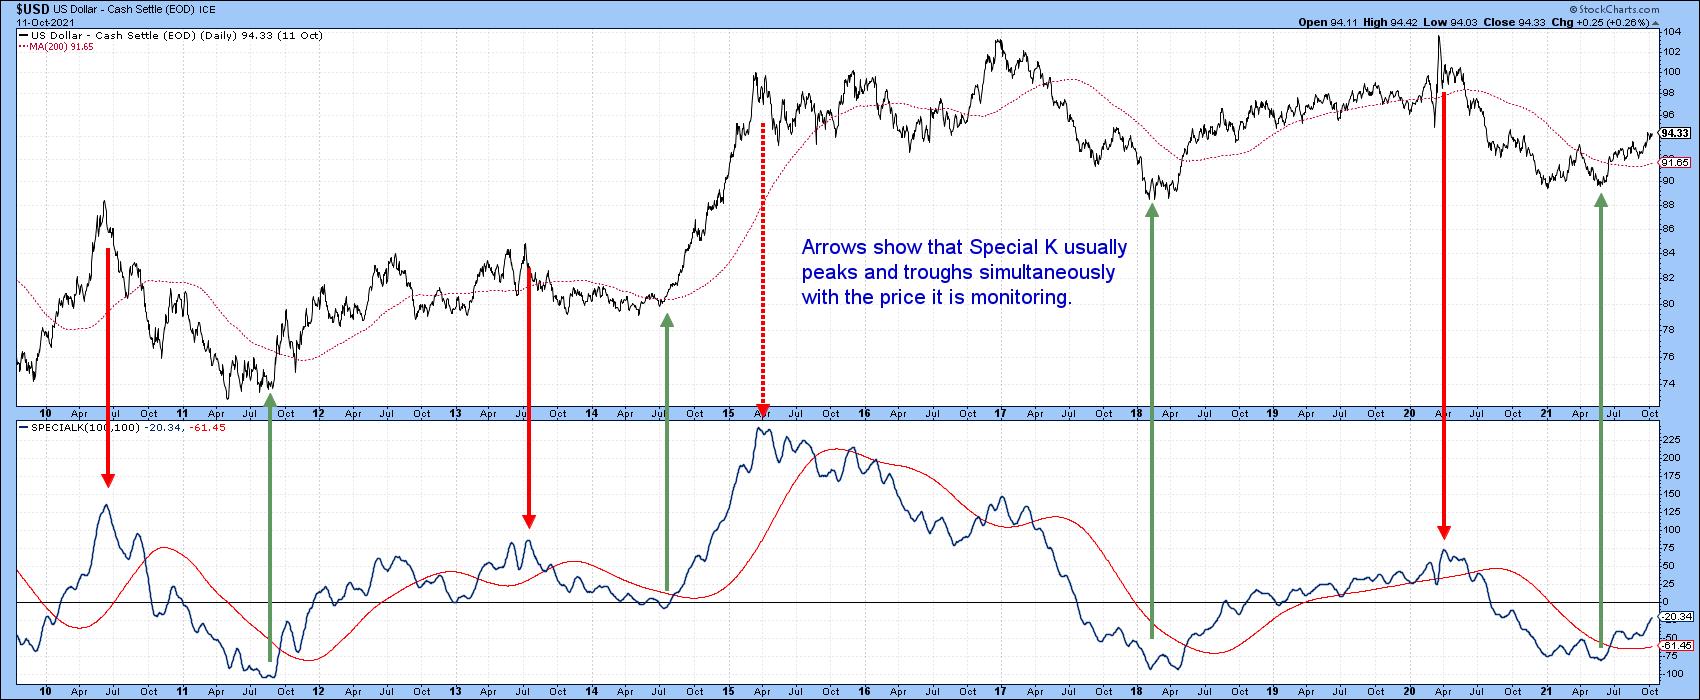
Using the Special K to Analyze the Dollar
by Martin Pring,
President, Pring Research
One of my favorite indicators is the Special K. It does not speak to us very often, but when it does, it's usually pretty reliable. I'll outline a few principles below, but for further reading, look hereandhere.
The Special K, or SPK, recognizes the fact that...
READ MORE
MEMBERS ONLY
Trick or Treat Comes to Wall Street
by Larry Williams,
Veteran Investor and Author
It's time for Halloween and Larry has some really nice treats for you in this new StockCharts TV special! One treat is in Gold and one is in the stock market itself, so grab your pens and get ready!
This video was originally broadcast on October 12, 2021....
READ MORE
MEMBERS ONLY

ENERGY AND FINANCIALS CONTINUE TO LEAD -- S&P 500 REGAINS ITS 100-DAY AVERAGE
by John Murphy,
Chief Technical Analyst, StockCharts.com
ENERGY ETFS ACHIEVE BULLISH BREAKOUTS... Rising energy prices continue to fuel a rally in energy shares which are the day's strongest sector. Crude oil and natural gas are trading at the highest level in several years and show no signs of slowing down. That's contributing to...
READ MORE
MEMBERS ONLY

STOCK INDEXES FALL BELOW 100-DAY AVERAGES -- FOUR SECTORS ARE TESTING THEIR 200-DAY LINES
by John Murphy,
Chief Technical Analyst, StockCharts.com
WATCHING 100-DAY AVERAGES...Stocks remain in a short- to intermediate term downturn that started during September. And moving average lines are being broken. It started with stock indexes falling below their 50-day moving averages. And then falling below their 100-day lines. Chart 1 shows the Dow Industrials trading below its...
READ MORE
MEMBERS ONLY

This Sector is Likely to Outperform the NASDAQ in a Major Way
by Martin Pring,
President, Pring Research
Back in AprilandMay, I wrote about the possibility that the tech-dominated NASDAQ had begun to lose its mojo. The argument was based more on relative action than the absolute price, as I was, and still am, bullish on the primary trend.
Recent NASDAQ Underperformance is Likely to Extend
Chart 1...
READ MORE
MEMBERS ONLY

RISE IN 10-YEAR TREASURY YIELD HURTS STOCKS -- TECH IS TAKING THE BIGGEST HIT -- ENERGY IS TOP SECTOR -- BANKS SHOULD BENEFIT FROM HIGHER YIELDS
by John Murphy,
Chief Technical Analyst, StockCharts.com
10-YEAR TREASURY YIELD HITS 3-MONTH HIGH...The steep rise in Treasury yields that started last week continued again today. Chart 1 shows the 10-Year Treasury yield climbing 5 basis points today to 1.53%. That puts the TNX at the highest level in three months. Yields are being pushed higher...
READ MORE
MEMBERS ONLY

Step Aside Chairman Powell, Mr. Market is Tightening for You
by Martin Pring,
President, Pring Research
Last week, the Fed announced that tapering is likely to begin later in the year, to be later followed by a leisurely hike in rates. As usual, those pesky impatient markets have decided to raise rates now rather than wait for the clobbering they know they will get later. It...
READ MORE
MEMBERS ONLY

STOCK INDEXES REGAIN 50-DAY LINES -- ENERGY AND FINANCIALS ARE STRONGEST SECTORS -- INDUSTRIALS AND MATERIALS BOUNCE OFF 200-DAY AVERAGES
by John Murphy,
Chief Technical Analyst, StockCharts.com
STOCKS MAKE UP LOST GROUND...Two strong days in a row have more than made back losses suffered on Monday. In addition, some of the short-term technical damage has been repaired. More specifically, 50-day moving averages that were broken on Monday have been regained on the S&P 500...
READ MORE
MEMBERS ONLY
What You Need to Know to Trade Cryptos
by Larry Williams,
Veteran Investor and Author
Larry is back again! The topic du jour is "Trading Bitcoins & Cryptocurrencies." They have become really big markets with a huge following. Larry will share his insights on how to trade them, the problems with them and the opportunities. If you're a Bitcoin trader, you&...
READ MORE
MEMBERS ONLY

Commodities Experience a False Upside Breakout -- Or Did They?
by Martin Pring,
President, Pring Research
Earlier in the month, I pointed out that the long-term indicators for commodities were still bullish, but getting overbought. At the same time, several intermarket relationships were signaling danger, which suggested some degree of vulnerability. Prices have not moved very much since then, but, bearing in mind that overstretched technical...
READ MORE
MEMBERS ONLY

STOCKS SUFFER BIGGEST DROP SINCE THE SPRING -- 50-DAY MOVING AVERAGES HAVE BEEN BROKEN -- BREADTH MEASURE WEAKEN FURTHER
by John Murphy,
Chief Technical Analyst, StockCharts.com
SEPTEMBER SELLING DEEPENS ON CHINA CONCERNS... Monday's heavy selling of stocks was the biggest drop since the spring. The selling started in China on concerns over its property market and spread to Europe and the U.S. Going into Monday, stocks were already pulling back on fears that...
READ MORE
MEMBERS ONLY

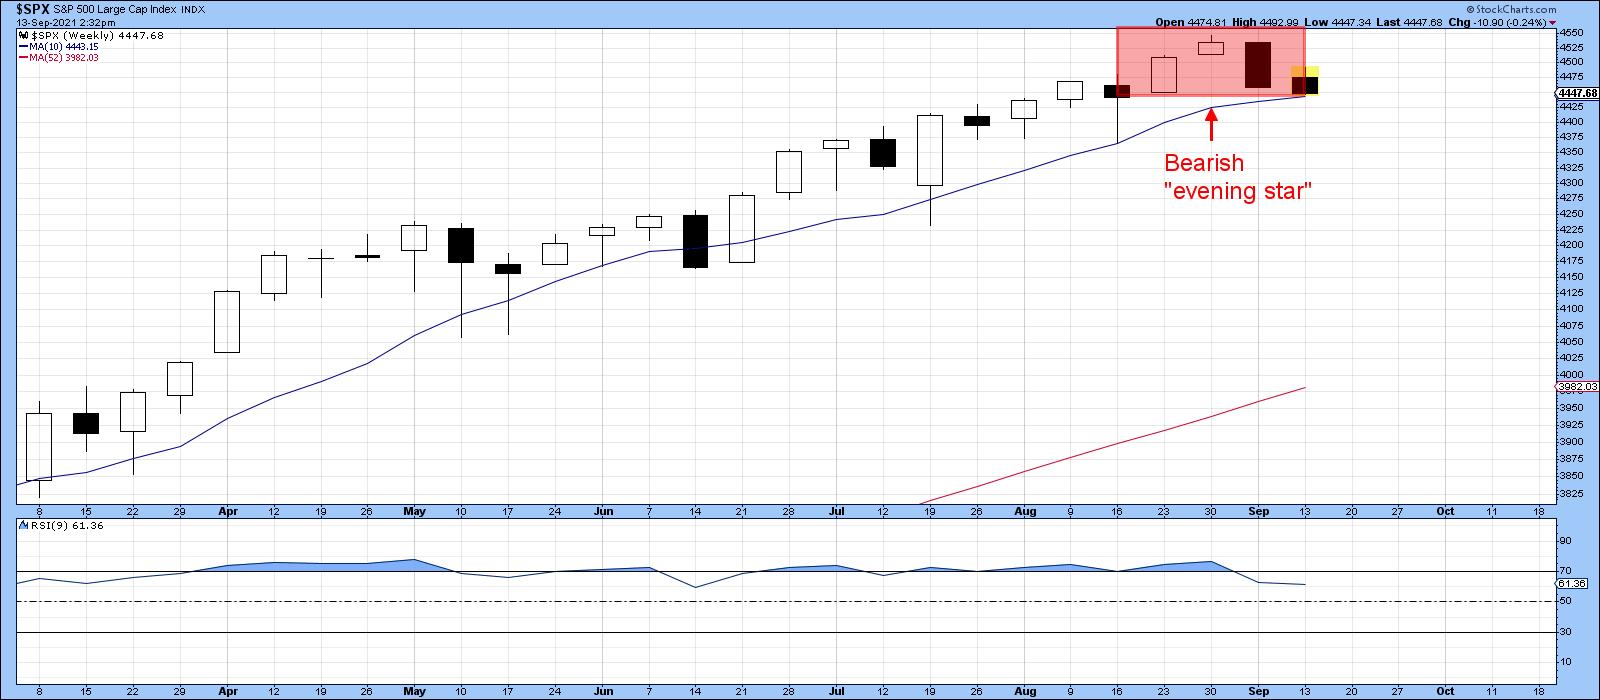
S&P 500 IS TESTING 50-DAY AVERAGE -- OTHER MEASURES OF MARKET BREADTH LOOK WEAKER
by John Murphy,
Chief Technical Analyst, StockCharts.com
S&P 500 TESTS 50-DAY MOVING AVERAGE... Chart 1 shows the S&P 500 trying to find support at its 50-day moving average (blue arrow). Stocks have entered a seasonally weak period extending from September into October. And despite the general consensus that stocks are due for a...
READ MORE
MEMBERS ONLY
Several Indicators are Shaping Up for a Counter-Cyclical Correction
by Martin Pring,
President, Pring Research
Most of the time, the charts I plot are constructed from daily data. As a result, the necessary perspective provided by weekly ones often gets overlooked. By way of a remedy, I decided, some time ago, to create chartlists for key markets featuring weekly high low close and candlestick arrangements....
READ MORE
MEMBERS ONLY

Nine Country ETFs That are Starting to Emerge
by Martin Pring,
President, Pring Research
Chart 1 shows that the US stock market is in a long-term uptrend relative to the rest of the world. The upper window compares the S&P to the Vanguard All-World ex-US ETF and indicates a recent breakout from a consolidation reverse head-and-shoulders. The lower panel substitutes the S&...
READ MORE
MEMBERS ONLY

Several Intermarket Relationships are Signaling Danger for Commodities
by Martin Pring,
President, Pring Research
When considered in their own right, commodities, as represented by the CRB Composite, are in a primary bull market. Chart 1, for instance, shows that the Index is above its 12- and 24-month moving averages and the long-term KST is also in a bullish trend. That said, this momentum indicator...
READ MORE
MEMBERS ONLY
Great Buy Point Coming for Stocks?
by Larry Williams,
Veteran Investor and Author
October has historically been a seasonal sweet spot for stocks to stage substantial rallies. But will that be the case this year? In this special presentation, Larry looks to answer this question with facts and figures.
This video was originally broadcast on August 26, 2021. Click anywhere on the Larry...
READ MORE
MEMBERS ONLY
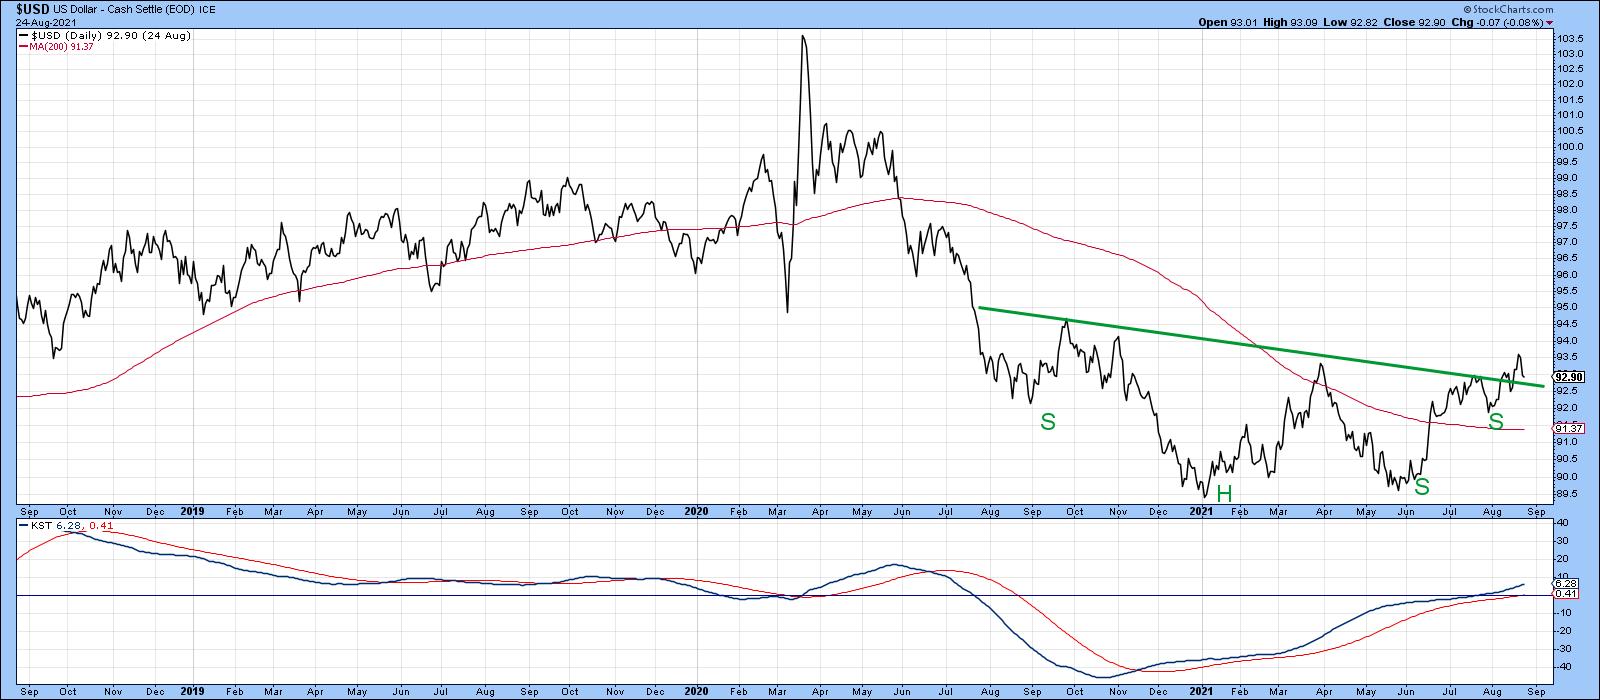
Dollar Index Breakout Trick or Treat?
by Martin Pring,
President, Pring Research
Back in June, I wroteabout the possibility that a major reversal in the dollar could be underway, but that certain things had to happen before we could come to a firm conclusion. One of those conditions was a Dollar Index daily close above 93.5, as that would complete what...
READ MORE