MEMBERS ONLY
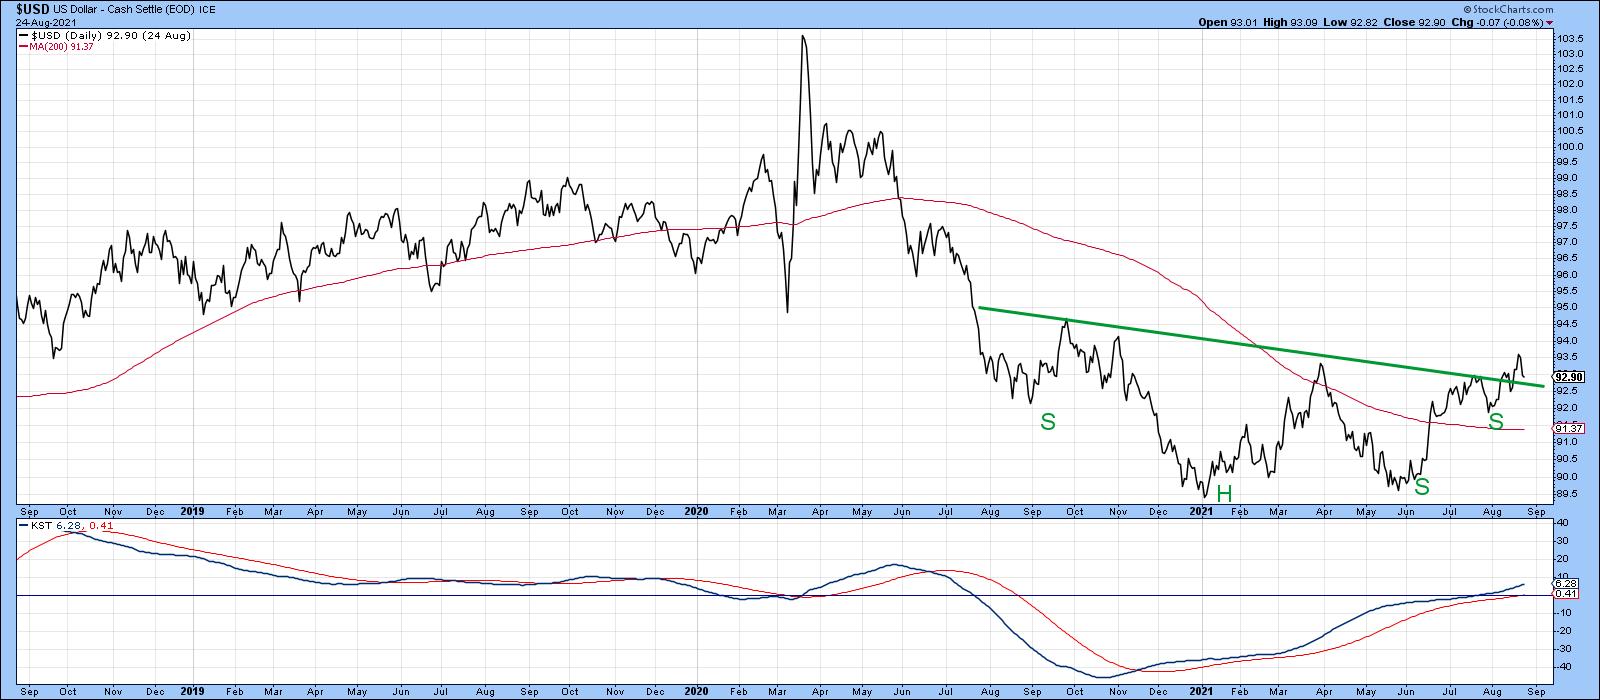
Dollar Index Breakout Trick or Treat?

by Martin Pring,
President, Pring Research
Back in June, I wroteabout the possibility that a major reversal in the dollar could be underway, but that certain things had to happen before we could come to a firm conclusion. One of those conditions was a Dollar Index daily close above 93.5, as that would complete what...
READ MORE
MEMBERS ONLY

Michigan Consumer Sentiment Drops 13.5% in July; What Does that Mean for US Equities?
by Martin Pring,
President, Pring Research
Last Friday, the University of Michigan released the initial August response to their consumer sentiment survey. A sharp 13.5% retreat was recorded. The Expectations Index fared even worse with a 17.5% drop. According to the summary report, only six of these monthly surveys since the late 1970s have...
READ MORE
MEMBERS ONLY

Which of These Three Leading Commodity Indicators are Forecasting Higher Prices?
by Martin Pring,
President, Pring Research
We hear a lot about inflation these days and have certainly experienced rising grocery bills, as well as runaway used car and housing prices. Commodity prices are often, but certainly not always, a leading indicator for the CPI, but there are three markets that have a useful, though imperfect, record...
READ MORE
MEMBERS ONLY

BOND YIELDS BOUNCE ON STRONG JOBS REPORT -- FINANCIALS ARE HAVING A VERY STRONG DAY -- SO ARE BANKS

by John Murphy,
Chief Technical Analyst, StockCharts.com
10-YEAR TREASURY YIELD REBOUNDS... A strong July jobs report is helping boost bond yields today. Chart 1 shows the 10-Year Treasury yield bouncing 7 basis points to 1.29% on the day. A small double bottom on the daily bars suggests that a bottom may be forming. The TNX is...
READ MORE
MEMBERS ONLY

The Indicators are Mixed. What Does this Contradiction Mean for the Market?
by Martin Pring,
President, Pring Research
This morning, an interesting chart of the S&P Composite authored by Ed Clissold of NDR Research crossed my desk. It can be seen at @NDR_Research. It is a composite of 3 historic cycles: 1-year, 4-year (post-election) and 10-year decennial cycle with an average of years ending in...
READ MORE
MEMBERS ONLY

S&P 500 TOUCHES NEW RECORD -- SMALL AND MIDSIZE STOCKS ARE LOOKING STRONGER
by John Murphy,
Chief Technical Analyst, StockCharts.com
S&P 500 TOUCHES NEW RECORD... Stocks continue to rise with major stock indexes at or near record highs. Chart 1 shows the S&P 500 touching new record territory. Smaller stocks have been lagging behind the large cap rally. But are starting to look stronger. That includes...
READ MORE
MEMBERS ONLY
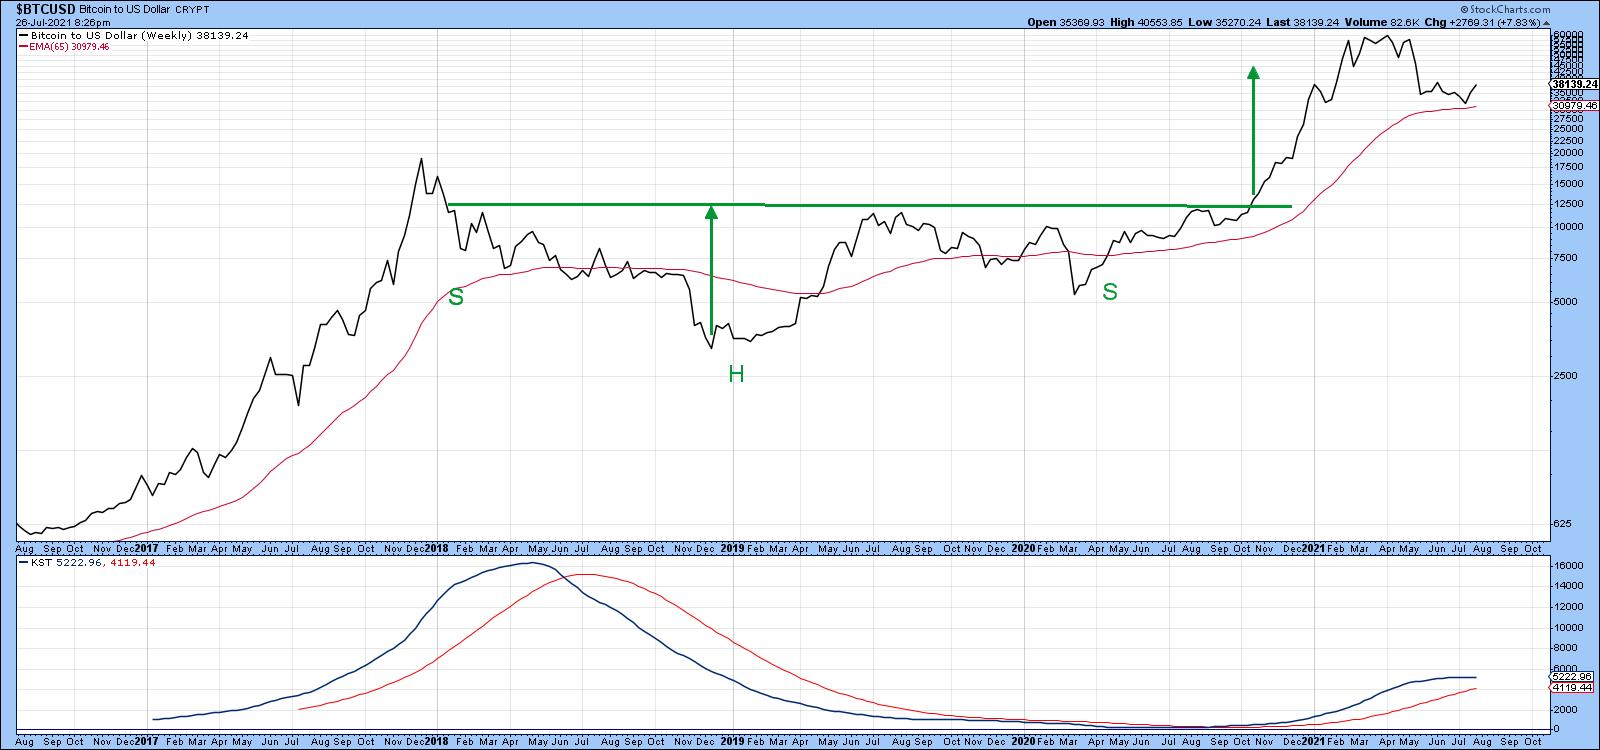
Bitcoin and Chinese Equities Go their Separate Ways
by Martin Pring,
President, Pring Research
After months of quiet frustrating trading, Bitcoin finally broke out to the upside this week. It's too early to say whether this is the beginning of a move to new all-time highs, as lots more backing and filling is probably necessary in order for it to form a...
READ MORE
MEMBERS ONLY

STOCK REBOUND CONTINUES -- CYCLICAL SECTORS ARE LEADING -- 10-YEAR TREASURY YIELD REGAINS 200-DAY AVERAGE
by John Murphy,
Chief Technical Analyst, StockCharts.com
MARKET REBOUND CONTINUES... Stocks had another strong day today and have more than made back their sharp losses from Monday. Chart 1 shows the Dow Industrials closing above their 50-day average for the second day in row. Chart 2 shows the S&P 500 gaining more ground following Monday&...
READ MORE
MEMBERS ONLY

The Correction May Not Be as Bad as You Think
by Martin Pring,
President, Pring Research
The bad news is that a correction is underway and that many indicators and market averages have started to break through key support. The good news is that, internally, corrective activity has been underway for several months. Provided the bull market is still in existence (and there are few grounds...
READ MORE
MEMBERS ONLY

DOW LEADS MARKET SELLOFF -- SMALL CAPS BREAK CHART SUPPORT -- 10-YEAR YIELD BREAKS 200-DAY LINE -- ENERGY AND FINANCIALS LEAD DECLINES
by John Murphy,
Chief Technical Analyst, StockCharts.com
DOW SHATTERS 50-DAY LINE... Stocks are opening the week sharply lower and on the pace for one of the year's biggest losses. Although all market averages are under pressure, the Dow is leading the decline. Chart 1 shows the Dow Industrials plunging below their 50-day average. The next...
READ MORE
MEMBERS ONLY

US Breaks Out Against the World as Bonds Fail at 200-day Moving Average
by Martin Pring,
President, Pring Research
The US Breakout
The S&P has been in a secular or very long-term uptrend against the Dow Jones World Stock Index since the financial crisis. That trend is still intact, as the ratio remains above its 2011-2021 up trendline. The primary trend picture is a bit mixed as...
READ MORE
MEMBERS ONLY

TEN-YEAR TREASURY YIELD MAY BE BOTTOMING -- THAT WOULD HELP BANKS AND OTHER FINANCIALS
by John Murphy,
Chief Technical Analyst, StockCharts.com
TEN-YEAR TREASURY YIELD MAY BE BOTTOMING... A combination of technical factors suggests that the recent decline in bond yields may be at or near a bottom. Chart 1 shows the 10-Year Treasury yield starting to find support near its red 200-day moving average which usually acts as a support line...
READ MORE
MEMBERS ONLY
Three Intermarket Relationships That are at a Critical Point
by Martin Pring,
President, Pring Research
When reviewing my charts last weekend, several jumped out as being at a pretty critical juncture, and therefore worthy of monitoring going forward. A couple of them involved the stock market, so I'll start there.
Two Stock Market Relationships
I have always been fascinated by the relationship between...
READ MORE
MEMBERS ONLY

APPLE MAY BE BREAKING OUT -- TECH SECTOR CONTINUES TO LEAD
by John Murphy,
Chief Technical Analyst, StockCharts.com
TECH SECTOR SHOWS RELATIVE STRENGTH... Stocks are trading higher again today on the back of a stronger than expected jobs report. Eight of eleven market sectors are rising with technology in the lead. Relative strength by the tech sector is something we've been seeing a lot of lately....
READ MORE
MEMBERS ONLY

What Does a Flattening Yield Curve Mean for Bonds, the Economy and Stocks
by Martin Pring,
President, Pring Research
In the last couple of weeks or so, US treasury yield curves have begun to flatten. That may sound unduly technical and boring, but it has implications for bonds stocks and the economy. I'll get to the investment implications later, but for now I'll quickly through...
READ MORE
MEMBERS ONLY

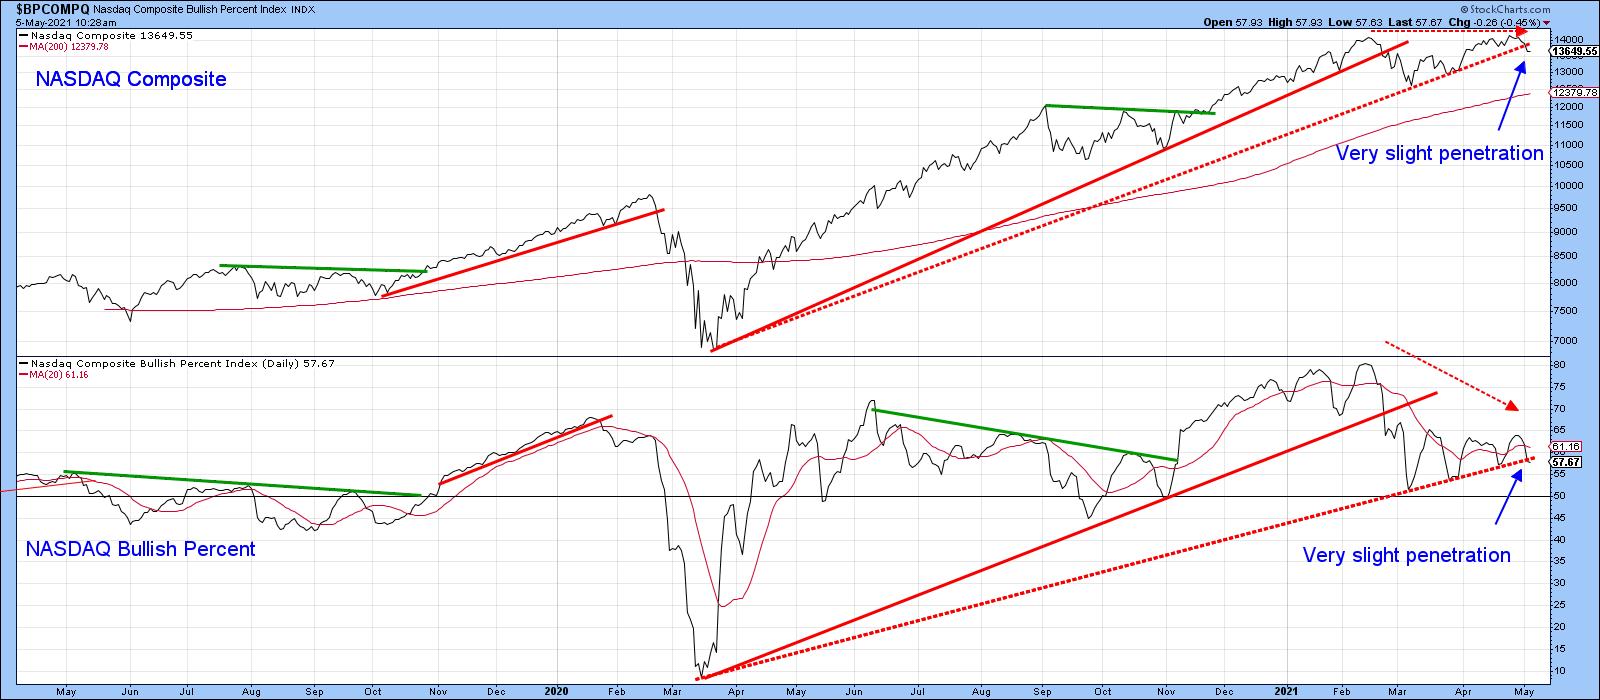
NASDAQ and S&P at a New High, But It's Very Lonely Up There
by Martin Pring,
President, Pring Research
This week saw the NASDAQ and S&P Composites rally to a new high, but not the DJIA, NYSE Composite, Unweighted S&P and Russell 2000. That's not necessarily the kiss of death, as these discrepancies can always be cleared up over time. In any case,...
READ MORE
MEMBERS ONLY

NASDAQ BREAKOUT LEADS MARKET HIGHER
by John Murphy,
Chief Technical Analyst, StockCharts.com
NASDAQ BREAKS OUT TO NEW RECORD... Stocks are having another strong day with the S&P 500 and Nasdaq indexes hitting new records. The Nasdaq breakout is especially impressive. Chart 1 shows the Nasdaq Composite Index having broken through its February/April highs to reach new record territory. In...
READ MORE
MEMBERS ONLY

DOW BREAKS SHORT-TERM SUPPORT -- FLATTENING YIELD CURVE HURTS FINANCIALS
by John Murphy,
Chief Technical Analyst, StockCharts.com
DOW UNDERCUTS ITS MAY LOW... Some hawkish comments on interest rates by a member of the Fed this morning is taking a negative toll on stocks. The Dow is under the most pressure. Chart 1 shows the Dow Industrials trading below its May low to the lowest level in nearly...
READ MORE
MEMBERS ONLY

RISING DOLLAR PUNISHES GOLD -- SO DOES THE PROSPECT FOR HIGHER RATES
by John Murphy,
Chief Technical Analyst, StockCharts.com
DOLLAR JUMPS ON FED MESSAGE... The Fed's more hawkish tone yesterday set off a number of intermarket reactions. Stocks sold off (although not by that much), and bond yields rose. Prospects for higher rates in the U.S. also had a positive impact on the dollar. Chart 1...
READ MORE
MEMBERS ONLY

Can Positive Short & Intermediate Indicators for the Dollar Tip Long-Term Balance to the Bullish Side?
by Martin Pring,
President, Pring Research
Chart 1 shows that, since 2015, the Dollar Index has been in a narrowing trading range bounded by two converging trendlines. That period has also embraced the end part of the 2011-2016 bull market, a mini bear and bull market and the current bear. I use the term "bear&...
READ MORE
MEMBERS ONLY

QQQ HITS NEW RECORD WITH TECHNOLOGY IN THE LEAD -- APPLE AND AMAZON TURN UP
by John Murphy,
Chief Technical Analyst, StockCharts.com
NASDAQ 100 HITS NEW RECORD... Chart 1 shows the Invesco QQQ Trust closing above its April high to achieve a new record. Technology was the day's strongest sector. Chart 2 shows the Technology SPDR (XLK) nearing a test of its April high. Semiconductors had another strong day as...
READ MORE
MEMBERS ONLY

Where Are We Now, What's Next?

by Larry Williams,
Veteran Investor and Author
In this special presentation, Larry shares his views about what is coming for stocks, gold, crude oil and bonds. He provides some of his secrets of cycles and fundamentals, with an alert on what you need to be following going forward. As an added bonus, Larry highlights a specific trade...
READ MORE
MEMBERS ONLY

Oil May Be on the Verge of a Major Breakout
by Martin Pring,
President, Pring Research
Last week, I featured three energy-related ETFs as part of an article on the bond market, as they had just broken out on a short-term basis. Chart 1 shows that those breakouts have held so far. This week, though, I'd like to take a deeper dive into the...
READ MORE
MEMBERS ONLY

TECH AND NASDAQ LEAD MARKET HIGHER -- SEMICONDUCTERS LEAD XLK HIGHER -- SMALL CAPS MAY BE TRIANGULATING -- BITCOIN MEETS 40K RESISTANCE
by John Murphy,
Chief Technical Analyst, StockCharts.com
NASDAQ LEADS MARKET HIGHER... Stocks are reacting positively to this morning's job report which came in weaker than expected but showed job growth during May. Bond yields weakened on the report which may be helping to boost stocks, and technology stocks in particular. Chart 1 shows the Invesco...
READ MORE
MEMBERS ONLY

Bonds at the Crossroad as Energy Breaks to the Upside
by Martin Pring,
President, Pring Research
The Dilemma Between the Long and Short-Ends
Last March, I wrote an articleopining that, while the primary trend was positive, the idea of rising bond yields may have been become too popular for the time being. In the intervening 2 ½-months, yields at the long end have backed off a...
READ MORE
MEMBERS ONLY
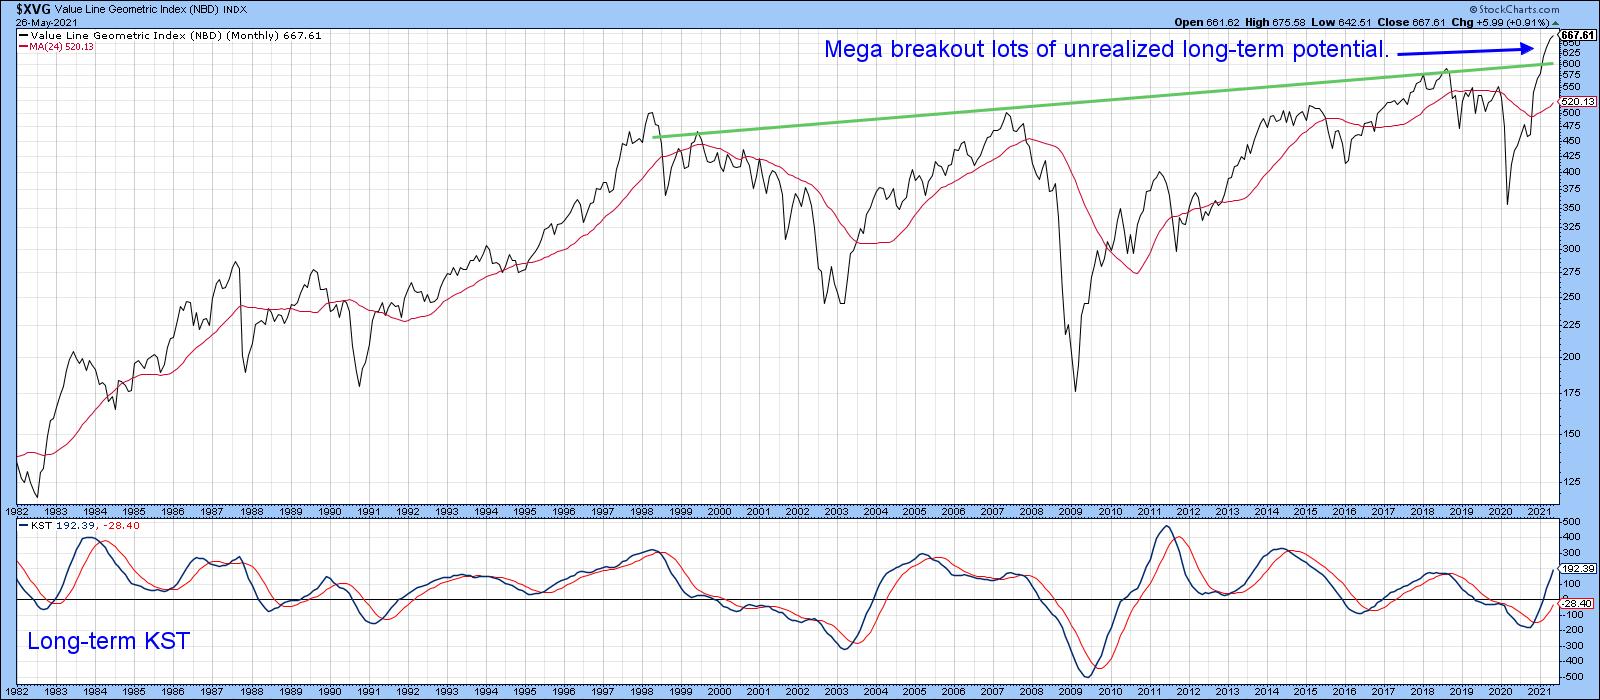
I Don't Know If the Correction Will Extend, But Here are Five Charts I'm Watching
by Martin Pring,
President, Pring Research
The Big Picture
Before we get into the subject of corrections, it's important to make sure that we do not lose focus on the big picture. For instance, take Chart 1, which features the Value Line Geometric Average. It reflects the performance of the average stock, as opposed...
READ MORE
MEMBERS ONLY

PULLBACK IN BOND YIELDS MAY BE BOOSTING TECH STOCKS AND NASDAQ -- YIELD PULLBACK, HOWEVER, MAY BE TEMPORARY
by John Murphy,
Chief Technical Analyst, StockCharts.com
10-YEAR YIELD PULLS BACK... Despite all the talk about accelerating inflation, bond yields have been pulling back of late. The daily bars in Chart 1 show the 10-Year Treasury yield falling to the lowest level in three weeks and trading below its 50-day moving average. The TNX set a 52-week...
READ MORE
MEMBERS ONLY

MONTHLY AND WEEKLY SECTOR RANKINGS HELP FIND LEADERS AND LAGGARDS -- THE VALUE/GROWTH RATIO STILL FAVORS VALUE STOCKS
by John Murphy,
Chief Technical Analyst, StockCharts.com
MONTHLY RANKINGS... Major stock indexes are ending the week with little change. The Dow and S&P 500 show a modest loss while the Nasdaq is showing a minor gain. To get a better sense of what's moving the market, a look at sector rankings can offer...
READ MORE
MEMBERS ONLY

DOW AND S&P 500 RETEST 50-DAY LINES -- STOCKS CLOSE WELL OFF THEIR LOWS -- QQQ ENDS IN POSITIVE TERRITORY
by John Murphy,
Chief Technical Analyst, StockCharts.com
DOW AND S&P 500 HOLD SHORT-TERM SUPPORT...Stocks opened sharply lower this morning but recovered most of their losses by day's end. One encouraging sign was that the Dow the S&P 500 found some support at their 50-day moving averages and potential chart at...
READ MORE
MEMBERS ONLY

Gold Starting to Look Interesting Again
by Martin Pring,
President, Pring Research
Gold has rallied nicely in the last few weeks, so the question naturally arises as to whether it's ready to resume its secular bull market. I'll get to that later, but first, a little perspective.
Longer-Term Perspective
Chart 1 plots the real price as adjusted by...
READ MORE
MEMBERS ONLY

GOLD AND SILVER ATTRACT NEW BUYING
by John Murphy,
Chief Technical Analyst, StockCharts.com
GOLD AND ITS MINERS MAY BE TURNING UP... Precious metals have sat out the rally in most commodity markets. But money is starting to flow into the group and its miners. The daily bars in Chart 1 show the VanEck Gold Miners ETF (GDX) rising above its early 2021 peak...
READ MORE
MEMBERS ONLY

THE NASDAQ SHOWS RELATIVE WEAKNESS AND MAY HOLD KEY TO MARKET DIRECTION -- S&P 500 BOUNCES OFF 50-DAY LINE
by John Murphy,
Chief Technical Analyst, StockCharts.com
THE NASDAQ REMAINS IN SHORT-TERM DOWNTREND... The tech-dominated Nasdaq market continues to show relative weakness. Chart 1 shows the Nasdaq Composite trading well below its 50-day average and in a short-term downtrend. Prices are attempting a rebound today from yesterday's heavy selling. If that low doesn't...
READ MORE
MEMBERS ONLY

SPIKE IN APRIL INFLATION AND RISING BOND YIELDS PUSH STOCKS LOWER
by John Murphy,
Chief Technical Analyst, StockCharts.com
INFLATION SPIKE BOOSTS BOND YIELDS... A spike in April CPI and its inflationary implications is boosting bond yields and hurting stock prices. Chart 1 shows the 10-Year Treasury yield jumping nearly 6 basis points today to 1.68% and close to exceeding its late April peak. That's having...
READ MORE
MEMBERS ONLY

Monday's Falling Dominos May Be Enough to Tip the Short-term Trend to the Downside
by Martin Pring,
President, Pring Research
Many internal short-term indicators are overextended and starting to look vulnerable, but need some kind of a push to tip the near-term technical balance to the bearish side. That push may have been delivered with Monday's action, as several indexes gave the appearance of some selected short-term buyer...
READ MORE
MEMBERS ONLY

DOW AND S&P OPEN SHARPLY LOWER BUT REMAIN ABOVE SHORT-TERM SUPPORT -- THE NASDAQ 100 RECOVERS FROM EARLY LOSS
by John Murphy,
Chief Technical Analyst, StockCharts.com
DOW NEARS SHORT-TERM SUPPORT... The Dow gapped sharply lower today and inflicted some short-term chart damage. Chart 1 shows its 14-day RSI backing off from overbought territory near 70; the red arrow shows its daily MACD lines forming a lower high than in April which shows some loss of upside...
READ MORE
MEMBERS ONLY

ECONOMICALLY-SENSITIVE STOCKS HAVE BEEN OUTPERFORMING TECHNOLOGY -- STOCKS RALLY TODAY ON WEAK JOBS REPORT -- NASDAQ 100 BOUNCES OFF CHART SUPPORT -- BOND YIELDS RECOVER FROM MORNING DECLINE
by John Murphy,
Chief Technical Analyst, StockCharts.com
TECHNOLOGY HAS BEEN A MARKET LAGGARD... With the economy showing signs of strength, money has been rotating into more economically-sensitive sectors at the expense of technology stocks. The table in Chart 1 shows materials, energy, and financials being the three strongest sectors over the last month, while technology has been...
READ MORE
MEMBERS ONLY
Putting Forward a Candidate to Take Over from Tech Leadership
by Martin Pring,
President, Pring Research
A couple of weeks ago, I posted an article questioning whether the tech-dominated NASDAQ still had the mojo to lead the market higher. At the time, many sub-surface indicators, such as breadth, volume and relative action, looked weak. Several charts indicated that many of them had experienced multiple negative divergences,...
READ MORE
MEMBERS ONLY

TECH STOCKS LEAD MARKET LOWER -- TECH SPDR TESTS ITS 50-DAY AVERAGE -- SEMICONDUCTORS LOSE 50-DAY SUPPORT
by John Murphy,
Chief Technical Analyst, StockCharts.com
NASDAQ BACKS OFF FROM PREVIOUS HIGH... Chart 1 shows the recent rally in the Nasdaq Composite meeting new selling near its mid-February peak which was the first warning that its uptrend might be losing upside momentum (red line). Today's lower gap confirms the idea that a short-term top...
READ MORE
MEMBERS ONLY

AMAZON TESTS OLD HIGH ON STRONG EARNINGS -- THE NASDAQ TESTING SEPTEMBER HIGH -- SLIGHT NEGATIVE DIVERGENCE FOR THE SPX -- SELL IN MAY?
by John Murphy,
Chief Technical Analyst, StockCharts.com
AMAZON RALLIES ON STRONG EARNINGS... Amazon was the last of the big five tech stocks that reported earnings this week. And it reported strong quarterly profits as did the other big tech stocks. Of those four, Facebook and Alphabet gained ground while Apple and Microsoft pulled back on the strong...
READ MORE
MEMBERS ONLY

TESLA DROPS AFTER RECORD EARNINGS -- BIG TECHS REPORT THIS WEEK
by John Murphy,
Chief Technical Analyst, StockCharts.com
TESLA DROPS AFTER REPORTING RECORD EARNINGS... How stocks react to earnings reports often tells us something about their technical condition. Tesla (TSLA) is a good example. Two weeks ago I showed Tesla rising decisively above its 50-day moving average which suggested that the stock might be bottoming. That interpretation is...
READ MORE