MEMBERS ONLY

Commodities are Breaking Out All Over

by Martin Pring,
President, Pring Research
The Fed has pumped a lot of money into the system -- and that liquidity has to go somewhere. We know a lot of it has already been flowing into stocks. Now it looks like it's time for commodities to participate. So much money, combined with bottlenecks in...
READ MORE
MEMBERS ONLY

TEN-YEAR YIELD TESTS 50-DAY AVERAGE -- SMALL CAPS STABILIZE -- BITCOIN UNDER PRESSURE

by John Murphy,
Chief Technical Analyst, StockCharts.com
TEN-YEAR TREASURY YIELD TESTS 50-DAY AVERAGE... The decline in bond yields over the last month has helped boost stock prices, and technology stocks in particular. Chart 1, however, shows the 10-Year Treasury Yield testing its 50-day moving average. The major trend of bond yields remains higher with expectations for higher...
READ MORE
MEMBERS ONLY

Has the NASDAQ Lost its Mojo?
by Martin Pring,
President, Pring Research
The NASDAQ Composite peaked on February 16, sold off and subsequently rallied back to the February high last week. Chart 1 shows that it just missed the earlier peak by a smidgen, whereas the NASDAQ 100 (in the lower window) did marginally take out its February high. Taken together, the...
READ MORE
MEMBERS ONLY

STOCKS MAINTAIN UPTRENDS -- THE NASDAQ COMPOSITE HAS HAS YET TO REACH A NEW HIGH
by John Murphy,
Chief Technical Analyst, StockCharts.com
DOW AND S&P 500 MAINTAIN UPTRENDS... Stocks snapped a two-day losing streak today and are maintaining their current uptrend. Chart 1 shows the Dow Industrials trading well above their 20-day moving average which keeps their short-term uptrend intact. Chart 2 shows the S&P 500 doing the...
READ MORE
MEMBERS ONLY

A LOOK AT WEEKLY SECTOR RANKING SHOWS UTILITIES IN THE LEAD -- OTHER DEFENSIVE SECTORS ALSO DID WELL
by John Murphy,
Chief Technical Analyst, StockCharts.com
UTILITIES ARE WEEK'S STRONGEST SECTOR...Chart 1 ranks the week's eleven S&P 500 stock sectors and shows ten of them in the black for the week. Only Communication Services are seeing a small loss. Some other laggards include industrials, financials, and energy. What may...
READ MORE
MEMBERS ONLY
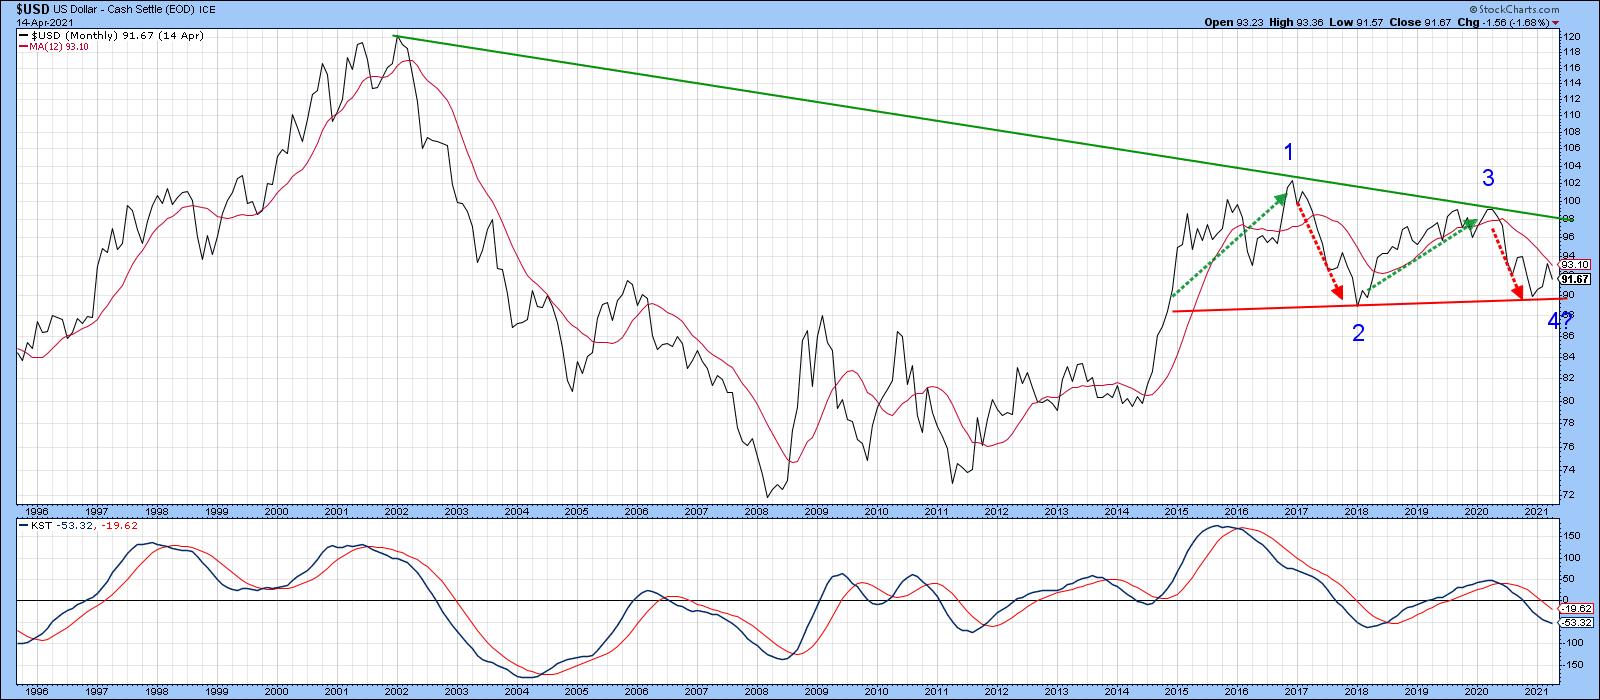
Dollar Hits a Crucial Fork in the Road
by Martin Pring,
President, Pring Research
The Dollar Index has been rangebound since 2015. During that period, it has experienced two mini bull and bear markets, as flagged by the dashed arrows in Chart 1. The latest bear has been in force for just over a year, as signaled by the Index trading below its 12-month...
READ MORE
MEMBERS ONLY

DOLLAR WEAKENS AS COMMODITIES REBOUND -- COMMODITY INDEX NEARS TWO-YEAR HIGH
by John Murphy,
Chief Technical Analyst, StockCharts.com
DOLLAR INDEX BACKS OFF FROM 200-DAY LINE...A rebound in the dollar during the first quarter may have run its course. Chart 1 shows the Invesco Dollar Index Fund (UUP) falling back below its 200-day moving average and threatening its 50-day line. What the dollar does from here could have...
READ MORE
MEMBERS ONLY

TESLA CLEARS ITS 50-DAY AVERAGE AND MAY BE BOTTOMING
by John Murphy,
Chief Technical Analyst, StockCharts.com
TESLA TURNS UP... Tesla is the day's biggest percentage gainer in the S&P 500 and the Nasdaq 100. It's also the day's strongest stock in the Consumer Discretionary SPDR which is itself hitting a new record. And it's chart is...
READ MORE
MEMBERS ONLY

Is it Time to Buy Gold?
by Martin Pring,
President, Pring Research
The gold price peaked last August and has been zig-zagging down ever since. The approximate loss from the high has so far been just north of 15%. During that period, sentiment numbers have been slowly eroding, but not to bearish extremes, so is now a good time to buy? It...
READ MORE
MEMBERS ONLY

APPLE AND AMAZON MAY BE BOTTOMING
by John Murphy,
Chief Technical Analyst, StockCharts.com
APPLE MAY BE BOTTOMING... Chart 1 shows Apple (AAPL) in a downside correction since late January. That correction has taken the stock back down to its 200-day moving average which has acted as a long-term support line. Assuming that its long-term trend is still up, this would be a logical...
READ MORE
MEMBERS ONLY

PERCENT OF S&P 500 STOCKS ABOVE THEIR MOVING AVERAGES LOOKS STRETCHED
by John Murphy,
Chief Technical Analyst, StockCharts.com
% OF S&P 500 STOCKS ABOVE 50-DAY AVERAGE IS HIGH... Market breadth figures for the stock market remain quite strong. A couple of them, however, suggest that the market may be stretched on the upside. Chart 1 shows the percent of S&P 500 stocks above their 50-day...
READ MORE
MEMBERS ONLY

CONSUMER DISRETIONARY AND TECH STOCKS LEAD MARKET HIGHER -- SOME BIG TECH BREAKOUTS --- QQQ TURNS UP
by John Murphy,
Chief Technical Analyst, StockCharts.com
CONSUMER DISRETIONARY SPDR NEARS OLD HIGH...Stocks are trading sharply higher today following a strong jobs report on Friday and news today of a stronger service economy. The Dow and S&P 500 are trading in record territory and the Nasdaq isn't far behind. Nine of the...
READ MORE
MEMBERS ONLY

Trolling the StockCharts Economic Database for Useful Stock Market Indicators
by Martin Pring,
President, Pring Research
Many of you may be unaware of the fact that StockCharts has a small database of economic indicators. (You can find them by searching for symbols that begin with $$.) This week, I ran through a number of series to see if any could be useful from a long-term stock market...
READ MORE
MEMBERS ONLY

STRONGER TECH STOCKS BOOST NASDAQ -- SEMIS TURN UP
by John Murphy,
Chief Technical Analyst, StockCharts.com
TECHS ARE HAVING A STRONG DAY... Technology stocks are the day's strongest sector which is helping boost the Nasdaq market. As a result, the Nasdaq is leading today's rally. Chart 1 show the Invesco QQQ Trust trading 1.8% higher today and nearing a test of...
READ MORE
MEMBERS ONLY

SOUTHWEST AIRLINES ACHIEVES BULLISH BREAKOUT -- ALASKA AIR AND JETBLUE MIGHT BE NEXT
by John Murphy,
Chief Technical Analyst, StockCharts.com
SOUTHWEST AIRLINES CLEARS OVERHEAD RESISTANCE... Airlines stocks continue to gain more ground. Although the entire group is rising, three in particular caught my eye. The weekly bars in Chart 1 show Southwest Airlines (LUV) having cleared resistance along its early 2020 peak and reaching the highest level in more than...
READ MORE
MEMBERS ONLY

ALUMINUM AND STEEL STOCKS BOOST MATERIALS -- HOMEBUILDERS CONTINUE TO BREAK OUT -- CHIP LEADERS
by John Murphy,
Chief Technical Analyst, StockCharts.com
MATERIALS NEAR RECORD... In a generally positive market day, materials are one of the days strongest sectors. Chart 1 shows the Materials Sector SPDR (XLB) gapping higher and nearing a new record. It's being led higher by aluminum and steel stocks which are also having a strong day....
READ MORE
MEMBERS ONLY

Out on a Limb: Market Top is Coming!

by Larry Williams,
Veteran Investor and Author
In this special presentation, Larry goes "way out on a limb" and gives a market forecast based on the tools he trusts and wants to share with you. So how can we see the future? Through seasonals, cycles, intermarket relationships, technical strength/weakness and, economic data.
This video...
READ MORE
MEMBERS ONLY
Several Key Indexes Testing Important Support
by Martin Pring,
President, Pring Research
It's never a good idea to try and predict contra-trend moves in a strong equity bull market, because the benefit of the doubt always goes with the prevailing trend. If false moves develop, they have a strong tendency to develop on the downside. That said, several key indexes...
READ MORE
MEMBERS ONLY

NASDAQ AND TECH STOCKS REMAIN ON THE DEFENSIVE -- SEMICONDUCTOR ETF REMAINS BELOW 50-DAY LINE -- SMALL CAPS WEAKEN
by John Murphy,
Chief Technical Analyst, StockCharts.com
THE NASDAQ MARKET REMAINS ON THE DEFENSIVE...The Nasdaq market remains on the defensive. Chart 1 shows the Invesco QQQ Trust meeting resistance at its 50-day average. That's mainly because of weaker tech stocks. Chart 2 shows the Technology SPDR (XLK) trading below its 50-day line as well....
READ MORE
MEMBERS ONLY

10-YEAR YIELD JUMPS TO 14-MONTH HIGH -- WEAK TECH STOCKS WEIGH ON REST OF MARKET -- QQQ LOSES ITS 50-DAY AVERAGE
by John Murphy,
Chief Technical Analyst, StockCharts.com
10-YEAR YIELD SPIKES HIGER... Bond yields continue to spike higher. Chart 1 shows the 10-Year Treasury yield jumping 9 basis points to 1.73% which is the highest level in fourteen months. That's helping lift financial shares, but weighing heavily on technology stocks. As a result, the Nasdaq...
READ MORE
MEMBERS ONLY

STOCKS REBOUND ON DOVISH FED STANCE -- CONSUMER DISCRETIONARY LOOKS STRONGER -- HOMEBUILDERS HIT NEW RECORDS
by John Murphy,
Chief Technical Analyst, StockCharts.com
MARKETS REBOUND... Stocks rebounded following today's dovish Fed statement. In addition, the 10-Year Treasury yield pared some of its earlier gains. Charts 1 and 2 show the Dow and S&P 500 touching new records. Chart 3 shows the Nasdaq Composite trading back above its 50-day moving...
READ MORE
MEMBERS ONLY

The Idea of Rising Bond Yields May be Getting Too Popular
by Martin Pring,
President, Pring Research
The longer-term indicators have been bullish on bond yields (bearish on prices) for a while now. However, they are now being joined by a number of commentators offering a similar view, which makes me uncomfortable. Don't get me wrong, the indicators are still pointing to a primary yield...
READ MORE
MEMBERS ONLY

10-YEAR YIELD IS SPIKING OVER 1.60% AND MAY BE HEADING TOWARD 2.00%
by John Murphy,
Chief Technical Analyst, StockCharts.com
10-YEAR YIELD EXCEEDS 1.60%...After a modest consolidation, bond yields are spiking again. The daily bars in Chart 1 show the 10-Year Treasury yield climbing 10 basis points to 1.63% which puts it at the highest level in more than a year. The weekly bars in Chart 2...
READ MORE
MEMBERS ONLY

NASDAQ LEADS TODAY'S RALLY -- TECHNOLOGY SPDR REGAINS 50-DAY LINE
by John Murphy,
Chief Technical Analyst, StockCharts.com
NASDAQ AND TECH SPDR REGAIN 50-DAY AVERAGE...The tech-dominated Nasdaq market led a broad rally in stocks today. Chart 1 shows the Nasdaq Composite Index gaining 2.5% and trading back above its 50-day moving average. It was the strongest of the three major stock indexes. The Dow Industrials and...
READ MORE
MEMBERS ONLY

DOW HITS NEW RECORD WHILE TECHNOLOGY LAGS -- SEMIS RUN INTO RESISTANCE -- DIP IN 10-YEAR YIELD MAY BE BOOSTING STOCKS
by John Murphy,
Chief Technical Analyst, StockCharts.com
TECH NEARS OVERHEAD RESISTANCE... While the Dow and S&P 500 are trading higher today, with the Dow in record territory, the tech-dominated Nasdaq market continues to lag behind the rest of the market. Chart 1 shows the Technology SPDR (XLK) nearing a test of its 50-day moving average...
READ MORE
MEMBERS ONLY

US Breaking Out Against the World, But the Stocks Doing it May Surprise You!
by Martin Pring,
President, Pring Research
Back in the opening week of the yearl I wrote an article entitled Four Charts and Four Themes of the First Half of 2021. Three of them - higher stocks, higher commodities and value starting to outperform growth - are so far on track, but my negative analysis concerning US...
READ MORE
MEMBERS ONLY

SECTOR RANKINGS SHOW ENERGY, FINANCIALS, AND INDUSTRIALS IN THE LEAD -- WHILE CONSUMER DISCRETIONARY AND TECHNOLOGY LAG BEHIND -- A CHART LOOK AT ENERGY
by John Murphy,
Chief Technical Analyst, StockCharts.com
ENERGY STILL IN THE LEAD... After a hectic week when a rise in bond yields caused some profit-taking in technology stocks and the Nasdaq market, a strong jobs report on Friday helped stocks end the week on a strong note. One of the factors driving bond yields higher is expectations...
READ MORE
MEMBERS ONLY

JUMP IN BOND YIELDS WEIGH ON STOCKS -- S&P 500 TRADES BELOW ITS 50-DAY AVERAGE
by John Murphy,
Chief Technical Analyst, StockCharts.com
BOND YIELD JUMPS... Bond yields are spiking higher again today following dovish remarks from Jerome Powell. Chart 1 shows the 10-Year Treasury yield jumping 7 basis points to 1.54% and putting in on track for the highest close in more than a year. As a result, stocks are coming...
READ MORE
MEMBERS ONLY

NASDAQ 100 LEADS MARKET LOWER AND FALLS FURTHER BELOW ITS 50-DAY AVERAGE
by John Murphy,
Chief Technical Analyst, StockCharts.com
NASDAQ 100 FALLS BACK BELOW 50-DAY LINE... Chart 1 shows the Invesco QQQ Trust losing -2.8% today and falling further below its 50-day moving average. Technology was the day's weakest sector along with consumer discretionary stocks. Eight of the eleven market sectors ended lower. More cyclical parts...
READ MORE
MEMBERS ONLY

After 13 Years, a Key Multi-Year Sector Relationship May be Reversing - and Could Have Enormous Implications
by Martin Pring,
President, Pring Research
Technology, as reflected in the tech-dominated NASDAQ Composite, peaked as a group in 2000 and sank in popularity for the next 3 years. Since then, as shown by the relative graph in Chart 1, it has recaptured all of that lost ground. Now, its long-term KST may have started to...
READ MORE
MEMBERS ONLY

RISING BOND YIELDS ARE WEIGHING ON GOLD
by John Murphy,
Chief Technical Analyst, StockCharts.com
GOLD SPDR CONTINUES TO WEAKEN...With all the talk about rising inflation and rising commodity prices, it may seem strange to see the gold market still in a downtrend. But it is. The daily bars in Chart 1 shows the Gold SPDR (GLD) falling to the lowest level since last...
READ MORE
MEMBERS ONLY

SPIKE IN BOND YIELDS PUSHES STOCKS LOWER -- QQQ TRADES BELOW 50-DAY LINE
by John Murphy,
Chief Technical Analyst, StockCharts.com
10-YEAR YIELD REACHES 1.50%... The 10-Year Treasury yield is spiking above 1.50% today for the first time in a year. The size and speed of the yield advance is putting downside pressure on stocks, and technology stocks in particular. Chart 1 shows the Invesco QQQ Trust trading below...
READ MORE
MEMBERS ONLY

ROTATION FROM GROWTH TO VALUE CONTINUES AS TREASURY YIELDS HIT ANOTHER HIGH FOR THE YEAR
by John Murphy,
Chief Technical Analyst, StockCharts.com
ROTATION FROM GROWTH TO VALUE... One of the side-effects of rising bond yields has been a rotation out of technology-dominated growth shares into more cyclical value shares. Chart 1 shows the S&P 500 Growth iShares (IVW) pulling back over the last week and trying to stay above its...
READ MORE
MEMBERS ONLY

Five Confidence Relationships Hit Multi-Year Resistance; Breakout Would Signal Much Higher Stock Prices
by Martin Pring,
President, Pring Research
Many confidence relationships I follow have been confined to multi-year trading ranges, as investors have consistently swung between optimism and fear. The latest data show that many have rallied sharply and reached the upper region of this rangebound activity. That either means it's time to regroup and launch...
READ MORE
MEMBERS ONLY

TRANSPORTS HIT NEW HIGHS -- WHILE UTILITIES REMAIN WEAK
by John Murphy,
Chief Technical Analyst, StockCharts.com
DOW TRANSPORTS HIT NEW RECORD...While looking through today's sector charts, I was struck by the differing performance between transportation stocks and utilities. And that difference should carry good news for stocks in general. Chart 1 shows the Dow Jones Transportation Average rising into record territory today. It&...
READ MORE
MEMBERS ONLY

10-YEAR TREASURY YIELD IS NEARING SOME OVERHEAD RESISTANCE BARRIERS
by John Murphy,
Chief Technical Analyst, StockCharts.com
POTENTIAL BOND YIELD RESISTANCE...The recent upmove in bond yields is attracting the attention of bond and stock holders. It's obviously negative for bond prices. But it could lead to some selling of stocks if bond yields were to climb too far too fast. So let's...
READ MORE
MEMBERS ONLY

RISING BOND YIELDS BOOST FINANCIALS -- BANK SPDRS TOUCH NEW RECORDS
by John Murphy,
Chief Technical Analyst, StockCharts.com
FINANCIAL SPDR HITS NEW RECORD...Energy and financials are the day's two strongest sectors. Freezing temperatures across the U.S. are pushing energy prices higher today and energy stocks along with them. Financials are also having a strong day courtesy of another jump in Treasury bond yields. Chart...
READ MORE
MEMBERS ONLY

Forget the Speculation and Uncertainty as these Short-Term Indicators are Bullish
by Martin Pring,
President, Pring Research
A few weeks ago I wrote an article entitled "Only a Fool Tries to Call a Correction in a Bull Market, So Here Goes!" Okay, so we did get a 4% drop in the Dow over a seven day period, but hardly anything worth worrying about. It reiterated...
READ MORE
MEMBERS ONLY

BOND YIELDS CONTINUE TO CLIMB -- THAT'S HELPING BANK STOCKS
by John Murphy,
Chief Technical Analyst, StockCharts.com
TEN-YEAR YIELD EXTENDS UPTREND... The uptrend in bond yields is continuing. The daily bars in Chart 1 show the 10-Year Treasury yield touching a new recovery high in today's trading. That puts the TNX at the highest level since last March. The horizontal line in Chart 2 shows...
READ MORE
MEMBERS ONLY

COMMODITY PRICES CONTINUE TO RISE WHICH SUGGESTS MORE INFLATION -- RISING COMMODITIES ARE BOOSTING BOND YIELDS AND THE YIELD CURVE
by John Murphy,
Chief Technical Analyst, StockCharts.com
CRB INDEX BREAKS TRENDLINE RESISTANCE... The current rally in commodity markets is attracting a lot of attention. Not just because commodities represent an asset class that's been attracting a lot of money over the last year. But also because of their intermarket implications. Stronger commodity markets are usually...
READ MORE