MEMBERS ONLY

Using Short-Term Momentum to Define the Primary Trend Direction of Stocks, Bonds and the Dollar

by Martin Pring,
President, Pring Research
They say that a rising tide lifts all boats, and so it is with freely traded markets. In the boating world, you can spot a rising tide with a steadily rising boat, but, with markets, the simplest approach is to observe a series of rising peaks and troughs. However, there...
READ MORE
MEMBERS ONLY

ENERGY SPDR NEARS TEST OF JUNE HIGH -- A NUMBER OF INDIVIDUAL STOCKS ARE ALSO TESTING THAT CHART BARRIER -- CRUDE OIL PRICES CONTINUE TO CLIMB

by John Murphy,
Chief Technical Analyst, StockCharts.com
ENERGY SPDR NEARS TEST OF JUNE HIGH...Energy stocks continue to show both absolute and relative strength. They're leading the market higher today, and have been the market's strongest sector over the last three months. And they're approaching an important test. The daily bars...
READ MORE
MEMBERS ONLY

RUSSELL 2000 HITS NEW RECORD AS SMALL CAP LEADERSHIP CONTINUES -- SMALL CAP LEADERSHIP IS THE STRONGEST IN DECADE -- RISING BOND YIELDS HELP SMALL CAPS
by John Murphy,
Chief Technical Analyst, StockCharts.com
RUSSELL 2000 ISHARES HIT NEW RECORD... Stocks are ending the week on a firm note with the S&P 500 and Nasdaq trading in record territory. The Dow isn't far behind. Small cap stocks, however, continue to lead the market higher. The daily bars in Chart 1...
READ MORE
MEMBERS ONLY

TAKING ANOTHER LOOK AT BITCOIN
by John Murphy,
Chief Technical Analyst, StockCharts.com
BITCOIN BOUNCES OFF ITS 50-DAY AVERAGE... A couple of recent messages took a look at Bitcoin as it underwent a downside correction. We'll take another look today. The main message is that it's starting to look stronger. Chart 1 shows Bitcoin in what looks like a...
READ MORE
MEMBERS ONLY

Key Interasset Relationships are Bullish for Stocks and Commodities but Bearish for Bonds
by Martin Pring,
President, Pring Research
The business cycle approximates 41-months between the low points of slowdowns or recessions. For the record, a slowdown develops when the growth path of the economy declines, but not sufficiently to result in an actual recession, when economic momentum goes negative. The important point to bear in mind is that...
READ MORE
MEMBERS ONLY

GAMESTOP AND AMC GAP LOWER -- SO DOES SILVER AND ITS MINERS -- DOW REGAINS 50-DAY LINE
by John Murphy,
Chief Technical Analyst, StockCharts.com
GAMESTOP AND AMC GAP SHARPLY LOWER... The recent short-squeeze mania may have finally run its course. Charts 1 and 2 show GameStop And AMC gapping sharply lower today. Other stocks caught up in the short squeeze are trading sharply lower as well. To the extent that last week's...
READ MORE
MEMBERS ONLY

TECHNOLOGY LEADING MARKET HIGHER -- A LOOK AT THE BIGGEST TECHS -- SILVER SQUEEZE?
by John Murphy,
Chief Technical Analyst, StockCharts.com
TECHNOLOGY STOCKS LEAD MARKET HIGHER ... Technology stocks are the strongest sector in a strong market day. The Technology SPDR (XLK) is trading nearly 3% higher today. The biggest tech stocks are also having a strong day. Chart 1 shows Apple gaining nearly 2% while keeping its uptrend intact. Chart 2...
READ MORE
MEMBERS ONLY

WEEKLY SECTOR RANKING SHOWS MORE CAUTION
by John Murphy,
Chief Technical Analyst, StockCharts.com
STOCKS TURN MORE DEFENSIVE...With stocks under pressure this week, it makes sense to see its eleven market sectors taking a more defensive turn as well. Chart 1 ranks the eleven market sectors from the strongest at the top to the weakest on the bottom. The first thing to notice...
READ MORE
MEMBERS ONLY

STOCKS REMAIN UNDER PRESSURE -- SOME MOVING AVERAGE LINES ARE BEING BROKEN -- GAMESTOP MANIA MAY BE CONTRIBUTING TO SELLING
by John Murphy,
Chief Technical Analyst, StockCharts.com
STOCKS TEST MOVING AVERAGE LINES... Stock indexes remain under pressure again today and are pressuring moving average lines. Chart 1 shows the Dow Industrials falling below its 50-day moving average for the first time since early November. It may be headed for a test of a potential support line drawn...
READ MORE
MEMBERS ONLY

Long-Term Interest Rates Getting Close to an Upside Breakout
by Martin Pring,
President, Pring Research
The Fed has pledged to keep short-term rates around zero for an extended period. That's certainly in their power, and Chart 1, which features the 3-month Libor, indicates no sign of life. There is also quite a distance between the latest plot and its 12-month MA. At this...
READ MORE
MEMBERS ONLY

STOCKS UNDERGO SOME PROFIT-TAKING -- SOME MACD DIVERGENCES TO WATCH
by John Murphy,
Chief Technical Analyst, StockCharts.com
DAILY MACD LINES SHOW NEGATIVE DIVERGENCE... Stocks are undergoing some profit-taking today in a market that looks stretched on the upside. One of the factors that concerns me is the relatively weak performance by daily MACD lines. Chart 1 overlays the MACD lines on a daily chart of the S&...
READ MORE
MEMBERS ONLY

BITCOIN TESTS UNDERLYING SUPPORT LEVELS
by John Murphy,
Chief Technical Analyst, StockCharts.com
BITCOIN RETESTS JANUARY LOW... Bitcoin remains in a downside correction that started earlier in January. And it's testing some important support levels. The daily bars in Chart 1 show bitcoin testing a couple of support levels formed earlier in the month (horizontal lines). It's also nearing...
READ MORE
MEMBERS ONLY

BIG TECH STOCKS ARE MAKING A COMEBACK -- QQQ IS SHOWING NEW LEADERSHIP
by John Murphy,
Chief Technical Analyst, StockCharts.com
BIT TECHS ARE DOING BETTER... The largest technology stocks have been trading sideways over the past few months while the rest of the market has been rallying. The last two days, however, are showing money starting to flow back into some of the biggest tech stocks. Chart 1 shows Apple...
READ MORE
MEMBERS ONLY

Only a Fool Tries to Call a Correction in a Bull Market, So Here Goes!
by Martin Pring,
President, Pring Research
Last week, I recorded a 40-minute presentation with my friend Bruce Fraser on the 2021 outlook. It's currently being featured on StockCharts TVand calls for a significant extension to the bull market. We present a number of long-term charts featuring several indicators whose bullish signals have consistently been...
READ MORE
MEMBERS ONLY

A THREE-MONTH LOOK AT SECTOR LEADERSHIP SHOWS MORE OPTIMISM -- RISING COMMODITY PRICES AND RISING BOND YIELDS HAVE ALSO PLAYED A ROLE
by John Murphy,
Chief Technical Analyst, StockCharts.com
ECONOMICALLY-SENSTIVE GROUPS HAVE BEEN MARKET LEADERS...The last three months have seen rising stock prices. What's especially encouraging is which sectors have led the market higher. Chart 1 plots the sector performance over those three months. The top five sectors have been energy, financials, materials, industrials, and consumer...
READ MORE
MEMBERS ONLY

ECONOMICALLY-SENSITIVE TRANSPORTS HIT NEW HIGHS -- WHILE DEFENSIVE UTILITIES LAG BEHIND -- BITCOIN REBOUNDS
by John Murphy,
Chief Technical Analyst, StockCharts.com
TRANSPORTS HIT NEW RECORD... It's usually a good sign to see more economically-sensitive groups hitting new highs, while more defensive groups are lagging behind. Two examples of that are seen by comparing the transportation stocks and utilities. Chart 1 shows the Dow Transports hitting a new record again...
READ MORE
MEMBERS ONLY

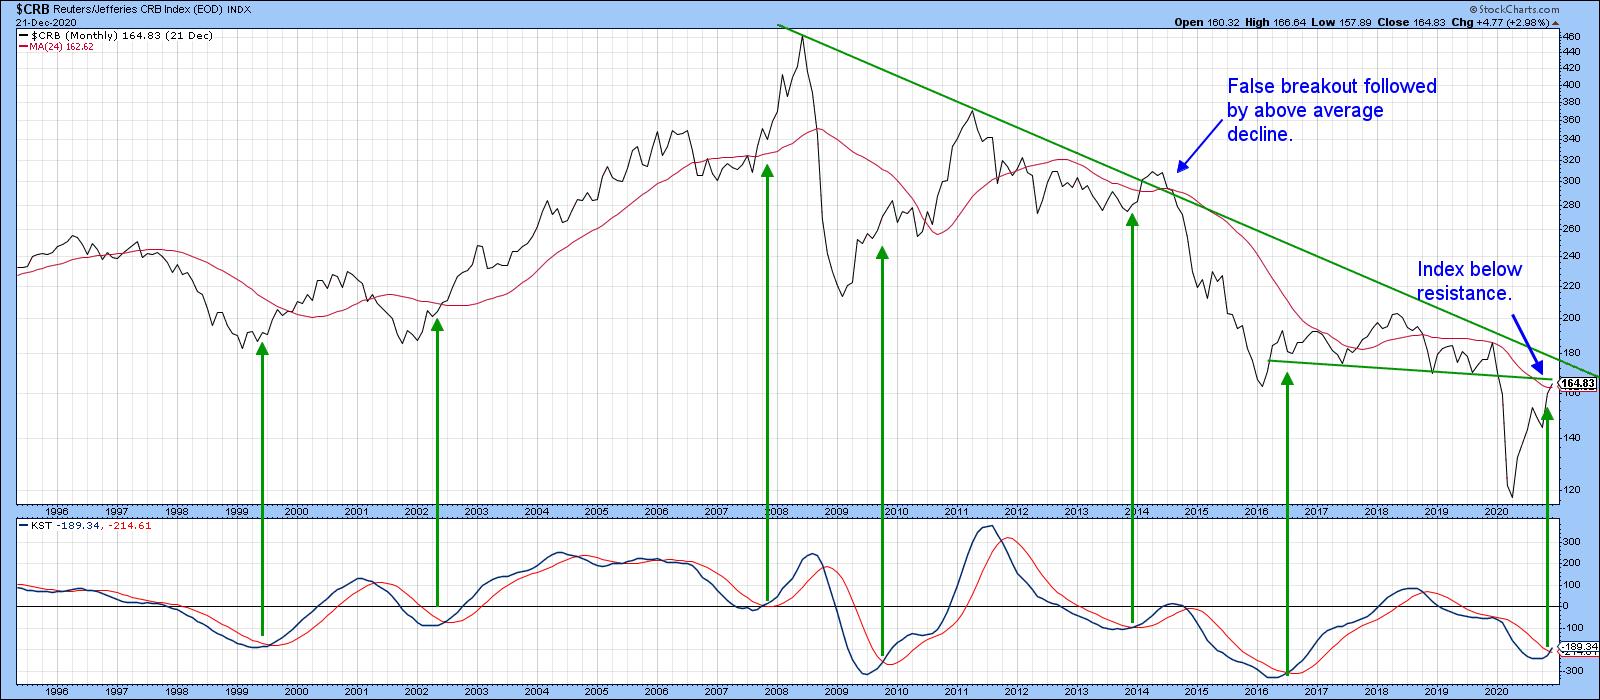
GRAIN MARKETS REACH MULTI-YEAR HIGHS -- CRB INDEX TESTS TRENDLINE RESISTANCE -- A LONGER-TERM LOOK AT COMMODITY PRICES
by John Murphy,
Chief Technical Analyst, StockCharts.com
GRAIN MARKETS ARE IN NEW UPTRENDS... Higher commodity markets are starting to attract more attention because of the potential for higher inflation. Past messages have written about new uptrends in energy markets or industrial commodities like copper. Some of the biggest gains, however, are being seen in agricultural markets, and...
READ MORE
MEMBERS ONLY
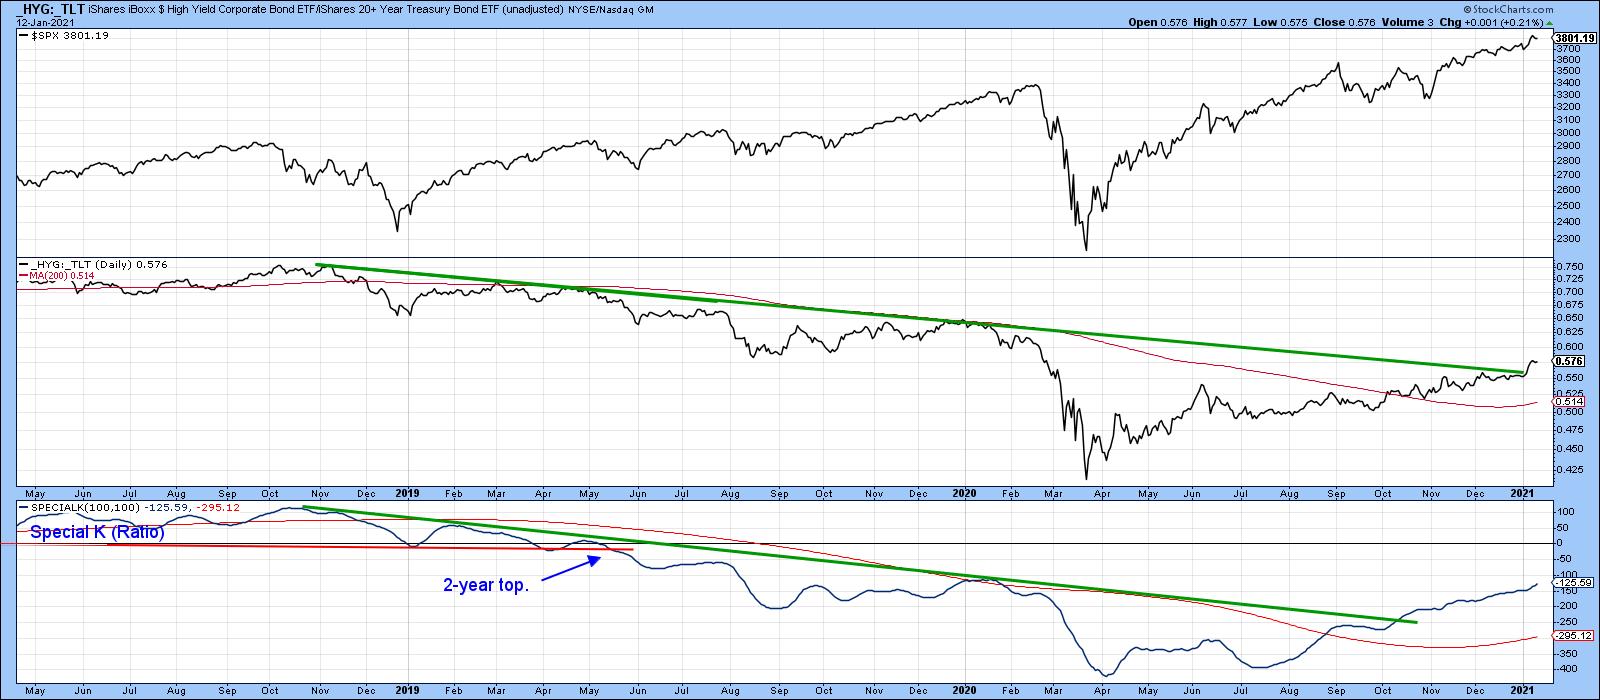
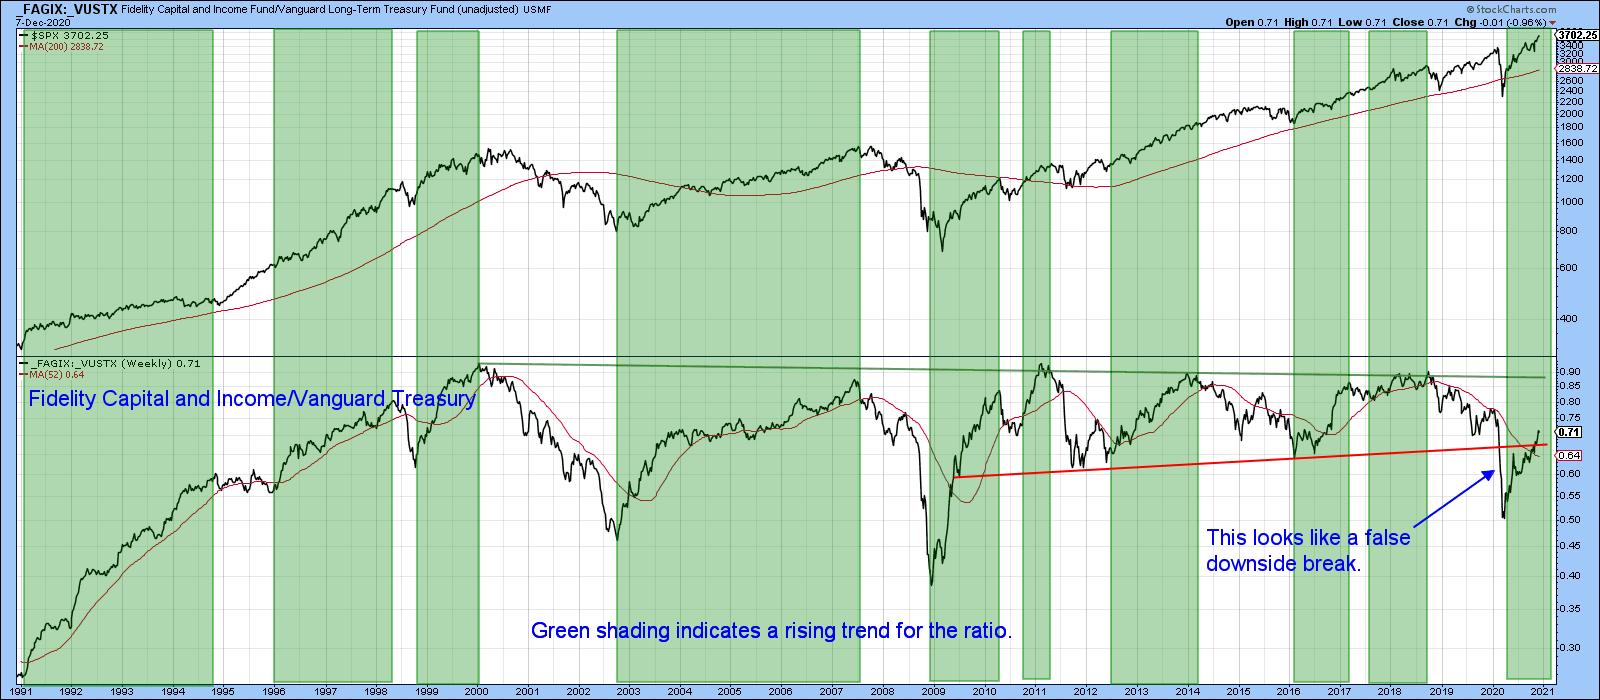
Green Light Still Flashing for Higher Bond Yields, Stock & Commodity Prices
by Martin Pring,
President, Pring Research
Back in early November, I wrote an article entitled,Confidence is Breaking Out all Over, Which is Bullish for Stocks/Commodities and Bond Yields, where I examined several intermarket relationships that monitor confidence. Since then, all three markets have rallied, but a further review of some of these relationships presents...
READ MORE
MEMBERS ONLY

ENERGY ETFS NEAR UPSIDE BREAKOUTS -- OIH HAS ALREADY CLEARED ITS JUNE HIGH -- RISING ENERGY SHARES ARE PART OF THE REFLATION TRADE
by John Murphy,
Chief Technical Analyst, StockCharts.com
ENERGY ETFS CONTINUE CLIMBING... Energy stocks continue to show new market leadership. That leadership is reflected in two energy ETFs that may be nearing some upside breakouts, and one having already achieved one. Chart 1 shows the Energy Sector SPDR (XLE) trading at the highest level in more than six...
READ MORE
MEMBERS ONLY

BITCOIN FINALLY CORRECTS
by John Murphy,
Chief Technical Analyst, StockCharts.com
BITCOIN CORRECTS VERY OVERBOUGHT CONDITION...The rally in bitcoin over the past year has been nothing short of spectacular. The daily bars in Chart 1 show how big that gain has been. Prices have gone from $4000 in the spring to $40000 last week. It also doubled in price from...
READ MORE
MEMBERS ONLY

Four Charts and Four Themes for the First Half of 2021
by Martin Pring,
President, Pring Research
Prices are determined by the attitude of market participants to the emerging fundamentals. Fortunately for us technicians, these attitudes move in trends, and once a trend gets underway it tends to perpetuate. Provided it is not overstretched, we can reasonably assume that that trend will continue. It's in...
READ MORE
MEMBERS ONLY

TEN-YEAR TREASURY YIELD EXCEEDS 1% FOR FIRST TIME SINCE MARCH -- THAT'S HELPING MAKE FINANCIALS THE DAY'S STRONGEST SECTOR -- MATERIALS AND INDUSTRIALS HIT RECORDS
by John Murphy,
Chief Technical Analyst, StockCharts.com
10-YEAR TREASURY YIELD EXCEEDS 1%... Bond yields and stocks are climbing sharply today on hopes for more stimulus spending. And the market is being led higher by more economically-sensitive stocks like financials, materials, energy, and industrials. Financials in particular are getting big boost from rising bond yields. Chart 1 shows...
READ MORE
MEMBERS ONLY

GOLD AND SILVER SURGE -- SILVER AND ITS MINERS ARE RISING FASTER -- STOCKS WEAKEN
by John Murphy,
Chief Technical Analyst, StockCharts.com
GOLD AND SILVER SURGE... A couple of recent messages described the price of gold being in a downside correction but finding support near its 200-day moving average. The most recent message showed both metals gaining more ground which suggested that their correction might be ending. Both precious metals are surging...
READ MORE
MEMBERS ONLY

2021 Outlook

by Larry Williams,
Veteran Investor and Author
In this special episode of Real Trading with Larry Williams, Larry presents his forecast for the coming year in the markets. He reviews his 2020 forecast, goes over what he thinks is going to happen in 2021 and shows how you can better understand the future of the markets.
This...
READ MORE
MEMBERS ONLY

Why Gold Bugs Should Be Praying for the Demise of Commodities
by Martin Pring,
President, Pring Research
Last month, the gold price slipped down very closely towards its 12-month MA. This is not a perfect indicator, but most downside penetrations are followed by bearish action, so you could say that gold is at the crossroads. Chart 1 tells us that prices have bounced a bit since then,...
READ MORE
MEMBERS ONLY

A LONGER TERM LOOK AT FREEPORT MCMORAN SHOWS A NEW BULL TREND
by John Murphy,
Chief Technical Analyst, StockCharts.com
FREEPORT MCMORAN HITS NEW 52-WEEK HIGH... This article is about using charts in different time spans to gain a better perspective on an individual stock or any other market. I'm using copper producer Freeport McMoran (FCX) to make that point. I'm picking that stock because it&...
READ MORE
MEMBERS ONLY

RUSSELL 2000 GIVES SHORT-TERM WARNING -- RSI WEAKENS -- MACD LINES TURN NEGATIVE
by John Murphy,
Chief Technical Analyst, StockCharts.com
RUSSELL 2000 ISHARES WEAKEN...Stocks are having trouble holding onto today's intra-day records. Small caps in particular are showing some new signs of weakness. The daily bars in Chart 1 show the Russell 2000 iShares (IWM) trading lower for the third day in a row. Of more concern...
READ MORE
MEMBERS ONLY

STOCK UPTREND CONTINUES -- FINANCIALS HIT NEW RECOVERY HIGH -- CORPORATE BONDS MOVE UP WITH STOCKS
by John Murphy,
Chief Technical Analyst, StockCharts.com
20-DAY AVERAGES ARE HOLDING... Yesterday's message used hourly bar charts to show the three major stock indexes holding short-term support levels. Today's daily bars show stocks continuing to stay above their green 20-day moving averages. They're usually the first line of support on market...
READ MORE
MEMBERS ONLY
Bullish Commodities Run Into Resistance
by Martin Pring,
President, Pring Research
The global business cycle is nothing more than a chronological sequence of economic and financial market turning points. One of these involves a bottoming of commodity prices, as a new bull market gets underway. That reversal occurred several months ago and has recently been confirmed by numerous long-term indicators. That...
READ MORE
MEMBERS ONLY

STOCK INDEXES HOLD SHORT-TERM SUPPORT LEVELS -- THE QQQ IS THE STRONGEST OF THE THREE
by John Murphy,
Chief Technical Analyst, StockCharts.com
STOCK INDEXES HOLD SHORT-TERM SUPPORT... The Dow and S&P 500 have spend the past the last couple of weeks consolidating within existing uptrends. And they've managed to hold onto their existing uptrends. The hourly bars in Chart 1 show yesterday morning's pullback in the...
READ MORE
MEMBERS ONLY

GOLD ETF MOVES FURTHER ABOVE 200-DAY AVERAGE -- SILVER ETF HITS THREE-MONTH HIGH -- DEFINITION OF SANTA CLAUS RALLY
by John Murphy,
Chief Technical Analyst, StockCharts.com
PRECIOUS METALS ADVANCE... My message from December 8 wrote about gold trying to find support near its 200-day moving average. It also showed silver trying to stabilize as well. Both precious metals are having a strong day and moving above some short-term resistance levels. Chart 1 shows the Gold Shares...
READ MORE
MEMBERS ONLY

Numerous International Multi-Year Trading Ranges are Reminiscent of the 1982 Dow 1,000 Breakout
by Martin Pring,
President, Pring Research
Years ago, before online charting platforms were widely available, technicians resorted to chartbooks published on a weekly or monthly basis and received days later in the snail mail. Using their long-term perspective helped a lot of us to appreciate that surpassing Dow 1,000 (see Chart 1) was a really...
READ MORE
MEMBERS ONLY

20-DAY MOVING AVERAGES ARE HOLDING FOR MAJOR STOCK INDEXES -- TECHNOLOGY SPDR NEARS TEST OF OLD HIGH -- APPLE HAS A BREAKOUT DAY
by John Murphy,
Chief Technical Analyst, StockCharts.com
STOCK INDEXES MAINTAIN UPTREND... Stocks experienced some minor profit-taking over the last week but have maintained their uptrends. All three of the major stock indexes have found support along their 20-day moving averages. Chart 1 shows the Dow Industrials bouncing off their green 20-day line. Charts 2 and 3 show...
READ MORE
MEMBERS ONLY

TODAY'S ENERGY LEADERS INCLUDE APACHE, HESS, DEVON ENERGY, AND CHEVRON
by John Murphy,
Chief Technical Analyst, StockCharts.com
ENERGY LEADERS...This morning's message showed the price of oil breaking above its August high which helped make energy the day's strongest sector. Energy stocks are also among the day's biggest individual gainers in the overall market. Three of the individual leaders are shown...
READ MORE
MEMBERS ONLY

UNITED STATES OIL FUND BREAKS OUT -- ENERGY CONTINUES TO SHOW NEW LEADERSHIP -- ENERGY ETFS APPEAR HEADED TOWARD JUNE HIGHS
by John Murphy,
Chief Technical Analyst, StockCharts.com
UNITED STATES OIL FUND BREAKOUT... The price of crude oil continues to rise and is pulling energy shares along with it. Chart 1 shows the United States Oil Fund (USO) surging to the highest level in eight months after clearing its previous high formed during August. The USO has also...
READ MORE
MEMBERS ONLY

STOCK INDEXES MAY BE LOSING SOME UPSIDE MOMENTUM
by John Murphy,
Chief Technical Analyst, StockCharts.com
SHORT-TERM MOMENTUM INDICATORS START TO WEAKEN... Stocks are still in the midst of a strong run that started in early November. But they're starting to look stretched over the short run; and may be vulnerable to some profit-taking. The two upper boxes in Chart 1 show the RSI...
READ MORE
MEMBERS ONLY
Five Charts that are Pointing to Higher Stocks and Bond Yields
by Martin Pring,
President, Pring Research
Two Stock Market Relationships That Have Just Turned Positive
A few weeks ago, I wrote about some intermarket relationships pointing in the direction of higher stock prices. Picking through my StockCharts chart lists earlier in the week, I noticed a couple more that have only just moved into the bullish...
READ MORE
MEMBERS ONLY

GOLD AND ITS MINERS TRY TO HOLD 200-DAY LINES -- SILVER AND ITS MINERS ARE SLIGHTLY STRONGER BUT ALSO TESTING UNDERYING SUPPORT LEVELS -- RISING BOND YIELDS MAY BE HOLDING GOLD BACK
by John Murphy,
Chief Technical Analyst, StockCharts.com
GOLD SPDR TRIES TO HOLD 200-DAY LINE...Gold has been in a downside correction since the start of August. And it's now undergoing an important test. Chart 1 shows the Gold Shares SPDR (GLD) trading back above their 200-day moving average after slipping below it near the end...
READ MORE
MEMBERS ONLY
Santa Claus Rally Exposed
by Larry Williams,
Veteran Investor and Author
In this special episode of Real Trading with Larry Williams, Larry explores the famous "Santa Claus Rally" and how it applies in 2020. The rally is coming earlier than you might expect in the season for toy, candy, jewelry, and other related stocks. So when does/did the...
READ MORE
MEMBERS ONLY

CANADIAN DOLLAR HITS TWO-YEAR HIGH -- WHILE CANADIAN ISHARES HIT NEW RECORD -- RISING CURRENCY FAVORS CANADA ISHARES
by John Murphy,
Chief Technical Analyst, StockCharts.com
CANADIAN DOLLAR HITS TWO-YEAR HIGH...With the U.S. dollar falling to the lowest level in more than two years, foreign currencies are rising. One of them is the Canadian Dollar. The weekly bars in Chart 1 show the $CDW rising to the highest level in two years. Since Canada...
READ MORE