MEMBERS ONLY

WEAK DOLLAR CONTINUES TO BOOST FOREIGN STOCK ETFS QUOTED IN DOLLARS -- EUROZONE ETF REACHES SIX-MONTH HIGH -- GERMANY ISHARES MAY BE BREAKING OUT -- THE NETHERLANDS ETF HITS NEW RECORD

by John Murphy,
Chief Technical Analyst, StockCharts.com
EAFE ISHARES REACH SIX-MONTH HIGH... I wrote a message three weeks ago on Wednesday, July 22 to the effect that a weaker U.S. dollar was boosting foreign stocks ETFs that are quoted in dollars. When American investors buy foreign stocks, they're also indirectly buying local currencies. So...
READ MORE
MEMBERS ONLY

Time for a Little Firmness in Bond Yields?

by Martin Pring,
President, Pring Research
Chart 1 shows that the basic trend for bond yields around the world is still negative, as all series are in a clear-cut downtrend. The only exception is Japan, where the secular down trendline was violated earlier in the year. So far, though, the yield has only managed a sideways...
READ MORE
MEMBERS ONLY

BOUNCING BOND YIELDS BOOST BANKS AND FINANCIALS -- AND CONTRIBUTE TO PROFIT-TAKING IN GOLD
by John Murphy,
Chief Technical Analyst, StockCharts.com
GLOBAL YIELDS REBOUND... Bond yields are rebounding today. That may be partially due to an uptick in producer price inflation. Or the fact that global stocks are also rebounding which is driving some money out of bonds and into stocks. Global yields are rebounding along with stocks. Chart 1 shows...
READ MORE
MEMBERS ONLY

DOW INDUSTRIALS EXCEED JUNE HIGH -- CATERPILLAR AND NIKE BREAK OUT -- AIRLINES LEAD TRANSPORTS HIGHER -- FEDEX HAS ANOTHER BIG DAY
by John Murphy,
Chief Technical Analyst, StockCharts.com
DOW EXCEEDS JUNE HIGH... The Dow Industrials continue to gain ground on the rest of the stock market. And is the strongest of the three major stock indexes today. Chart 1 shows the Dow Industrials trading above their June intra-day peak at 27,600. The Dow is the last of...
READ MORE
MEMBERS ONLY

ALUMINUM AND STEEL STOCKS LEAD MATERIALS HIGHER -- ALCOA AND CENTURY ALUMINUM HAVE STRONGER CHART PATTERNS -- SO DO NUCOR AND STEEL DYNAMICS
by John Murphy,
Chief Technical Analyst, StockCharts.com
ALCOA CLEARS 200-DAY LINE...CENTURY ALUMINUM LEADS... Material stocks continue to act as market leaders. Strong gold miners are a big part of that. So are copper miners. Last Wednesday' message showed the Dow Jones Nonferrous Metals Index scoring a bullish breakout along with Freeport McMoran (FCX); and Southern...
READ MORE
MEMBERS ONLY

TECHS RETREAT AS OTHER GROUPS GAIN -- INDUSTRIALS ARE WEEK'S TOP SECTOR -- SMALL CAPS AND TRANSPORTS ALSO GAIN -- FEDEX DELIVERS 52-WEEK HIGH WHILE UPS REACHES NEW RECORD--
by John Murphy,
Chief Technical Analyst, StockCharts.com
MODEST ROTATION TAKES PLACE... Big tech has been the main story in the market since the start of the pandemic with most of the rest of the market largely left behind. Over the past couple of weeks, however, we've started to see some money moving into weaker parts...
READ MORE
MEMBERS ONLY

Evidence of a Commodity Bull Market Continues to Grow
by Martin Pring,
President, Pring Research
I have written about commodities several times in the last four months or so as evidence of a major reversal had begun to appear. Now, more indicators are starting to turn. Near-term, things look overdone, but if this is really is a bull market, that will not matter, as short-term...
READ MORE
MEMBERS ONLY

SMALL CAPS AND DOW TRANSPORTS EXCEED THEIR JUNE PEAKS -- DOW EXCEEDS JULY PEAK -- XLI CLEARS 200-DAY LINE -- DEERE BREAKS OUT -- S&P 500 NEARS TEST OF FEBRUARY PEAK
by John Murphy,
Chief Technical Analyst, StockCharts.com
RUSSELL 2000 ISHARES AND DOW TRANSPORTS PASS JUNE HIGH...DOW GAINS...The rally in stocks continues to broaden out. Market groups that had lagged behind the stock recovery are starting to catch up. Small caps and transports are two examples. Chart 1 shows the Russell 2000 iShares (IWM) trading above...
READ MORE
MEMBERS ONLY

DOLLAR DROP BOOSTS COMMODITIES -- AND STOCKS TIED TO THEM -- GOLD MOVES FURTHER ABOVE $2000 -- COPPER MINERS BREAK OUT -- SO DOES FREEPORT MCMORAN -- A STRONG COPPER MARKET IS A GOOD SIGN FOR THE GLOBAL ECONOMY
by John Murphy,
Chief Technical Analyst, StockCharts.com
COPPER MINERS LEAD MATERIALS HIGHER... A falling dollar has been one of the big factors pushing commodity prices higher and stocks tied to them. Today's drop in the greenback to another two-year low is continuing the flow of money into commodity assets. Several messages over the last month...
READ MORE
MEMBERS ONLY

NASDAQ HITS ANOTHER RECORD -- MICROSOFT AND SEMIS LEAD TECH SECTOR -- JACOBS ENGINEERING AND QUANTA LEAD XLI
by John Murphy,
Chief Technical Analyst, StockCharts.com
TECHS AND NASDAQ CONTINUE TO LEAD THE WAY... Big techology stocks are leading the market higher today again. Chart 1 show the Nasdaq Composite Index reaching a new high as did the Technology SPDR (XLK). Its biggest percentage gainers were Microsoft and a number of chip stocks. Chart 2 shows...
READ MORE
MEMBERS ONLY

APPLE, AMAZON, AND FACEBOOK HAVE BIG DAY FOLLOWING STRONG EARNINGS -- MAJOR STOCK INDEXES MAINTAIN UPTRENDS -- EXPD AND UPS DELIVER NEW RECORDS -- DOW TRANSPORTS CONTINUE TO GAIN GROUND
by John Murphy,
Chief Technical Analyst, StockCharts.com
THREE BIG TECHS LEAD FRIDAY REBOUND... Going into Thursday evening, most of the TV stock market commentary centered around the big tech stocks that were announcing quarterly earnings after the close. The consensus seemed to be that the big tech stocks had already seen huge gains for the year, and...
READ MORE
MEMBERS ONLY

Stocks in China to Get Body-Slammed

by Larry Williams,
Veteran Investor and Author
On this special episode of Real Trading with Larry Williams, Larry goes out on a limb to explain why he thinks stocks in China are ready for significant decline. You'll get a sneak peek of his unique indicators coming soon to StockChartsACP, as Larry demonstrates their functions and...
READ MORE
MEMBERS ONLY
Copper Could Hold the Key for the Next Leg Up in the Stock Market Rally
by Martin Pring,
President, Pring Research
* Rising Commodity Momentum is Bullish for Stocks and the Economy
* Long-Term Technicals Look Promising for Copper
Swings in commodity prices are both a market and an economic indicator. There are certainly exceptions, but when the economy is in a recovery phase, commodity prices generally rise. During the early phase of...
READ MORE
MEMBERS ONLY

POINT & FIGURE CHARTS OF TRANSPORTATION LEADERS SHOW BULLISH BREAKOUTS
by John Murphy,
Chief Technical Analyst, StockCharts.com
POINT & FIGURE CHARTS SHOW TRANSPORTATION BREAKOUTS...My morning message wrote about four transportation stocks that were achieving bullish breakouts. A glitch in the system, however, prevented me from showing their usual bar charts. So I've improvised a bit to bring their point & figure versions. Unlike bar...
READ MORE
MEMBERS ONLY

TRUCKERS LEAD TRANSPORTS HIGHER -- CHRW AND LANDSTAR SCORE BIG BREAKOUTS -- EXPEDITORS INTL HITS NEW RECORD -- TRANSPORTS LEAD XLI HIGHER
by John Murphy,
Chief Technical Analyst, StockCharts.com
DOW TRANSPORTS MOVE FURTHER ABOVE 200-DAY LINE... Transportation stocks are one of today's strongest groups. Chart 1 shows the Dow Transports gaining 2% this morning and moving further above their 200-day moving average which is now acting as a line of support (see red arrow). My message on...
READ MORE
MEMBERS ONLY

TECH STOCKS REBOUND -- DOLLAR DROPS NEAR TWO-YEAR LOW AS PRECIOUS METALS SURGE -- FOREIGN ETFS REBOUND
by John Murphy,
Chief Technical Analyst, StockCharts.com
REBOUND IN NASDAQ 100 STEADIES MARKET... Stocks are opening the week on a firmer note. A rebound in tech stocks is one of the reasons why. Last Thursday's high-volume selloff in tech stocks caused some nervous profit-taking as the week ended. Chart 1 shows the Nasdaq 100 (QQQ)...
READ MORE
MEMBERS ONLY

BIG TECHS LEAD MARKET RETREAT -- NASDAQ 100 IS BIGGEST LOSER AND LOOKS VULNERABLE TO DEEPER PULLBACK
by John Murphy,
Chief Technical Analyst, StockCharts.com
NASDAQ 100 TESTS 20-DAY LINE... A selloff in the biggest tech stocks is putting downside pressure on stocks today; and is helping make the Nasdaq 100 the day's biggest percentage loser. And it looks technically vulnerable to a deeper pullback. The daily bars in Chart 1 show the...
READ MORE
MEMBERS ONLY

EURO CLIMBS TO TWO -YEAR HIGH -- THAT'S GOOD FOR EUROZONE ETFS -- GERMAN ISHARES NEAR BULLISH BREAKOUT -- WEAK DOLLAR BOOSTS EMERGING MARKETS
by John Murphy,
Chief Technical Analyst, StockCharts.com
EURO RALLIES TO TWO-YEAR HIGH... Yesterday's message showed the euro testing its March high. Chart 2 shows the eurozone currency trading above that level in today's trading. That puts the euro at the highest level in nearly two years. The rising euro is putting more downside...
READ MORE
MEMBERS ONLY

Where Do You Invest if the Trend Favoring the US Against the World Reverses?
by Martin Pring,
President, Pring Research
* The US versus the Rest of the World
* Europe
* Asia
The US versus the Rest of the World
Chart 1 shows that the up trend favoring the S&P Composite against the Vanguard All-World Ex-US ETF (the VEU) is intact. That's because the latest plot is above...
READ MORE
MEMBERS ONLY

RISING EURO PUSHES DOLLAR TO LOWEST LEVEL SINCE MARCH -- A WEAKER DOLLAR IS BOOSTING ENERGY AND METAL PRICES -- AND STOCKS TIED TO THEM
by John Murphy,
Chief Technical Analyst, StockCharts.com
RISING EURO PUSHES DOLLAR LOWER...Chart 1 show the Invesco Dollar Index Bullish Fund (UUP) declining today to the lowest level since March. The dollar surged during the first quarter in a flight to safety as stock prices plunged. Then fell from late March to July as stocks recovered. And...
READ MORE
MEMBERS ONLY

SILVER ISHARES REACH FOUR-YEAR HIGH -- SILVER CONTINUES TO OUTPACE GOLD --THE GOLD/SILVER RATIO AT ALL-TIME HIGH -- WHICH MAKES SILVER HISTORICALLY CHEAP
by John Murphy,
Chief Technical Analyst, StockCharts.com
SILVER ISHARES HIT FOUR-YEAR HIGH... Precious metals (and their mining ETFs) are rising again today with all of them hitting multi-year highs. As has been the case recently, however, silver (and its miners) are actually rising faster than gold (and its miners). The black daily bars in Chart 1 show...
READ MORE
MEMBERS ONLY

TRUCKERS LEAD TRANSPORTS HIGHER -- JB HUNT, OLD DOMINION, AND KNIGHT-SWIFT TRANSPORTATION HIT RECORD HIGHS -- C.H. ROBINSON IS TURNING UP...LANDSTAR MAY BE NEARING UPSIDE BREAKOUT
by John Murphy,
Chief Technical Analyst, StockCharts.com
RAILS AND TRUCKERS LEAD TRANSPORTS HIGHER... Wednesday's message showed the Dow Transports closing above their 200-day line for the first time since early June. Chart 1 shows them continuing to build on that upturn. Their relative strength ratio in the upper box has turned up as well, which...
READ MORE
MEMBERS ONLY

A Changing of the Guard? New Sector Leadership May Be Emerging
by Martin Pring,
President, Pring Research
* Technology About to Pause?
* New Blood is Starting to Emerge
* Two Fence Sitters
Technology About to Pause?
The undisputed king of sectors so far this year has been technology. This week's price action from the tech dominated NASDAQ Composite ($COMPQ), though, suggests that this leadership may be rotating...
READ MORE
MEMBERS ONLY

S&P 500 TESTS TOP OF RECENT RANGE -- RUSSELL 2000 AND DOW TRANSPORTS CLEAR 200-DAY LINES -- VALUE STOCKS GAIN GROUND -- HEALTHCARE HITS NEW RECORD -- MATERIAL STOCKS MAY BE NEXT
by John Murphy,
Chief Technical Analyst, StockCharts.com
S&P 500 TESTS JUNE HIGH... Stocks gained more ground today with ten of eleven sectors in the black. Chart 1 shows the S&P 500 ending the day just below its early June intra-day high at 3233. Also encouraging was better participation by value stocks which have...
READ MORE
MEMBERS ONLY

ENERGY, MATERIALS, INDUSTRIALS, AND HEALTHCARE LEAD STOCKS HIGHER -- CATERPILLAR AND DEERE ARE XLI LEADERS -- ALIGN TECH AND UNITEDHEALTH ARE XLV LEADERS -- STOCKS CLOSE STRONG
by John Murphy,
Chief Technical Analyst, StockCharts.com
CATERPILLAR AND DEERE HAVE A STRONG DAY...With technology stocks underperforming for the second day in a row, money flowed into cheaper parts of the market today. All eleven sectors closed higher with energy, materials, industrials and healthcare in the lead. Energy is benefiting from crude oil prices over $40,...
READ MORE
MEMBERS ONLY

HEALTHCARE IS DAY'S STRONGEST SECTOR -- AND MAY BE READY TO RESUME LEADERSHIP ROLE -- HEALTHCARE LEADERS ARE LAB CORP, QUEST DIAGNOSTICS AND PERKINELMER -- S&P 500 TESTS ITS JUNE HIGH -- WHILE THE DOW TRADES ABOVE ITS 200-DAY LINE
by John Murphy,
Chief Technical Analyst, StockCharts.com
BUYING HEALTHCARE AGAIN... After taking a leadership role during March and April, healthcare stocks have essentially moved sideways over the last couple of months while the rest of the market has gained ground. The sector's recent underperformance can be seen by the falling XLV/SPX relative strength ratio...
READ MORE
MEMBERS ONLY

LONG-TERM TREND SHIFTING IN FAVOR OF GOLD -- GOLD/DOW RATIO MAY BE BOTTOMING -- RATIO OF GOLD MINERS TO SPX IS EVEN STRONGER
by John Murphy,
Chief Technical Analyst, StockCharts.com
LONG-TERM TREND APPEARS TO BE SHIFTING TO GOLD OVER STOCKS... Recent messages showing the ongoing bull market in gold (and its miners) have stressed that a weaker dollar and historically low global interest rates have pushed the price of gold to the highest level in nearly nine years. Yesterday'...
READ MORE
MEMBERS ONLY

A WEAKER DOLLAR IS HELPING TO BOOST GOLD -- BUT GOLD IS ALSO RISING FASTER THAN MAJOR FOREIGN CURRENCIES ON CONCERNS ABOUT GLOBAL ECONOMY -- INVESTORS MAY ALSO BE BUYING GOLD TO HEDGE AGAINST AN UNCERTAIN STOCK MARKET
by John Murphy,
Chief Technical Analyst, StockCharts.com
GOLD VERSUS THE DOLLAR... The generally inverse relationship between gold and the U.S. Dollar is one of the best known and reliable intermarket relationships. Part of the reason is that gold is traded in U.S. dollars. Another part is due to the fact that gold is often preferred...
READ MORE
MEMBERS ONLY

GOLD SPDR REACHES AN EIGHT-YEAR HIGH -- ITS MINERS ARE ALSO HITTING MULTI-YEAR HIGHS -- SILVER IS RALLYING AS WELL -- ITS MINERS ARE LEADING THE COMMODITY HIGHER
by John Murphy,
Chief Technical Analyst, StockCharts.com
GOLD SPDR REACHES ANOTHER EIGHT-YEAR HIGH...Gold prices are on the rise again. The monthly bars in Chart 1 show the Gold Shares SPDR (GLD) rising to the highest level since 2012. The August gold contract has risen to $1820 and appears headed toward its 2011 peak at $1923. Gold...
READ MORE
MEMBERS ONLY

Silver May Be Close to a Major Breakout
by Martin Pring,
President, Pring Research
* Silver has been Range-Bound - But is That About to End?
* Silver Shares Starting to Perk Up
* Silver Bottoming Against Gold?
Silver has been Range-Bound - But is That About to End?
Gold has been in a strong bull market recently, which has eclipsed the performance of the gray metal....
READ MORE
MEMBERS ONLY

RISING CHINESE STOCKS PULL COPPER HIGHER -- ALONG WITH COPPER PRODUCERS -- FREEPORT MCMORAN IS DAY'S SPX LEADER
by John Murphy,
Chief Technical Analyst, StockCharts.com
CHINESE STOCKS AND COPPER HAVE BEEN RISING TOGETHER...This morning's message showed the Shanghai Stock Index surging to the highest level in two years; and mentioned that was also good for copper prices. This message elaborates a bit more on the relationship between the two. The red bars...
READ MORE
MEMBERS ONLY

CHINESE STOCKS LEAD GLOBAL STOCKS HIGHER -- CHINESE ETFS NEAR MAJOR UPSIDE BREAKOUTS -- ASIA LEADS EMERGING MARKETS HIGHER -- STRONGER CHINA BOOSTS COPPER PRICES
by John Murphy,
Chief Technical Analyst, StockCharts.com
CHINESE STOCK SOAR... A huge rally in China is leading a rally in stock markets around the world. The red arrow in Chart 1 shows the Shanghai Composite Index surging 5.7% to close at the highest level in more than two years. The SSEC close at 3332 also puts...
READ MORE
MEMBERS ONLY

STRONG JOBS REPORT BOOSTS STOCKS -- NASDAQ HITS NEW HIGH -- WHILE DOW AND S&P 500 REMAIN IN TRADING RANGES -- AIRLINES AND FINANCIALS REMAIN WEAK -- SMALL CAPS LAG BEHIND -- A TALE OF TWO MARKETS
by John Murphy,
Chief Technical Analyst, StockCharts.com
DOW AND SPX REMAIN IN TRADING RANGES...Despite gaining ground this past week, little has changed for the market's major stock indexes. Continued buying of technology growth stocks pushed the Nasdaq Composite to a new record (Chart 1). The rest of the market, however, continued to lag behind....
READ MORE
MEMBERS ONLY

The Shanghai Composite Experiences A Historic Breakout
by Martin Pring,
President, Pring Research
* Shanghai Composite Ruptures Mega Trendline
* Chinese ETFs Breaking as Well
* Interesting Chinese Sector ETFs
Back in March, I wrote about the Chinese stock market, as it had started to improve in terms of relative action against the S&P. Since then, Chinese equities have moved higher with no net...
READ MORE
MEMBERS ONLY

WEAK DOLLAR BOOSTS COMMODITY PRICES -- CRUDE OIL, COPPER, GOLD HAVE STRONG QUARTER -- SO DO STOCKS TIED TO THEM -- GOLD TOUCHES 11-YEAR HIGH -- WITH A LOT OF HELP FROM LOW INTEREST RATES
by John Murphy,
Chief Technical Analyst, StockCharts.com
US DOLLAR HAD WEAK SECOND QUARTER... After surging during March (as stock prices plunged), the U.S. Dollar peaked in late March and moved lower during the second quarter. Rising stock prices during that quarter reduced the appeal of the dollar as a haven currency. Rising foreign currencies also reflected...
READ MORE
MEMBERS ONLY

UPSIDE GAPS IN FEDEX AND UPS BOOST TRANSPORTS -- A REBOUND IN AIRLINE STOCKS IS ALSO HELPING -- BOTH GROUPS ARE ALSO CONTRIBUTING TO THE XLI
by John Murphy,
Chief Technical Analyst, StockCharts.com
DOW TRANSPORTS NEAR TEST OF 200-DAY AVERAGE...Transportation stocks are off to a strong start this morning. Chart 1 shows the Dow Transports rising to a two-week high after bouncing off their 50-day moving average last week. They may be headed for a test of their 200-day moving average. Tranportation...
READ MORE
MEMBERS ONLY

STOCKS OFF TO A STRONG START -- DOW AND S&P 500 HOLD CHART SUPPORT -- SMALL CAPS ARE HAVING A STRONG DAY -- BOEING AND SOUTHWEST AIR LEAD INDUSTRIALS
by John Murphy,
Chief Technical Analyst, StockCharts.com
DOW AND SPX HOLD CHART SUPPORT... Stocks are off to a strong start for the week. And are holding some important support levels. Chart 1 shows the Dow Industrials bouncing off potential chart support at its 50-day average (blue line) and its early June intra-day low at 24,800. It&...
READ MORE
MEMBERS ONLY

STOCKS WEAKEN AS CORONAVIRUS CASES RISE -- NASDAQ PULLS BACK FROM OVERBOUGHT CONDITION -- WHILE S&P 500 ENDS BELOW ITS 200-DAY LINE -- SECTOR LEADERSHIP REMAINS THIN -- FINANCIALS HAVE A BAD WEEK -- FACEBOOK LEADS INTERNET STOCKS LOWER
by John Murphy,
Chief Technical Analyst, StockCharts.com
MAJOR STOCK INDEXES WEAKEN... Major stock indexes lost ground this week on a disturbing rise in coronavirus cases which could undermine the U.S. economy. Chart 1 shows the Nasdaq Composite pulling back from a record high set on Tuesday. Its 14-day RSI line in the upper box shows a...
READ MORE
MEMBERS ONLY

Gold Moves to a New High; Will the Breakout Hold?
by Martin Pring,
President, Pring Research
* Long-Term Gold Charts Give Perspective
* Gold vs. the Dollar
* Gold vs. Gold Shares
* Short-Term Gold Position
* Conclusion
Long-Term Gold Charts Give Perspective
Gold broke out to a new recovery high on Tuesday and looks set to gain more ground, all with a favorable background from the long-term trend.
Chart 1...
READ MORE
MEMBERS ONLY
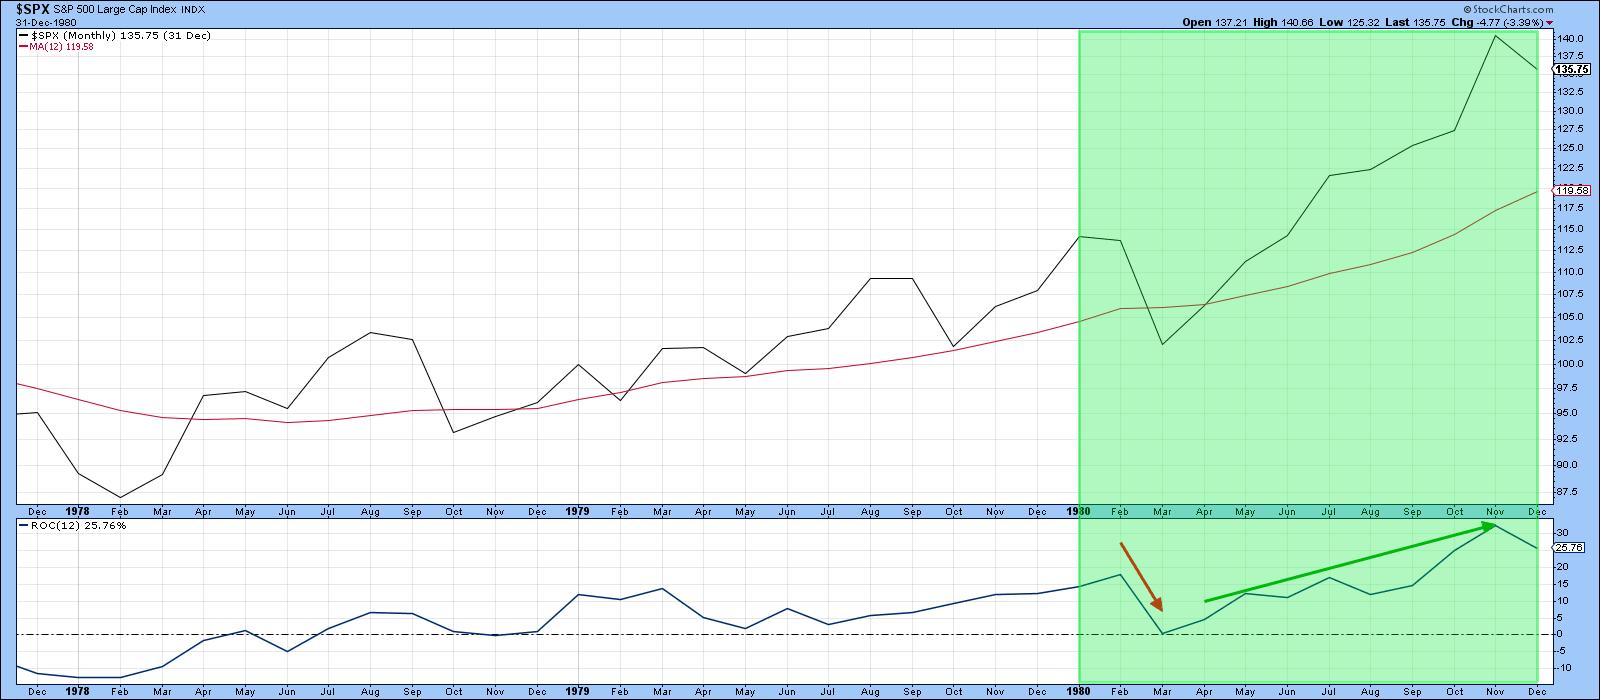
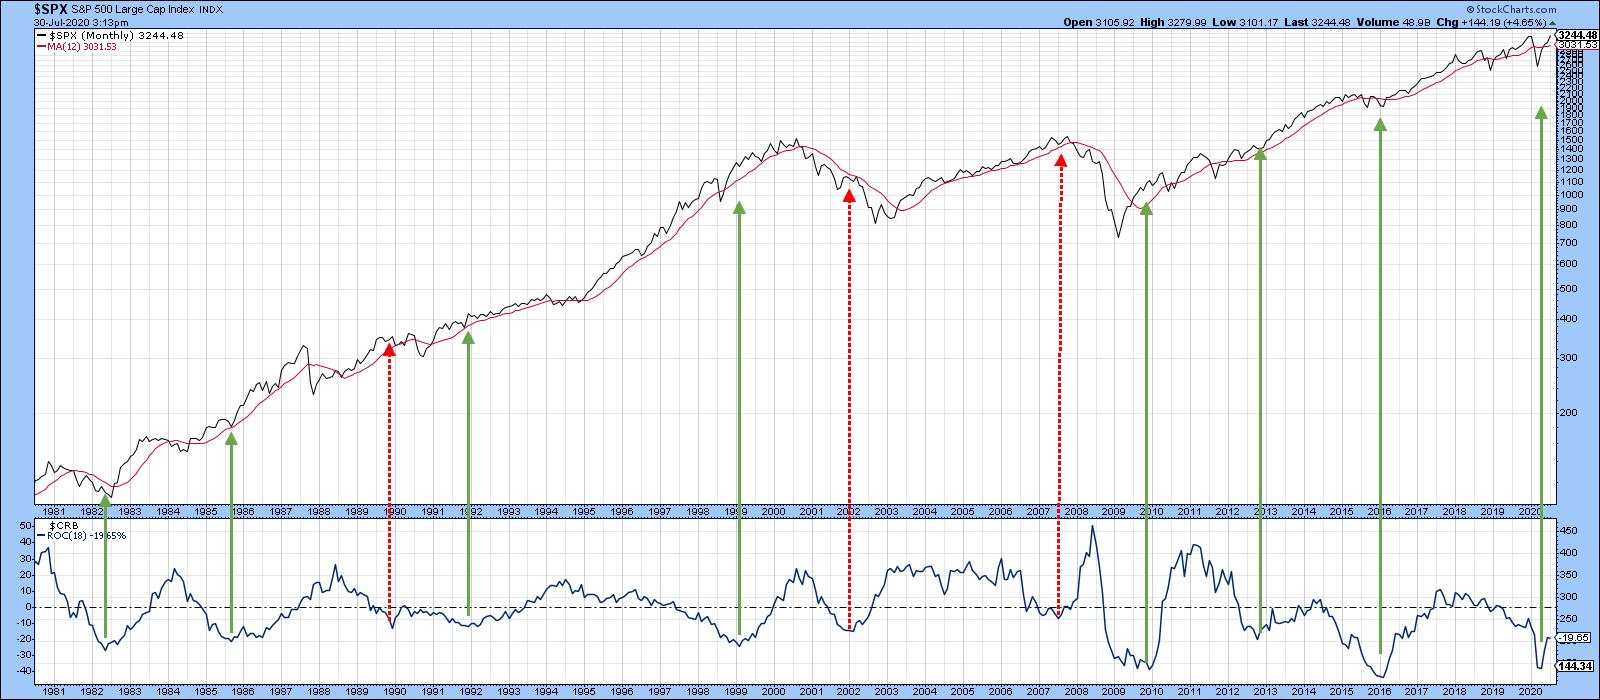
Is Twenty-Twenty Nineteen-Eighty Déjà vu All Over Again?
by Martin Pring,
President, Pring Research
* The Decennial Cycle and Years Ending in a "0"
* 1980 and 2020 Both Experienced Recessions
* Further Out, Things are More Problematic
* China Technology Breaks to the Upside
The simple answer to the question posed in the title is "No!". However, there are a number of interesting...
READ MORE