MEMBERS ONLY

Market Action Confirms the Employment Report

by Martin Pring,
President, Pring Research
* Market Gets a New Lease on Life
* Ten-Day Breadth Ratio Hits Bullish Extreme
* S&P Stocks Above 50-day MA Also Hit a Bullish Extreme
* Can Small-Caps Extend their Sharp Rally?
Usually, when a market rallies sharply and experiences an overbought condition, the probabilities favor corrective activity of some kind....
READ MORE
MEMBERS ONLY

Did the May Employment Report Signal an End to the Recession?
by Martin Pring,
President, Pring Research
Part-Time Employees for Economic Reasons is a leading indicator of the labor market. That's because employers are more inclined to hire and fire temporary workers than permanent ones, where labor laws, contracts, pensions and other impediments get in the way. This indicator has been consistently useful in identifying...
READ MORE
MEMBERS ONLY

Commodities Reach Important Breakout Points, Part II
by Martin Pring,
President, Pring Research
* The Gold/CRB Ratio as a Commodity Indicator
* Close Correlation between Canadian/Australian Dollars and Commodities
* The Stock Market Votes for Commodities
* Short-Term Breakout Underway?
The Gold/CRB Ratio as a Commodity Indicator
A couple of weeks ago, I wrote an article on commodities suggesting that conditions were falling into...
READ MORE
MEMBERS ONLY

S&P Fails at its 200-Day MA and NASDAQ Closes a Major Gap
by Martin Pring,
President, Pring Research
* March Was a Really Strong Bottom
* NASDAQ Closes a Gap
* S&P Fails at its 200-Day MA
* Conclusion
March Was a Really Strong Bottom
Tuesday's action looks bullish on the surface, but may signal the end of the rally. I emphasized the word "may" not...
READ MORE
MEMBERS ONLY

Commodity Indexes Reach Important Breakout Points
by Martin Pring,
President, Pring Research
* Gold Has Done its Work as a Leading Commodity Indicator
* The Stock Market is Forecasting Higher Commodity Prices
* Commodities on the Verge of a Breakout
* Oil VIX Signals a Major Bottom in Oil Prices
Three weeks ago, I raised the question as to whether commodities had begun to embark on...
READ MORE
MEMBERS ONLY

APPAREL RETAILERS LEAD XLY HIGHER -- AIRLINES ARE HOLDING TRANSPORTS BACK -- STRONGER RAILS AND TRUCKERS ARE A VOTE OF CONFIDENCE IN THE U.S. ECONOMY

by John Murphy,
Chief Technical Analyst, StockCharts.com
APPAREL RETAILERS LEAD XLY HIGHER... Chart 1 shows the Consumer Discretionary SPDR (XLY) trading at the highest level in three months and north of its 200-day average. The XLY/SPX relative strength ratio in the upper box is also rising. Apparel retailers are leading the XLY higher. Chart 2 shows...
READ MORE
MEMBERS ONLY

STOCKS HAVE ANOTHER STRONG DAY -- S&P 500 NEARS TEST OF 200-DAY AVERAGE -- ALL ELEVEN SECTORS ARE GAINING -- SMALLER STOCKS SHOW STRONG GAINS
by John Murphy,
Chief Technical Analyst, StockCharts.com
STOCKS CONTINUE RALLY MODE... Stock prices are trading sharply higher again today. Chart 1 shows the Nasdaq Composite Index ($COMPQ) trading at a three month high. Chart 2 shows the S&P 500 nearing a test of its 200-day moving average. Chart 3 shows the Dow Industrials nearing a...
READ MORE
MEMBERS ONLY

SEMICONDUCTORS LEAD TECH SECTOR HIGHER -- CHIPS LEADERS ARE NVIDIA, SKYWORKS, AND INTEL
by John Murphy,
Chief Technical Analyst, StockCharts.com
SEMIS LEAD TECH SPDR HIGHER... Technology is the day's strongest sector. Chart 1 shows the Technology Sector SPDR (XLK) rising today to the highest level in nearly three months. It's being led higher by semiconductors . Chart 2 shows the PHLX Semiconductor iShares (SOXX) moving above its...
READ MORE
MEMBERS ONLY

Market Indicators: Swear By Them, or Swear At Them?

by Larry Williams,
Veteran Investor and Author
On this special episode of Real Trading with Larry Williams, Larry walks viewers through what he considers to be the best indicators, including technical and fundamental ones alike. Larry discusses their limitations and explains why they have them, then shows you the best ways that you can use them in...
READ MORE
MEMBERS ONLY

STOCKS SURGE ON VACCINE OPTIMISM -- MAJOR INDEXES NEAR TEST OF RECENT HIGHS -- SMALL STOCKS SURGE AS WELL -- CONSUMER CYCLICALS CLEAR 200-DAY LINE -- MODERNA SURGES ON VACCINE NEWS
by John Murphy,
Chief Technical Analyst, StockCharts.com
STOCKS SURGE ON VACCINE OPTIMISM... A report that a vaccine developed by Moderna is showing positive results helped push stocks sharply higher today. Charts 1 and 2 show the Dow Industrials and S&P 500 gapping higher and in position to test their recent highs. The SPX may also...
READ MORE
MEMBERS ONLY

STOCK INDEXES STABILIZE -- FINANCIALS REBOUND -- BANK INDEX TESTS MARCH LOW
by John Murphy,
Chief Technical Analyst, StockCharts.com
STOCK INDEXES STABILIZE NEAR SUPPORT... After a weak start this morning, major stock indexes are stabilizing near some short-term support levels. Chart 1 shows the Dow Industrials finding support at its 50-day moving average and its mid-April intraday low at 22900. Chart 2 shows the S&P 500 holding...
READ MORE
MEMBERS ONLY

S&P Struggling Below Its 200-Day MA; Watch Those Financials!
by Martin Pring,
President, Pring Research
Last week, I pointed out that the S&P Composite, despite the strong rally off the March low, had failed to touch an overbought condition. That presented a problem, since a security that is unable to reach an overstretched reading is usually suffering from some kind of a bear...
READ MORE
MEMBERS ONLY

STOCKS START THE DAY UNDER PRESSURE -- SMALL CAPS ARE LEADING THE DECLINE -- SO ARE FINANCIALS AND INDUSTRIALS
by John Murphy,
Chief Technical Analyst, StockCharts.com
DOW AND S&P 500 WEAKEN... Stock prices are continuing the pullback that began yesterday afternoon. And some short-term support levels may soon be tested. Chart 1 shows the Dow Industrials slipping below their 20-day average (green line) and in position to test their early May low at 23400....
READ MORE
MEMBERS ONLY

NASDAQ TURNS POSITIVE FOR YEAR -- S&P 500 MAY RETEST APRIL HIGH -- USING SCTR LINES TO RANK SECTORS
by John Murphy,
Chief Technical Analyst, StockCharts.com
STOCKS RALLY ON BAD ECONOMIC NEWS... Last weekend's message suggested that the spring rally in stocks may have peaked. Judging from this week's strong price action, that doesn't appear to be the case. Stock prices have shown remarkable resilience in the face of very...
READ MORE
MEMBERS ONLY

CONSUMER DISCRETIONARY SPDR MAY BE NEXT TO CHALLENGE 200-DAY LINE -- EBAY IS ONE OF ITS BEST PERFORMERS -- SO ARE CHIPOTLE, TRACTOR SUPPLY, AND ROLLINS -- AND HOME IMPROVEMENT STOCKS
by John Murphy,
Chief Technical Analyst, StockCharts.com
CONSUMER DISCRETIONARY SPDR NEARS 200-DAY LINE... Yesterday's message showed the Communication Services SPDR (XLC) trying to clear its 200-day moving average which it has done. The next in line may be consumer cyclicals. Chart 1 shows the Consumer Discretionary SPDR (XLY) nearing a test of its red line....
READ MORE
MEMBERS ONLY

This Reliable Long-Term Indicator Could Go Bullish at the End of the Month
by Martin Pring,
President, Pring Research
Sixty-Five Year Record of Success
One of my favorite long-term indicators involves the 12-month ROC of the S&P Composite falling below the -5% level and subsequently rallying back above zero. This approach is shown in Chart 1, which illustrates the period from 1995 through April 30 of this...
READ MORE
MEMBERS ONLY

COMMUNICATION SPDR STILL TESTING 200-DAY LINE -- INTERNET STOCKS ARE LEADING IT HIGHER -- USING SCTR RANKINGS TO FIND STOCK LEADERS
by John Murphy,
Chief Technical Analyst, StockCharts.com
XLC CONTINUES TO TEST 200-DAY LINE... Tuesday's message showed the Communication Services SPDR (XLC) challenging its 200-day moving average. Chart 1 shows that test still in progress. Its relative strength line in the lower box has also been rising. Internet stocks are the main driver behind recent XLC...
READ MORE
MEMBERS ONLY

STOCKS OPEN HIGHER -- NASDAQ CONTINUES TO LEAD -- CHIPS REGAIN 200-DAY LINE -- MICROSOFT AND APPLE REMAIN STRONG -- ALHPABET AND FACEBOOK LEAD COMMUNICATION SERVICES SPDR HIGHER
by John Murphy,
Chief Technical Analyst, StockCharts.com
STOCKS OPEN ON A STRONG NOTE... Stock prices opened much higher this morning. And all three major stock indexes are bouncing off some moving average lines. Chart 1 shows the Dow Industrials bouncing off their 20- and 50-day moving averages which is usually their first line of support. Chart 2...
READ MORE
MEMBERS ONLY

STOCK INDEXES MAY HAVE PEAKED -- THE QUESTION IS HOW MUCH WILL THEY RETRACE -- FALLING CHIP STOCKS THREATEN NASDAQ UPTREND -- AMAZON IS THE FIRST OF BIG FIVE TO BE SOLD
by John Murphy,
Chief Technical Analyst, StockCharts.com
STOCK RALLY MAY HAVE PEAKED... A number of short-term technical indicators suggest that the spring rebound in stocks may have peaked this past week. The daily bars in Chart 1 show the S&P 500 selling off on Thursday and Friday after touching its 62% Fibonnaci retracement line (purple...
READ MORE
MEMBERS ONLY

AMAZON WEIGHS ON CONSUMER CYCLICALS -- LAM RESEARCH LEADS SEMIS LOWER -- EXCEPT FOR AMAZON, BIG TECH STOCKS ARE HAVING A RELATIVELY STRONG WEEK
by John Murphy,
Chief Technical Analyst, StockCharts.com
AMAZON SELLOFF HURTS CONSUMER CYCLICALS... Stocks in general are undergoing some profit-taking today. And consumer cyclicals are one of the day's weakest groups. A big reason for that is today's big drop in Amazon.com (AMZN). Chart 1 shows that influential stock dropping -7% today on...
READ MORE
MEMBERS ONLY

Is It Time For a Commodity Rally?
by Martin Pring,
President, Pring Research
Commodities have been badly beaten up in the last few months, but no market goes down for ever, so it's natural to ask the question of whether it's time for an upside reversal. The evidence for that is not conclusive yet, but there are some very...
READ MORE
MEMBERS ONLY

STOCKS CLIMB ON ENCOURAGING DRUG NEWS -- S&P 500 APPROACHES 200-DAY AVERAGE -- GOOGLE AND FACEBOOK LEAD XLC HIGHER -- XLY NEARS ITS 200-DAY LINE
by John Murphy,
Chief Technical Analyst, StockCharts.com
S&P 500 NEARS TEST OF 200-DAY AVERAGE...A positive report by Gilead Sciences on its Covid-19 drug helped stocks get off to a strong start today. The biotech stock is up 3% this morning on that report. Chart 1 shows the S&P 500 gaining more than...
READ MORE
MEMBERS ONLY

DOW AND S&P 500 CLEAR 50-DAY LINES -- SMALL CAPS HAVE A STRONG DAY -- FALLING VIX ALSO SUPPORTS HIGHER STOCK PRICES
by John Murphy,
Chief Technical Analyst, StockCharts.com
DOW AND S&P 500 CLEAR 50-DAY LINES...Stocks spent Monday extending the rebound that started two months ago. And they continue to overcome some overhead resistance barriers. Chart 1 shows the Dow Industrials trading back above its 50-average for the first time since February. While Chart 2 shows...
READ MORE
MEMBERS ONLY

STOCK REBOUND REMAINS INTACT --BUT LONGER-TERM TREND REMAINS IN DOUBT -- HEALTHCARE AND TECH ACCOUNT FOR THIRD OF SPX -- EQUAL-WEIGHT S&P 500 ETF LAGS BEHIND
by John Murphy,
Chief Technical Analyst, StockCharts.com
MAJOR STOCK INDEXES END WEEK SLIGHTLY LOWER...After an unusually volatile week which included a plunge in the price of oil below zero, major stock indexes ended the week with small losses. Which leaves their overall trend patterns little changed. Chart 1 shows the Dow Industrials ending the week just...
READ MORE
MEMBERS ONLY

GOLD MINERS FINALLY BREAK OUT TO THE UPSIDE -- GOLD MINERS ARE STARTING TO DO BETTER THAN GOLD -- AND THE STOCK MARKET
by John Murphy,
Chief Technical Analyst, StockCharts.com
GOLD MINERS ACHIEVE UPSIDE BREAKOUT... The price of gold continues to rise. Chart 1 shows the Gold Shares SPDR (GLD) trading higher and nearing another seven-year high. Gold miners, however, are doing even better. The daily bars in Chart 2 show the VanEck Vectors Gold Miners ETF (GDX) jumping more...
READ MORE
MEMBERS ONLY

Trendline Violations Suggest The Rally Is Losing Momentum
by Martin Pring,
President, Pring Research
In recent articles, I have pointed out that quite a few of the short-term indicators reached well beyond their normal oversold readings at the March lows. Historically, this is has been a very bullish characteristic, often signaling the end of a bear market. The difference between now and most of...
READ MORE
MEMBERS ONLY

STOCKS SELL OFF AS OIL PRICE PLUNGES -- DOW AND S&P 500 PULL BACK FROM 50-DAY AVERAGES -- THE NASDAQ FALLS BELOW ITS 200-DAY LINE ON TECHNOLOGY SELLING
by John Murphy,
Chief Technical Analyst, StockCharts.com
MAJOR STOCK INDEXES ARE UNDER HEAVY SELLING PRESSURE...The plunge in the price of the May crude oil contract below zero this week, and the continuing plunge in oil prices in general, is taking a toll on stock market sentiment and trading. All three major stock indexes are under heavy...
READ MORE
MEMBERS ONLY

NASDAQ IS FIRST INDEX TO CLEAR ITS 200-DAY LINE -- STRONG BIOTECH GROUP LEADS HEALTHCARE HIGHER-- AMAZON.COM LEADS CONSUMER CYCLICALS
by John Murphy,
Chief Technical Analyst, StockCharts.com
STOCKS EXTEND APRIL RALLY...Stocks ended the week on a strong note to extend their April rally. The daily bars in Chart 1 show the S&P 500 climbing 2.6% on Friday to close just above its 50-day average at 2863; and slightly above its late February broken...
READ MORE
MEMBERS ONLY

STOCKS OFF TO A STRONG START -- WITH ENERGY, FINANCIALS, INDUSTRIALS, AND MATERIALS LEADING IT HIGHER -- GOLD IS EXPERIENCING SOME PROFIT-TAKING
by John Murphy,
Chief Technical Analyst, StockCharts.com
STOCK INDEXES TEST SOME MOVING AVERAGE LINES... Today's strong price action suggests that stock indexes are trying to extend their April rebound. All major stocks got off to strong start. Chart 1 shows the Dow Industrials rising more than 2% today and nearing a test of its 50-day...
READ MORE
MEMBERS ONLY

A Rising Gold Market Says It May Soon Be Time to Cover Those Commodity Shorts
by Martin Pring,
President, Pring Research
History tells us that, at major turning points for commodities, there is a strong, albeit imprecise, tendency for the gold price to have preceded that reversal. Gold generally leads because a rising price anticipates inflation, while a falling one anticipates deflation. This idea is represented by the rightward sloping solid...
READ MORE
MEMBERS ONLY

STOCKS SELL OFF ON WEAK ECONOMIC NEWS -- BANKS DROP ON WEAK EARNINGS -- ENERGY AND FINANCIALS ARE DAY'S WEAKEST SECTORS
by John Murphy,
Chief Technical Analyst, StockCharts.com
WEAK ECONOMIC DATA CAUSES PROFIT-TAKING IN STOCKS... A lot of weak economic reports today are causing profit-taking in stock prices. Weak bank earnings are making that group one of the day's weakest. A 10 basis point drop by the 10-year Treasury yield to 0.64% may also be...
READ MORE
MEMBERS ONLY

GOLD REACHES HIGHEST LEVEL IN SEVEN YEARS -- WHILE ITS MINERS MAY ALSO BE BREAKING OUT -- GOLD MINERS ETF IS ALSO SHOWING RELATIVE STRENGTH AGAINST THE METAL AND STOCK MARKET
by John Murphy,
Chief Technical Analyst, StockCharts.com
GOLD REACHES SEVEN-YEAR HIGH... Gold seems to have everything moving in its favor. Low global interest rates, a softer dollar, and fears of global economic recession. And most of all, a bullish chart pattern both for the yellow metal and its miners. A lot of bullish articles on gold have...
READ MORE
MEMBERS ONLY

Are We On the Eve of Destruction?
by Larry Williams,
Veteran Investor and Author
On this special episode of Real Trading with Larry Williams, Larry addresses the impact the virus has had on the economy and the markets. Where does he see things going from here? Are we looking at a continued bear market or a bull move to the upside? Watch to find...
READ MORE
MEMBERS ONLY
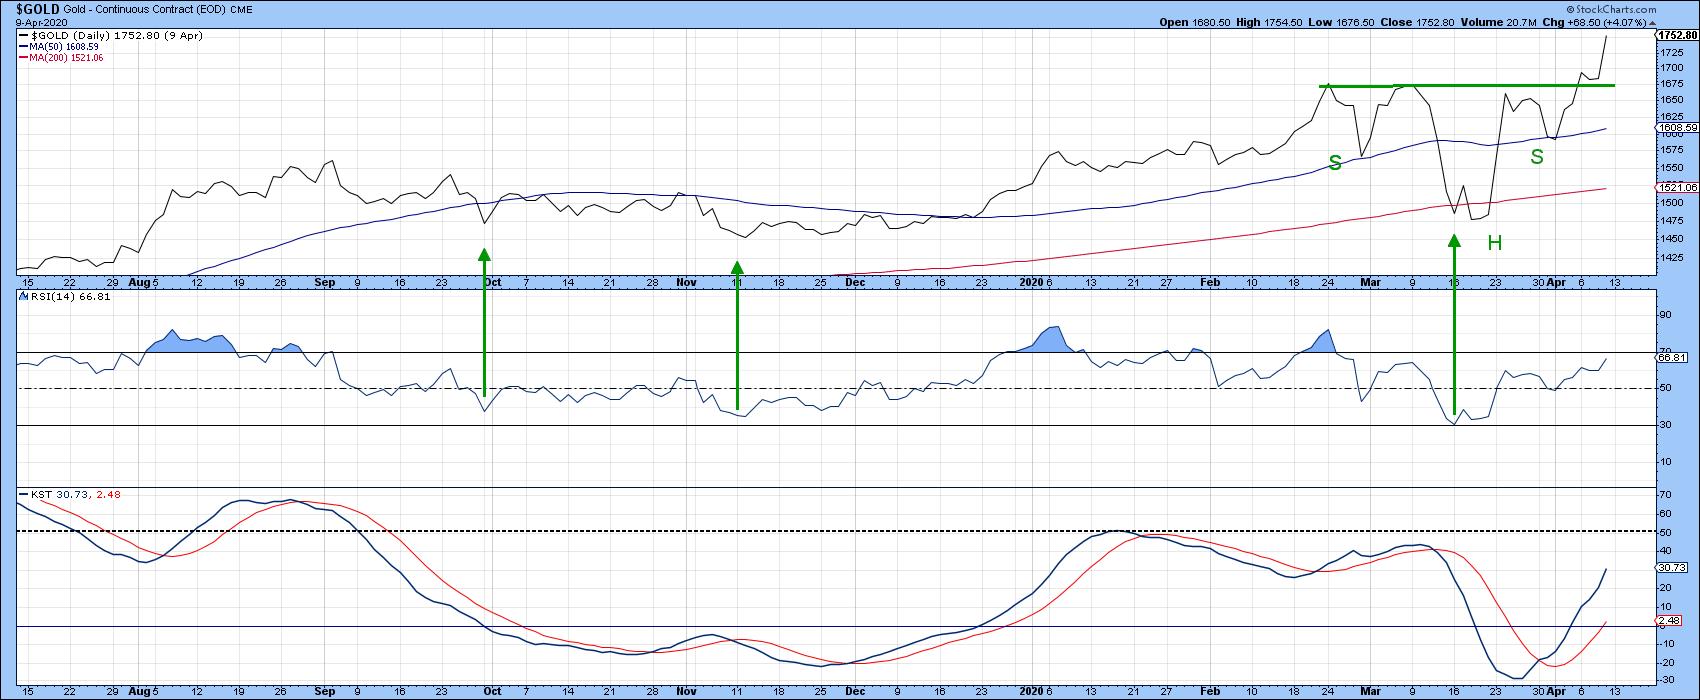
Gold is Breaking to the Upside - What Does That Mean for the Stock Market?
by Martin Pring,
President, Pring Research
Chart 1 shows that last week, based on daily data, the gold price quietly broke out from a reverse head-and-shoulders pattern. It's certainly a little overstretched on a short-term basis and may need to pause for a couple of sessions or so, but the longer-term indicators are pointing...
READ MORE
MEMBERS ONLY

WEEKLY AND MONTHLY CHARTS SHOW IMPROVEMENT -- BUT IDENTIFY POTENTIAL OVERHEAD RESISTANCE -- THE STAYING POWER OF THE CURRENT STOCK REBOUND MAY SOON BE TESTED
by John Murphy,
Chief Technical Analyst, StockCharts.com
POTENTIAL OVERHEAD RESISTANCE ON WEEKLY CHART... Stock prices are trading higher again today following a Fed injection of $2.3 trillion dollars into the economy. The question is how far can the rally carry, and are there still risks on the downside. For that, we're going to look...
READ MORE
MEMBERS ONLY

Tuesday's Bearish Key Reversals May Have Trouble Working
by Martin Pring,
President, Pring Research
Whenever a specific technical event is repeated widely in many different stocks, it gets my attention, as it often signals a reversal in the prevailing trend. We call it the principle of commonality. Alternatively, you could think of it as the principle of strength in numbers.
Tuesday's Action...
READ MORE
MEMBERS ONLY

STOCKS GAIN MORE GROUND -- DOW AND S&P 500 MAY TEST 50% RETRACEMENT LINES -- THE QQQ IS TRYING AGAIN TO CLEAR ITS 200-DAY LINE -- ALL SECTORS ARE UP WITH REAL ESTATE, ENERGY, UTILITIES, MATERIALS, AND FINANCIALS LEADING
by John Murphy,
Chief Technical Analyst, StockCharts.com
STOCKS REGAIN UPSIDE MOMENTUM... Stocks are gaining ground today following yesterday's late selloff. Chart 1 shows the Dow Industrials gaining 3% today. Today's price gain has kept the Dow above its lower 38% Fibonnaci retracement line; and may be signalling a test of its 50% retracement...
READ MORE
MEMBERS ONLY

TECH SPDR FALLS BACK BELOW ITS 200-DAY AVERAGE -- SO DO THE QQQ AND SEMICONDUCTOR ISHARES -- LATE STOCK SELLING MIGHT SIGNAL MORE TO COME
by John Murphy,
Chief Technical Analyst, StockCharts.com
NASDAQ 100 QQQ CLOSES BELOW 200-DAY LINE...Today's two earlier messages focused on three technology-dominated ETFs that were trying to clear their 200-day averages. All three failed that initial test by closing lower today. Chart 1 shows the Invesco QQQ Trust giving up its earlier gains and ending...
READ MORE
MEMBERS ONLY

NASDAQ 100 QQQ TRADING ABOVE ITS 200-DAY LINE -- AMAZON, INTEL, AND MICROSOFT HELP LEAD IT HIGHER
by John Murphy,
Chief Technical Analyst, StockCharts.com
QQQ TRADES ABOVE 200-DAY LINE...This morning's message showed the Technology SPDR (XLK) and Semiconductor iShares (SOXX) testing their 200-day moving averages. This message focuses on the Nasdaq 100 QQQ which is also trying to clear its 200-day line. Chart 1 shows the Invesco QQQ Trust trading above...
READ MORE
MEMBERS ONLY

MAJOR STOCK INDEXES CLEAR LATE-MARCH HIGH -- ALL SECTORS ARE IN THE GREEN -- ENERGY AND MATERIALS ARE LEADING -- TECH SPDR IS TESTING ITS 200-DAY AVERAGE -- SO ARE SEMICONDUCTORS
by John Murphy,
Chief Technical Analyst, StockCharts.com
STOCK INDEXES CLEAR LATE-MARCH HIGH...The stock market is building on yesterday's strong gain to improve its short- to intermediate trend picture. The daily bars in Chart 1 show the S&P 500 rising above its late-March intra-day peak at 2641 after clearing its green 20-day average...
READ MORE