MEMBERS ONLY

STOCKS START WEEK ON THE UPSIDE -- ALL STOCK SECTORS ARE GAINING -- BIOTECHS LEAD HEALTHCARE HIGHER -- TREASURY YIELD BOUNCES AS TREASURIES DIP -- CORPORATE BONDS ARE ACTING BETTER

by John Murphy,
Chief Technical Analyst, StockCharts.com
S&P 500 MAY BE HEADED FOR TEST OF LATE-MARCH HIGH...Global stocks are starting the week higher. The daily bars in Chart 1, for example, show the S&P 500 gapping higher this morning and clearing its green 2o-day average. The green circle shows the SPX leaving...
READ MORE
MEMBERS ONLY

MAJOR STOCK INDEXES ARE TRYING TO STABILIZE -- LONG-TERM CHARTS, HOWEVER, REMAIN A CONCERN -- WEEKLY AND MONTHY CHARTS OF THE S&P 500 SUGGEST CONTINUED STOCK MARKET RISK
by John Murphy,
Chief Technical Analyst, StockCharts.com
DAILY S&P 500 CHART CONTINUES TO STABILIZE...Major U.S. stock indexes continue to probe for a short-term bottom. The daily bars in Chart 1 show the S&P 500 regaining some lost ground over the last two weeks after falling to the lowest level in three...
READ MORE
MEMBERS ONLY

Is It Nineteen Twenty-Nine or Nineteen Eighty-Seven? Which Sectors are Out-Perfoming?

by Martin Pring,
President, Pring Research
In my monthly Intermarket Review this month, I pointed out that, using a 6-week ROC for perspective, the DJIA dropped by 36% on March 20 -before then, there had only been two other instances where the market had fallen by a similar amount from an all-time-high. Based on the DJIA...
READ MORE
MEMBERS ONLY

Can the Fed Stop the Bear?

by Larry Williams,
Veteran Investor and Author
On this special episode of Real Trading with Larry Williams, Larry presents an in-depth discussion of the Federal Reserve System. In addition to walking you through the history of the Fed and describing its primary functions, Larry shares how and why he changed his stance from anti-Fed to a strong...
READ MORE
MEMBERS ONLY

Lots of Short-Term Indicators Reversing from Bearish Extremes - What Does It Mean? (UPDATED)
by Martin Pring,
President, Pring Research
Editor's Note: This is an expansion of a previous Market Roundup article written on Tuesday, March 24th, now with updated charts and commentary. For the original article, click here.
I wrote earlier in the week that, whenever the market rallies by 8-9%, it's obvious that some...
READ MORE
MEMBERS ONLY

Lots of Short-Term Indicators Reversing from Bearish Extremes - What Does It Mean?
by Martin Pring,
President, Pring Research
* Indicators Start to Flash Buy Signals
* What Happened in the 1929-32 Bear Market?
* Longer-Term Perspective
Whenever the market rallies by 8-9%, it's obvious that some form of bottom has taken place (however fleeting), so I don't want to state the obvious. It is apparent, though, that...
READ MORE
MEMBERS ONLY

DOW BREAKS 2018 LOW AND SIGNALS LOWER PRICES -- THE S&P 500 IS TESTING SUPPORT LINES
by John Murphy,
Chief Technical Analyst, StockCharts.com
LOWER TARGET FOR THE DOW... My weekend message showed the Dow Industrials testing important chart support along its late 2018 low. The weekly bars in Chart 1 show the Dow falling below that important support line this week. That raises the likelihood of even lower prices. The question is how...
READ MORE
MEMBERS ONLY

Bullish at a Time of Extreme Panic
by Larry Williams,
Veteran Investor and Author
On this special episode of Real Trading with Larry Williams, Larry explains why he believes the bull is about to roar back and put the bears to sleep. Based on nearly 60 years of market analysis and trading experience, Larry showcases the charts and indicators he's watching most...
READ MORE
MEMBERS ONLY

THE DOW TESTS MAJOR LONG-TERM SUPPORT LINES -- BUT ANY REBOUND COULD MEET WITH NEW SELLING -- A BEAR MARKET HAS LIKELY BEGUN -- THE QUESTION IS HOW LONG AND HOW DEEP
by John Murphy,
Chief Technical Analyst, StockCharts.com
DOW DROPS INTO BEAR TERRITORY... Friday's strong rebound helped prevent a very bad week in stocks from getting worse. And it came at a good time. That's because of number of U.S. stock indexes are nearing tests of major long-term support lines. We'll...
READ MORE
MEMBERS ONLY

Is the State of Emergency a Sign of a Bottom?
by Martin Pring,
President, Pring Research
This week has seen U.S. administration fiscal proposals, as well as 1.5 trillion dollars in Fed support, aimed at limiting the economic damage from COVID-19. Friday saw a travel ban put into effect, along with a state of emergency. Unfortunately, these actions, just like the previous week'...
READ MORE
MEMBERS ONLY

GLOBAL STOCKS ENTER BEAR MARKET -- FOREIGN STOCKS BREAK LONG-TERM SUPPORT LEVELS -- S&P 500 HEADING TOWARD SOME TESTS OF ITS OWN
by John Murphy,
Chief Technical Analyst, StockCharts.com
WORLD STOCK INDEX NEARS TEST OF LONG-TERM SUPPORT...The Dow Industrials entered a bear market yesterday when it closed more than -20% off its recent high. Another big global selloff today has put the world's stocks in a bear market as well. Which suggests that stocks in the...
READ MORE
MEMBERS ONLY

Safe Havens Look Like They are Reversing; Stock Market Still Searching for a Low
by Martin Pring,
President, Pring Research
* Bonds and Yen Starting to Lose Safety Appeal?
* One Indicator That Has Returned to Financial Crisis Levels
Bonds and Yen Starting to Lose Safety Appeal?
The stock market has got the majority of the attention in the last couple of weeks because of its exceptional volatility. On the other hand,...
READ MORE
MEMBERS ONLY
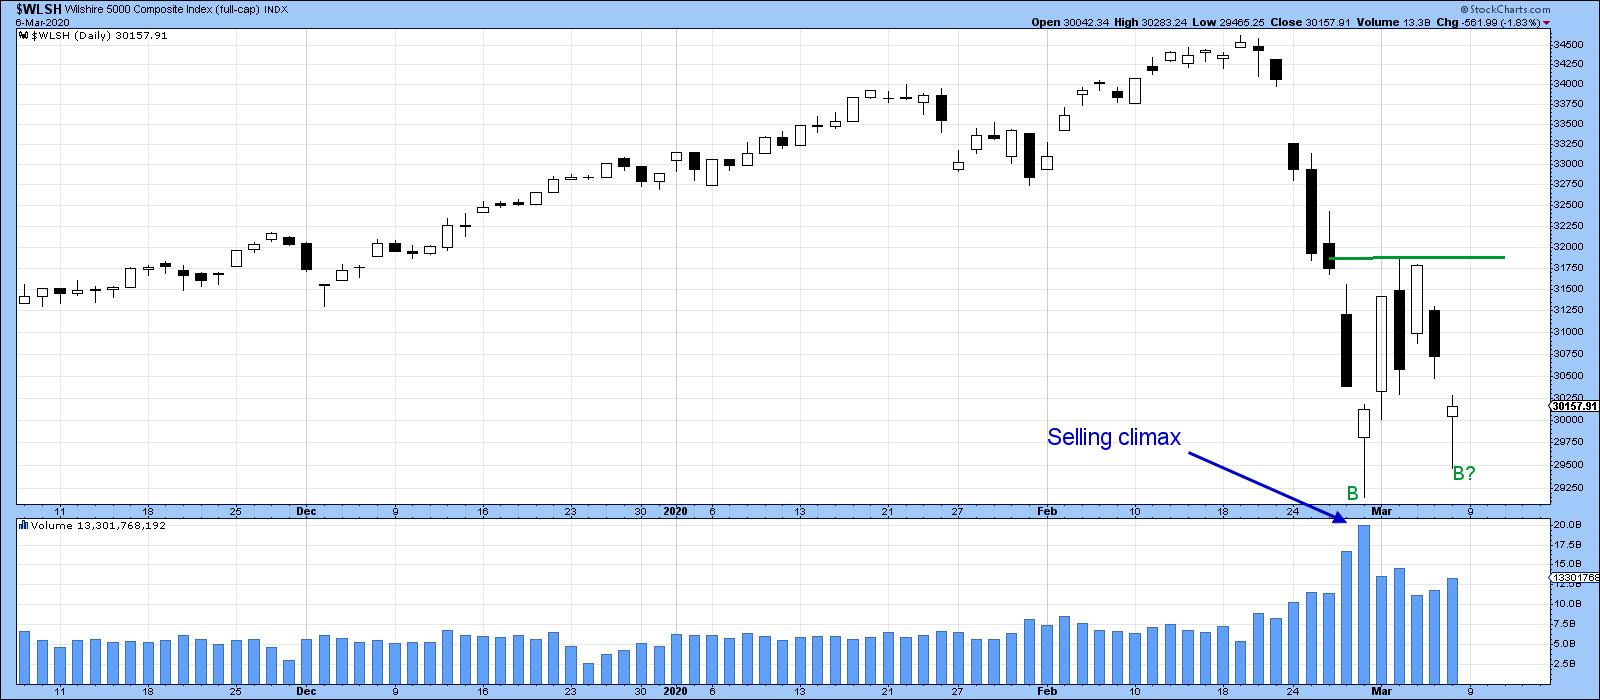
Market Tries to Hammer Out a Bottom As COVID-19 Tries to Hammer Out a Top
by Martin Pring,
President, Pring Research
* Revisiting the February 29 Hammer
* Hammering a Top for COVID-19
Revisiting the February 29 Hammer
On Friday, 29 February, I pointed out that the Wilshire 5,000 had formed a bullish hammer at a time when a couple of other short-term indicators had reached extreme levels, thereby suggesting a rally....
READ MORE
MEMBERS ONLY

RETEST OF RECENT LOWS TAKING PLACE -- FRIDAY'S LATE REBOUND IS MILDLY ENCOURAGING -- BUT MONTHLY INDICATORS WARN OF POSSIBLE TOP
by John Murphy,
Chief Technical Analyst, StockCharts.com
NASDAQ HOLDS 200-DAY LINE... Let's start with some good news. Heading into the close yesterday afternoon (Friday), stocks were under heavy selling pressure. And the Nasdaq Composite Index was in danger of closing below its 200-day moving average for the first time since last spring. A late stock...
READ MORE
MEMBERS ONLY

STOCK INDEXES HEADED FOR RETEST OF RECENT LOW -- NASDAQ THREATENING ITS 200-DAY AVERAGE
by John Murphy,
Chief Technical Analyst, StockCharts.com
RETEST OF LAST WEEK'S LOWS APPEARS LIKELY... Another day of heavy selling has marked the end of this week's rebound, and a likely retest of last week's lows. Another plunge in bond yields to record lows and a 10% plunge in the price of...
READ MORE
MEMBERS ONLY

FALLING BOND YIELDS PUSH BANK INDEX TO NEW LOW -- AIRLINE INDEX FALLS TO THREE YEAR LOW -- CRUISE, GAMBLING, AND HOTELS CONTINUE TO SLIDE -- TODAY'S STOCK SELLING THREATENS REBOUND
by John Murphy,
Chief Technical Analyst, StockCharts.com
BANKS AND AIRLINES HIT NEW LOWS... Another record low in bond yields and a continuing flight to the safety of bonds (and gold) are helping put stock prices under heavy selling pressure today. The biggest sector losers are financials, energy, industrials, and cyclicals. It's not hard to understand...
READ MORE
MEMBERS ONLY

"Bull in a China Shop" Revisited, Plus Some Interesting Chinese ETFs
by Martin Pring,
President, Pring Research
* Shanghai is Outperforming the US
* Interesting Chinese Sectors
Shanghai is Outperforming the US
Back in early January, I drew your attention to the fact that the Shanghai Composite ($SSEC) had broken to the upside, which is shown in Chart 1. A week or so later, when the coronavirus reared its...
READ MORE
MEMBERS ONLY

SHORT-TERM STOCK REBOUND CONTINUES -- S&P 500 REGAINS 200-DAY LINE -- UPSIDE RESISTANCE LEVELS TO WATCH -- VIX FALLS BACK BELOW 40 -- TREASURY BOND ISHARES LOOK OVERBOUGHT
by John Murphy,
Chief Technical Analyst, StockCharts.com
SHORT-TERM STOCK REBOUND CONTINUES... Extremely oversold readings on daily charts at the end of last week, combined with chart support near the October low, increased odds for a rebound in stocks this week. Stocks are rebounding today after yesterday's selloff. And are building on gains that started on...
READ MORE
MEMBERS ONLY

DAILY OVERSOLD READINGS COULD SUPPORT REBOUND -- BUT WEEKLY RSI NOT YET OVERSOLD -- NEITHER IS THE % SPX STOCKS BELOW 200-DAY LINE -- VIX INDEX REACHES POTENTIAL RESISTANCE AT 40
by John Murphy,
Chief Technical Analyst, StockCharts.com
VERY OVERSOLD BUT NO REBOUND YET... After this week's stock plunge, it's not surprising to see short-term momentum and sentiment indicators reach very oversold conditions. That doesn't guarantee a short-term bottom; but does increase the technical odds for one. And even if one does...
READ MORE
MEMBERS ONLY

VIX CLOSES AT HIGHEST LEVEL IN TWO YEARS -- S&P 500 FALLS BELOW ITS 200-DAY AVERAGE --- FIVE MORE SECTORS FELL BELOW THEIR 200-DAY LINES -- THAT PUTS EIGHT SECTORS IN DOWNTRENDS
by John Murphy,
Chief Technical Analyst, StockCharts.com
VIX CLOSES AT HIGHEST LEVEL IN TWO YEARS... Stocks sold off hard again today with more 200-day moving averages being broken. The inability of stock indexes to offer any buying near those long-term support lines is a very discouraging sign. So was today's large jump in the CBOE...
READ MORE
MEMBERS ONLY

NO SIGN OF A BOTTOM YET AS EARLY BOUNCE FADES -- SELLOFF IN TRANSPORTS AND SMALL CAPS DEEPENS -- TWO SECTOR SPDRS THREATEN 200-DAY AVERAGES -- WHILE ANOTHER ONE SLIPPED BELOW ITS RED LINE -- SPX MAY BE HEADED TOWARD ITS 200-DAY LINE
by John Murphy,
Chief Technical Analyst, StockCharts.com
S&P 500 APPEARS HEADED TOWARD 200-DAY AVERAGE... An early rebound attempt faded today and the Dow and S&P 500 ended the day lower. Only the Nasdaq managed to hold onto a small gain. The Dow Industrials closed below their 200-day average for the second day in...
READ MORE
MEMBERS ONLY

The Correction May Well Extend, But Some Green Shoots are Starting to Appear
by Martin Pring,
President, Pring Research
* Some Signs of Weakness
* On a More Bullish Note
* Mind that Gap and Volatility
Last time I wrote about the stock market was the first week in February, where I concluded that a couple of indicators were oversold, but that many others were not, so further corrective action probably lay...
READ MORE
MEMBERS ONLY

STOCK CORRECTION DEEPENS -- NASDAQ AND S&P 500 BREAK JANUARY LOWS -- DOW FALLS BELOW 200-DAY LINE -- SO DO BANKS, MATERIALS, SMALL CAPS, AND TRANSPORTS -- 10-YEAR TREASURY FALLS TO RECORD LOW
by John Murphy,
Chief Technical Analyst, StockCharts.com
MARKET ROUT CONTINUES... Stocks tumbled for the second day in a row and in heavy trading once again. And important support levels are being broken. The S&P 500 and Nasdaq fell below their January lows today and further below their 50-day averages in pretty decisive fashion. Charts 1...
READ MORE
MEMBERS ONLY

GLOBAL STOCKS TUMBLE ON CORONAVIRUS SPREAD -- 10-YEAR YIELD FALLS TO NEARLY FOUR-YEAR LOW -- ENERGY, TECH, AND CYCLICALS LEAD THE DECLINE -- SOME SUPPORT LEVELS HAVE BEEN BROKEN -- VIX SURGES TO HIGHEST LEVEL IN A YEAR
by John Murphy,
Chief Technical Analyst, StockCharts.com
GLOBAL STOCKS PLUNGE ON CORONAVIRUS SPREAD... Recent technical warnings that global stocks were vulnerable to more selling became a harsh reality today. And in a big way. Global stocks fell the most in nearly a year. Selling started in Asia and Europe before spreading to the states. And a lot...
READ MORE
MEMBERS ONLY

GLOBAL STOCK INDEXES LOOK VULNERABLE -- THAT INCLUDES AN OVERBOUGHT S&P 500 -- EAFE ISHARES BACKING OFF FROM 2018 HIGH -- EMERGING MARKETS LOOKING THE WEAKEST -- % S&P 500 STOCKS ABOVE 50-DAY AVERAGE WEAKENS
by John Murphy,
Chief Technical Analyst, StockCharts.com
GLOBAL STOCKS LOOK OVER-EXTENDED AND VULNERABLE... A number of recent messages have shown charts suggesting that the U.S. stock market looks overbought on the upside and vulnerable to some profit-taking. Not necessarily a major top, but a correction of some sort. Foreign stocks look even more vulnerable. And what...
READ MORE
MEMBERS ONLY

GOLD MINERS ETF NEARS UPSIDE BREAKOUT -- SEMICONDUCTERS LEAD TECH SECTOR LOWER -- FRIDAY'S SELLING SUGGESTS THAT OVERBOUGHT STOCK PULLBACK HAS PROBABY BEGUN
by John Murphy,
Chief Technical Analyst, StockCharts.com
GOLD MINERS ETF NEARS UPSIDE BREAKOUT... With gold surging again today to another seven-year high, gold miners are having an even stronger day percentage-wise. And are nearing a major upside breakout. Chart 1 shows the VanEck Gold Miners ETF (GDX) trading 3% higher today and nearing a challenge of its...
READ MORE
MEMBERS ONLY

DOLLAR SURGES TO NEARLY THREE-YEAR HIGH -- PLUNGING YEN HURTS JAPAN ISHARES -- WEAK EM CURRENCIES HURT EEM ISHARES --U.S. STOCKS LOOK VULNERABLE TO SOME PROFIT-TAKING
by John Murphy,
Chief Technical Analyst, StockCharts.com
U.S. DOLLAR INDEX BREAKS OUT TO THE UPSIDE... The strong rally that started in the dollar in January passed another technical milestone this week. The daily bars in Chart 1 show the U.S. Dollar Index rising above its September/October peaks in yesterday's trading to reach...
READ MORE
MEMBERS ONLY

Low Bond Yields May Not Be Around Much Longer
by Martin Pring,
President, Pring Research
* Secular Trend for the 20-Year Yield
* Lower Down Curve Yields Are Already in a Secular Bull
* Short-Term Oscillators Ready for Some Upside Action?
The coronavirus has triggered concerns about the recovery, which in turn has resulted in a sharp setback for yields. Falling yields are bullish for housing starts, which,...
READ MORE
MEMBERS ONLY

GOLD REACHES SEVEN-YEAR HIGH -- GOLD MINERS ARE ALSO TURNING UP -- NEWMONT GOLDCORP EXCEEDS 2016 HIGH -- BARRICK GOLD REACHES FOUR-YEAR HIGH
by John Murphy,
Chief Technical Analyst, StockCharts.com
GOLD RESUMES UPTREND... My weekend message explained why falling bond yields, and an over-extended stock market, might be two of the reasons that investors have been buying gold since the start of the year. And they're doing so in the face of a rising dollar. The message also...
READ MORE
MEMBERS ONLY

FALLING BOND YIELDS HAVE BEEN GIVING A BIG BOOST TO THE PRICE OF GOLD -- AND HELPED OFFSET IMPACT OF RISING DOLLAR
by John Murphy,
Chief Technical Analyst, StockCharts.com
RELATIONSHIP BETWEEN GOLD AND THE DOLLAR... Last weekend's message explained that one of the side-effects of a rising U.S dollar is weaker commodity prices. And that's been the case so far this year as a four-month high in the U.S. Dollar Index has pushed...
READ MORE
MEMBERS ONLY

LOWER YIELDS PUSH REITS AND UTILITIES TO RECORDS -- BANK SPDR MEETS SELLING AT 50-DAY LINE -- S&P 500 STILL LOOKS OVEREXTENDED -- WITH A SHORT-TERM NEGATIVE DIVERGENCE
by John Murphy,
Chief Technical Analyst, StockCharts.com
10-YEAR TREASURY YIELD CONTINUES TO WEAKEN... Treasury yields are down again today, and are losing some of the gains made over the last two weeks. The daily bars in Chart 1 show the 10-Year Treasury Yield losing 3 basis points today to 1.58%. The pennant-like shape of its sideways...
READ MORE
MEMBERS ONLY

Commodities Remain on a Knife Edge
by Martin Pring,
President, Pring Research
* Where Are We in the Cycle?
* The Economy is Currently on the Side of the Bulls
* The Technical Position of the DB Commodity ETF is Precarious
Where Are We in the Cycle?
Back in December, I wrote an articlepointing out that the business cycle was nothing more than a set...
READ MORE
MEMBERS ONLY

BUYING OF GAMBLING, HOTELS, AND CRUISE LINES IS A SIGN THAT CORONAVIRUS THREAT MAY BE PASSING -- AMERICAN AIRLINES LEADS AIRLINES HIGHER
by John Murphy,
Chief Technical Analyst, StockCharts.com
MARKETS LOOKING BEYOND CORONAVIRUS THREAT... Price action of the global financial markets over the past week strongly suggest that fears of the coronavirus are fading.Major U.S. stock indexes are trading at new records. Foreign stocks are being led higher by Asian emerging markets, with help from China. Crude...
READ MORE
MEMBERS ONLY

DOLLAR INDEX HAS A STRONG WEEK AS EURO FALLS -- GLOBAL INVESTORS ARE FAVORING U.S. ASSETS -- STRONGER $ WEAKENS COMMODITIES -- AND FOREIGN STOCK ETFS
by John Murphy,
Chief Technical Analyst, StockCharts.com
US DOLLAR INDEX TURNS UP... My Thursday message showed the Invesco US Dollar Index ETF (UUP) hitting a four month high and challenging its previous peak formed during October. It cleared that barrier on Friday. Chart 1, however, plots the US Dollar Index ($USD) which I prefer using to track...
READ MORE
MEMBERS ONLY

TRAVEL STOCKS UNDER PRESSURE AGAIN -- AIRLINES, GAMBLING STOCKS, AND CRUISE LINERS RETEST MOVING AVERAGE LINES -- PLAYING SOME DEFENSE GOING INTO WEEKEND
by John Murphy,
Chief Technical Analyst, StockCharts.com
TRAVEL STOCKS UNDER PRESSURE... My Tuesday message showed a number of travel and tourism stock groups with heavy exposure to China finding support near moving average lines; or regaining them. Today's message shows those same groups under pressure again today. Let's start with airlines. Chart 1...
READ MORE
MEMBERS ONLY

DOLLAR RALLIES TO A FOUR MONTH HIGH -- MOST MAJOR CURRENCIES ARE DROPPING -- THE EURO IS THREATENING CHART SUPPORT -- A STRONGER DOLLAR COULD SIGNAL GLOBAL INVESTORS ROTATING BACK INTO U.S. MARKETS -- BUT COULD BE NEGATIVE FOR COMMODITY PRICES
by John Murphy,
Chief Technical Analyst, StockCharts.com
DOLLAR INDEX NEARS TEST OF EARLY OCTOBER HIGH...While recent volatility in stocks, commodities, and bonds has received a lot of attention, currency trading has been relatively quiet. But that may be changing. Chart 1 shows the Invesco US Dollar Index (UUP) climbing this week to the highest level in...
READ MORE
MEMBERS ONLY

It's Still a Bull Market, But More Corrective Activity is Likely
by Martin Pring,
President, Pring Research
* Why the Correction Will Likely be Contained
* More Corrective Action Likely
* One Indicator Flashes a Buy Signal
* Conclusion
Why the Correction Will Likely be Contained
A couple of weeks ago, I wrote that a correction was inevitable, and presented a couple of indicators to suggest that it might be close....
READ MORE
MEMBERS ONLY

BIG JUMP IN ASIA BOOSTS GLOBAL STOCKS -- AIRLINES, CRUISE LINES, HOTELS, AND GAMING STOCKS ARE REGAINING MOVING AVERAGE SUPPORT -- COPPER STOCKS ARE ALSO FINDING SUPPORT -- DOW REGAINS ITS 50-DAY AVERAGE
by John Murphy,
Chief Technical Analyst, StockCharts.com
EMERGING ASIA LEADS GLOBAL STOCKS HIGHER...A strong rebound in Asia today is giving a big boost to global stocks. Emerging markets in Asia led the rest of the world lower over the last two weeks. And are leading it higher today. Chart 1 shows the MSCI Asia ex Japan...
READ MORE
MEMBERS ONLY

GLOBAL STOCKS WERE DUE FOR A PULLBACK -- THE CORONAVIRUS IN CHINA IS JUST THE CATALYST FOR AN OVERDUE GLOBAL CORRECTION
by John Murphy,
Chief Technical Analyst, StockCharts.com
GLOBAL STOCKS WERE ALREADY STRETCHED TOO FAR...The coronavirus outbreak in China has rattled global markets all over the world, and rightly so. Fears of an economic slowdown in the world's second biggest economy is something to be concerned about. And market reactions certainly suggest that investors are...
READ MORE
MEMBERS ONLY

CHINESE STOCKS LEAD EMERGING MARKETS LOWER -- THAT'S ALSO HURTING AUSTRALIAN MARKETS -- U.S. STOCKS REMAIN UNDER PRESSURE -- THE DOW IS THREATENING ITS 50-DAY AVERAGE
by John Murphy,
Chief Technical Analyst, StockCharts.com
DOW THREATENS 50-DAY MOVING AVERAGE...Global stocks remain under pressure. My last message on Wednesday suggested that the continuing drop in bond yields and economically-sensitive commodities put the mid-week stock rebound in doubt. That still remains the case, not just here in the states; but even more so in foreign...
READ MORE