MEMBERS ONLY

HEALTHCARE IS WEEK'S STRONGEST SECTOR -- PHARMA HAS BEEN A SECTOR LAGGARD -- BUT IS STARTING TO MOVE UP IN THE RANKINGS -- DOW JONES PHARMACEUTICALS INDEX IS RISING TO FIVE-MONTH HIGH -- PHARMA ISHARES ARE DOING THE SAME -- JNJ AND LLY MAY BE BREAKING OUT

by John Murphy,
Chief Technical Analyst, StockCharts.com
HEALTHCARE CONTINUES TO GET STRONGER... Last Friday's message wrote about healthcare stocks going from one of the market's weakest sectors to one of the strongest. During the first eleven months of the year, healthcare was the market's second weakest sector (with only energy doing...
READ MORE
MEMBERS ONLY

How to Trade News

by Larry Williams,
Veteran Investor and Author
On this episode of Real Trading with Larry Williams, Larry presents an update on his stock market forecast and talks about how to account for the news when making trading decisions. In addition, this video includes an analysis of coffee and coffee stocks and a discussion of developments on Wall...
READ MORE
MEMBERS ONLY

STOCKS PULL BACK ON TRADE NEWS -- STOCK INDEXES REMAIN OVERBOUGHT BUT STILL IN UPTRENDS -- RETAILERS WEIGH ON CONSUMER DISCRETIONARY SECTOR -- ENERGY STOCKS REBOUND WITH CRUDE OIL -- DROP IN BOND YIELDS BOOST DEFENSIVE STOCKS
by John Murphy,
Chief Technical Analyst, StockCharts.com
STOCK INDEXES PULL BACK FROM OVERBOUGHT TERRITORY... News that a "phase one" trade deal may not be reached this year is contributing to selling in stocks today. That and the fact that stocks have reached overbought territory and are probably due for some profit-taking anyway. In fact, several...
READ MORE
MEMBERS ONLY

STOCK INDEXES HIT NEW RECORDS -- HEALTHCARE, COMMUNICATION, INDUSTRIALS, AND TECHNOLOGY ALSO HIT RECORDS -- INTERNET STOCKS LEAD XLC HIGHER -- SURGE IN HEALTH INSURERS LEADS HEALTHCARE SPDR TO NEW RECORD -- UNITEDHEALTH IS ONE OF DAY'S LEADERS
by John Murphy,
Chief Technical Analyst, StockCharts.com
THREE MAJOR STOCK INDEXES HIT NEW RECORDS...Stocks are ending the week in record territory. The three charts below show the three major U.S. stock indexes closing at record highs on Friday. And the rally is pretty broad-based. Ten of the eleven market sectors gained on the day. Healthcare...
READ MORE
MEMBERS ONLY
US Stocks, Gold and Open Mic!
by Larry Williams,
Veteran Investor and Author
On this episode of Real Trading with Larry Williams, Larry presents his new Great Growth Stock, "Brad's Drink". He also gives his take on Disney (DIS), Copper (CPER), Lending Club (LC) and Bitcoin ($BTCUSD). This episode originally aired on November 14th, 2019.
New episodes of Real...
READ MORE
MEMBERS ONLY

STOCK INDEXES HOLD THEIR GAINS -- COMMUNICATION SERVICES SPDR NEARS RECORD HIGH -- GOOGLE, DISNEY, AND CHARTER COMMUNICATIONS HIT NEW RECORDS -- ENERGY SPDR MEETS SELLING AT 200-DAY LINE -- SO DOES CRUDE OIL AND DB COMMODITY INDEX
by John Murphy,
Chief Technical Analyst, StockCharts.com
MAJOR STOCK INDEXES HOLD THEIR GAINS... The first three charts below show the major stock indexes holding onto their November gains. All three remain above their July highs which should now provide support on any pullbacks. [Broken overhead resistance becomes new support. That's why the red horizontal trendlines...
READ MORE
MEMBERS ONLY

ECONOMICALLY-SENSITIVE STOCKS CONTINUE TO SHOW MARKET LEADERSHIP -- WHILE DEFENSIVE STOCKS FALL BEHIND -- MATERIALS ARE BEING LED HIGHER BY COPPER SHARES -- WHILE GOLD MINERS ARE LOSING GROUND -- DOW JONES NONFERROUS METALS INDEX TURNS UP
by John Murphy,
Chief Technical Analyst, StockCharts.com
WEEKLY SECTOR RANKINGS...Chart 1 lists the eleven stock market sectors in order of relative strength for the past week. There aren't any surprises there; but there is more confirmation of recent rotations within the stock market showing more confidence in the market and the global economy. Financials...
READ MORE
MEMBERS ONLY

COPPER AND GOLD HAVE BEEN TRENDING IN OPPOSITE DIRECTIONS FOR A YEAR -- BUT THEIR DIRECTION MAY BE CHANGING -- THE COPPER/GOLD RATIO IS BOUNCING OFF LONG-TERM SUPPORT -- RISING BOND YIELDS ALSO FAVOR COPPER OVER GOLD -- THAT'S A SIGN OF GROWING CONFIDENCE
by John Murphy,
Chief Technical Analyst, StockCharts.com
COPPER AND GOLD HAVE BEEN TRENDING IN OPPOSITE DIRECTIONS... A lot of recent intermarket rotations in global markets have started to show more optimism; along with a willingness to favor economically-sensitive and riskier assets at the expense of safe haven defensive ones. That has included the buying of stocks and...
READ MORE
MEMBERS ONLY
Bitcoin Forecast
by Larry Williams,
Veteran Investor and Author
On this episode ofReal Trading with Larry Williams, Larry discusses the best seasonal trades of the year for 6 stocks, presents a new Great Unknown Growth Stock and presents his forecast for Bitcoin ($BTCUSD). Additionally, Larry presents a new contest question and answer. This episode originally aired on November 7th,...
READ MORE
MEMBERS ONLY
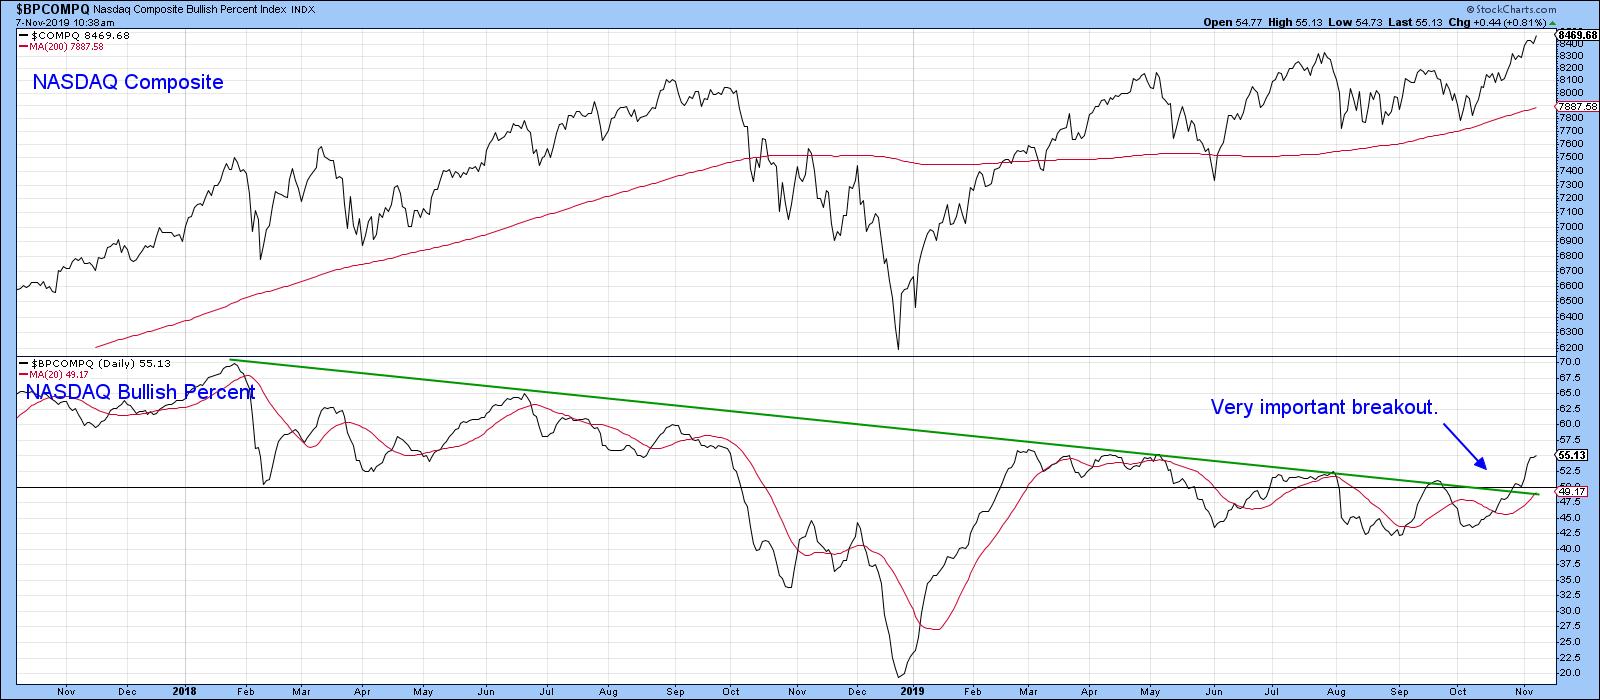
Two Recent Breakouts Say Equities Are Headed Significantly Higher In The Next Six Months

by Martin Pring,
President, Pring Research
* Two Meaningful Breakouts
* One Chart Still to Break Out
Back in mid-September, I wrote an article on US equitiesthat pointed out how several short-term indicators had reached extreme overbought levels, a sign of strong underlying momentum that historically had been followed by higher prices. However, since overbought conditions are typically...
READ MORE
MEMBERS ONLY

TRADE OPTIMISM PUSHES STOCK INDEXES FURTHER INTO RECORD TERRITORY -- SECTOR LEADERS ARE ENERGY, FINANCIALS, INDUSTRIALS, TECHNOLOGY, AND MATERIALS -- TEN-YEAR BOND YIELD TESTS SEPTEMBER HIGH AND PUSHES BOND PROXIES LOWER -- TRANSPORTS HIT 52-WEEK HIGHS
by John Murphy,
Chief Technical Analyst, StockCharts.com
STOCK INDEXES HIT NEW RECORDS... Optimism on trade between the U.S. and China is pushing risk assets higher and defensive ones lower. All three major U.S. stock indexes are hitting new records this morning. Chart 1 shows the S&P 500 in record territory. Eight sector SPDRs...
READ MORE
MEMBERS ONLY

HIGHER BOND YIELDS AND A STEEPER YIELD CURVE PROBABLY ACCOUNT FOR RECENT STOCK ROTATIONS INTO FINANCIALS AND CYCLICAL STOCKS -- THAT MAY ALSO EXPLAIN RECENT BUYING OF SMALL CAPS AND TRANSPORTS -- AND WHY FINANCIALS ARE THE PAST MONTH'S STRONGEST SECTOR
by John Murphy,
Chief Technical Analyst, StockCharts.com
HIGHER BOND YIELDS STARTED ROTATION INTO FINANCIALS AND INDUSTRIALS... My message from two weeks ago (October 25) suggested that the recent rise in bond yields and the steeper yield curve over the last two months may explain several rotations with the stock market. The main focus was on financials which...
READ MORE
MEMBERS ONLY

Martin Pring's Monthly Market Roundup 2019-11-03
by Martin Pring,
President, Pring Research
The monthly Market Roundup video for November is now available.
Good luck and good charting,
Martin J. Pring
The views expressed in this article are those of the author and do not necessarily reflect the position or opinion of Pring Turner Capital Group of Walnut Creek or its affiliates....
READ MORE
MEMBERS ONLY

DOW JOINS OTHER MAJOR STOCK INDEXES IN RECORD TERRITORY -- TRANSPORTATION STOCKS NEAR UPSIDE BREAKOUT -- SO DOES THE RUSSELL 2000 SMALL CAP ISHARES -- FINANCIAL SPDR HITS NEW RECORD -- WITH A LOT OF HELP FROM BANKS AND HIGHER BOND YIELDS
by John Murphy,
Chief Technical Analyst, StockCharts.com
DOW JOINS OTHER MAJOR INDEXES IN RECORD TERRITORY...Chart 1 shows the Dow Industrials trading above their July high to put them in record territory. The Nasdaq and S&P 500 hit new records last week. Financials and materials are hitting new records today as well. Other leaders include...
READ MORE
MEMBERS ONLY

NASDAQ JOINS S&P 500 IN RECORD TERRITORY -- HEALTHCARE AND TECHNOLOGY HIT NEW RECORDS -- FINANCIALS NEAR TEST OF EARLY 2018 HIGH -- INDUSTRIAL SPDR HITS NEW RECORD ON FRIDAY -- CATERPILLAR TURNS UP -- FOREIGN STOCK INDEX ACHIEVES BULLISH BREAKOUT
by John Murphy,
Chief Technical Analyst, StockCharts.com
NASDAQ AND S&P 500 END IN RECORD TERRITORY...A strong jobs report on Friday (two days after the Fed cut rates for the third time this year) sent stock prices sharply higher. Chart 1 shows the S&P 500 hitting a new high on Friday for the...
READ MORE
MEMBERS ONLY
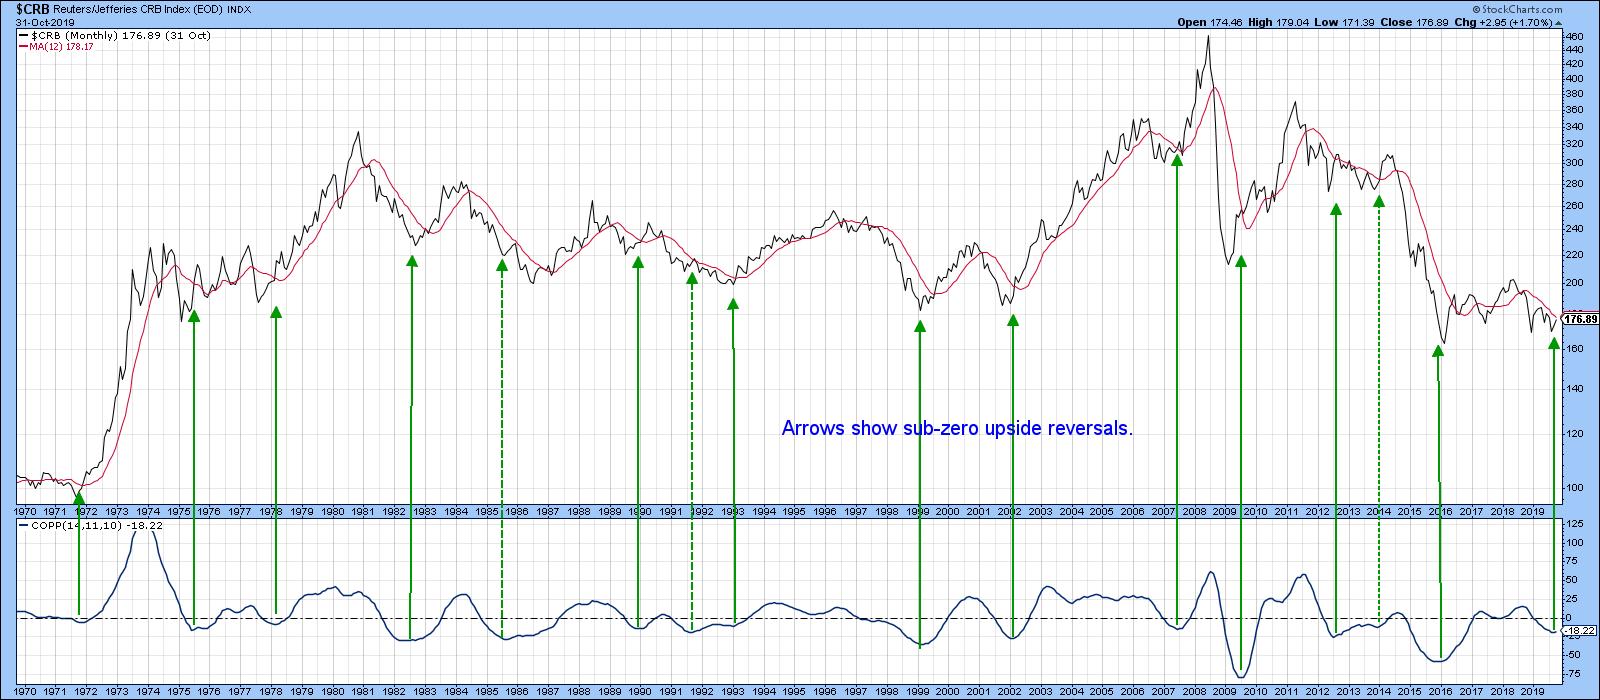
Stocks Have Broken Out; What About Commodities?
by Martin Pring,
President, Pring Research
* Commodities are in a Bear Market
* The Stock Market May Be on the Verge of Signaling a Commodity Rally
* Short-Term Commodity Momentum
At Pring Turner Capital, the registered investment advisory firm where I serve as investment strategist, our investment approachinvolves the proactive rotation of client's assets around the...
READ MORE
MEMBERS ONLY

STOCKS AND BONDS CLOSE HIGHER ON DOVISH RATE CUT -- S&P 500 CLOSES AT NEW RECORD -- FALLING BOND YIELDS BOOST DIVIDEND-PAYING STOCKS AS BANKS PULL BACK -- DROP IN DOLLAR AND LOWER YIELDS BOOST GOLD -- VOLATILITY INDEX DROPS TO THREE-MONTH LOW
by John Murphy,
Chief Technical Analyst, StockCharts.com
FED RATE CUT AND DOVISH MESSAGE BOOST STOCK PRICES...The Fed lowered rates another quarter point today as expected, which was followed by a dovish sounding message from Mr. Powell. That pushed stock prices higher. Chart 1 shows the S&P 500 closing at another record high today. Chart...
READ MORE
MEMBERS ONLY

HEALTH CARE SPDR NEARS RECORD HIGH -- XLV HAS GONE FROM MARKET LAGGARD TO LEADER IN LAST TWO MONTHS -- ALL GROUPS ARE PARTICIPATING -- STOCK LEADERS INCLUDE HCA HEALTHCARE, INCYTE, BECKTON DICKINSON, AND MERCK
by John Murphy,
Chief Technical Analyst, StockCharts.com
HEALTH CARE SPDR NEARS RECORD HIGH...In a remarkable turnaround, the healthcare sector has gone from one of the year's worst performers to one of the strongest over the last couple of months. Chart 1 shows the Health Care SPDR (XLV) trading above its early July intra-day peak...
READ MORE
MEMBERS ONLY

SECTOR RANKINGS SHOW MORE OPTIMISM -- ENERGY, TECHNOLOGY, INDUSTRIALS, FINANCIALS, AND MATERIALS LEAD MARKET HIGHER -- ALL WORLD STOCK ISHARES HIT NEW RECORD -- FOREIGN STOCK ISHARES ARE CLOSE TO AN UPSIDE BREAKOUT
by John Murphy,
Chief Technical Analyst, StockCharts.com
SECTOR LEADERS...Chart 1 shows the weekly ranking for the eleven stock market sectors.Nine of them closed up for the week with only two losers. That reflects a generally higher market with major stock indexes nearing new records. The rankings also reflect a generally upbeat mood on the market...
READ MORE
MEMBERS ONLY

FINANCIALS AND BANKS ACHIEVE BULLISH BREAKOUTS TO LEAD MARKET HIGHER -- A STEEPER YIELD CURVE MAY EXPLAIN RECENT ROTATION INTO FINANCIAL STOCKS
by John Murphy,
Chief Technical Analyst, StockCharts.com
STEEPER YIELD CURVE SUPPORTS STRONG FINANCIAL STOCKS...A lot of positive group rotations have taken place in the stock market over the past two months.We've seen new money moving into domestic small caps stocks, as well as economically-sensitive transports. We've also seen cheaper value stocks...
READ MORE
MEMBERS ONLY

PHLX SOX INDEX SHOWS TWO ASCENDING TRIANGLES -- THE TECHNOLOGY SPDR AND QQQ SHOW SIMILAR BULLISH PATTERNS -- THE QQQ/SPX RATIO IS ALSO TRIANGULATING BETWEEN ITS APRIL HIGH AND MAY LOW
by John Murphy,
Chief Technical Analyst, StockCharts.com
SEMICONDUCTOR INDEX IS FORMING TWO TRIANGLES... A lot has been written lately about the formation of triangular patterns. Here are couple more applied to the same group. Chart 1 shows the Philadelphia Semiconductor Index ($SOX) moving up to test its flat trendline drawn over its July/September/October highs. The...
READ MORE
MEMBERS ONLY

EQUAL WEIGHT S&P 500 ETF IS ALSO NEARING A TEST OF ITS SUMMER HIGH -- AN UPSIDE BREAKOUT BY BOTH VERSIONS OF THE S&P 500 WOULD BE A POSITIVE SIGN -- RISING SMALL AND MID CAP STOCKS ARE GIVING A BOOST TO THE RSP AND MAY BE SENDING A POSITIVE SIGNAL
by John Murphy,
Chief Technical Analyst, StockCharts.com
BOTH S&P 500 ETFS ARE NEARING OLD HIGHS...Chart 1 shows the S&P 500 SPDR (SPY) moving closer to a test of its July/September highs. It would take a close above its September intra-day high at 301.24 to put it at a record high....
READ MORE
MEMBERS ONLY

Global Indexes Just Below Major Breakout Points
by Martin Pring,
President, Pring Research
* The Dow Jones and MSCI World Stock Indexes/ETF Poised to Move Higher
* Rest of the World Emerging
* Europe, Japan and Emerging Markets Looking Positive
The Dow Jones and MSCI World Stock Indexes/ETF Poised to Move Higher
US indexes have rallied sharply in the last week, but so have...
READ MORE
MEMBERS ONLY

S&P 500 NEARS TEST OF OVERHEAD RESISTANCE -- TRANSPORTS ARE OFF TO A STRONG START -- FINANCIALS LEAD MARKET HIGHER -- BANK OF AMERICA MAY BE BREAKING OUT -- STATE STREET SURGES -- STRONG FINANCIALS MAY BE BOOSTING SMALL CAPS
by John Murphy,
Chief Technical Analyst, StockCharts.com
STOCK INDEXES NEAR OLD HIGH...Stocks around the world are trading higher this morning. Chart 1 shows the S&P 500 nearing a test of a trendline drawn over its July/September highs. All other major stock indexes are also trending higher. A big drop in Boeing (BA), however,...
READ MORE
MEMBERS ONLY

THE DOLLAR HAS FALLEN THIS WEEK AGAINST THE EURO AND POUND -- BOTH CURRENCIES HAVE RALLIED ON HOPES FOR BREXIT SETTLEMENT -- EUROPEAN STOCK ETFS HAVE ALSO BEEN RISING -- THOSE GAINS, HOWEVER, COULD DEPEND ON SATURDAY VOTE IN PARLIAMENT
by John Murphy,
Chief Technical Analyst, StockCharts.com
DOLLAR FALLS AGAINST EURO AND POUND...Chart 1 shows the Invesco US Dollar Index Fund (UUP) falling this week to the lowest level in two months. Most of that drop has come against the Euro and British Pound. Chart 2 shows the British Pound rising to the highest level in...
READ MORE
MEMBERS ONLY

HEALTH INSURERS AND DRUG DISTRIBUTORS PUT HEALTHCARE SPDR NEAR THREE-MONTH HIGH -- UNITEDHEALTH GROUP AND HUMANA CLEAR 200-DAY LINES -- AMERISOURCEBERGEN, CARDINAL HEALTH, AND MCKESSON ARE HAVING A VERY STRONG CHART WEEK
by John Murphy,
Chief Technical Analyst, StockCharts.com
HEALTHCARE CONTINUES STRONG WEEK...Healthcare is the day's strongest sector for the second time this week. Chart 1 shows the Health Care SPDR (XLV) trading above a falling trendline drawn over its July/September highs; and putting the XLV close to the highest level in nearly four months....
READ MORE
MEMBERS ONLY

British Pound Clears Its 200-day MA for an Initial Sign of a New Bull Market
by Martin Pring,
President, Pring Research
* Pound is in a Long-Term Secular Bear Market
* Crossing of the 200-Day Starts the Ball Rolling for a Primary Bull Market
* Pound Set to Break Against the Euro
Pound is in a Long-Term Secular Bear Market
Chart 1 shows that the British Pound has been in a secular bear market...
READ MORE
MEMBERS ONLY

FACEBOOK AND GOOGLE LEAD COMMUNICATIONS TO ONE OF DAY'S STRONGEST SECTORS -- BOUNCING BOND YIELDS ARE PUSHING TREASURY BOND PRICES LOWER -- BUT HIGH YIELD BONDS ARE RISING
by John Murphy,
Chief Technical Analyst, StockCharts.com
COMMUNICATIONS SPDR HAS STRONG DAY...While healthcare and financials have been leading for most of the day, communication stocks have crept into second place in afternoon trading. Chart 1 shows the Communication Services SPDR (XLC) bouncing impressively off its 50-day average that it cleared just last week. It's...
READ MORE
MEMBERS ONLY

MAJOR STOCK INDEXES BUILD ON LAST WEEK'S GAINS -- HEALTHCARE PROVIDERS LEAD HEALTHCARE SPDR HIGHER LED BY UNITEDHEALTH -- RECORD HIGH BY JP MORGAN CHASE LEADS BANKS AND FINANCIALS HIGHER -- FALLING VIX ALSO SUPPORTS HIGHER STOCK PRICES
by John Murphy,
Chief Technical Analyst, StockCharts.com
MAJOR STOCK INDEXES BUILD ON RECENT GAINS...After a modest pullback yesterday, major U.S. stock indexes are building on last week's trade-inspired gains. Chart 1 shows the Dow Industrials trading at the highest level of the month this morning. The Dow appears headed toward the top of...
READ MORE
MEMBERS ONLY

STOCKS SOAR ON EXPECTED PARTIAL TRADE ACCORD BETWEEN U.S. AND CHINA -- INDUSTRIAL MINING SHARES LEAD MATERIALS HIGHER -- INDUSTRIALS, ENERGY, AND FINANCIALS ALSO LEAD -- BRITISH POUND HAS BIGGEST GAIN IN YEARS ON POSSIBLE BREXIT BREAKTHROUGH
by John Murphy,
Chief Technical Analyst, StockCharts.com
STOCK INDEXES SOAR ON TRADE HOPES...Stocks around the world are jumping sharply today on reports of a partial trade deal reached between the U.S. and China. Chart 1 shows the S&P 500 surging to the highest level this month to put it well above its 50-day...
READ MORE
MEMBERS ONLY

TEN-YEAR TREASURY YIELD IS BOUNCING TODAY -- LONG-TERM CHARTS SHOW TNX IN A LONG-TERM SUPPORT ZONE AND VERY OVERSOLD -- HIGHER BOND YIELDS ARE BOOSTING BANKS AND FINANCIAL STOCKS
by John Murphy,
Chief Technical Analyst, StockCharts.com
TEN-YEAR BOND YIELD IS BOUNCING OFF CHART SUPPORT...Global bond yields are bouncing today. The daily bars in Chart 1 show the 10-Year Treasury Yield rising 6 basis points to 1.65%. What makes that meaningful is that the TNX bounce is taking place from just above the previous low...
READ MORE
MEMBERS ONLY

STOCK INDEXES FLUCTUATE BETWEEN MOVING AVERAGE LINES AS TRADING RANGE CONTINUES -- TECH SECTOR SHOWS UPSIDE LEADERSHIP -- APPLIED MATERIALS AND LAM RESEARCH LEAD CHIPS HIGHER -- FINANCIALS NEED A BOOST FROM BOND YIELDS
by John Murphy,
Chief Technical Analyst, StockCharts.com
STOCK INDEXES REMAIN IN TRADING RANGE...The three major U.S. stock indexes shown below remain in a sideways trading range between their 50-day moving averages on top and 200-day lines below. And they continue to trade between their July highs and August lows. While the short-term picture remains indecisive,...
READ MORE
MEMBERS ONLY
More Range-Bound Activity Ahead For US Equities?
by Martin Pring,
President, Pring Research
* Short-Term Indicators Behave Differently in Bull and Bear Markets
* Three Charts to Watch for a Potential Bearish Scenario
Short-Term Indicators Behave Differently in Bull and Bear Markets
Short-term oscillators behave differently depending on the direction of the primary trend. In bull markets, prices are very sensitive to oversold conditions and...
READ MORE
MEMBERS ONLY

STOCK INDEXES TRY TO REGAIN 50-DAY AVERAGES -- THE NASDAQ 100 QQQ HAS ALREADY CLEARED ITS BLUE LINE -- SO HAS THE TECH SPDR WHICH IS LEADING STOCKS HIGHER TODAY -- APPLE NEARS NEW RECORD HIGH
by John Murphy,
Chief Technical Analyst, StockCharts.com
STOCKS BUILD ON YESTERDAY'S REBOUND OFF THEIR 200-DAY AVERAGES... Stock prices are continuing the rebound that began with yesterday's upside reversal off their 200-day moving averages. And they're now trying to clear some overhead resistance. Chart 1 shows the Dow Industrials entering an overhead...
READ MORE
MEMBERS ONLY

STOCKS INDEXES SCORE UPSIDE REVERSAL NEAR AUGUST LOWS AND 200-DAY LINES -- TECHNOLOGY STOCKS LEAD NASDAQ REBOUND -- ALL ELEVEN SECTORS GAIN -- BUT STOCK INDEXES NEED MORE UPSIDE FOLLOW-THROUGH TO BUILD ON TODAY'S SUCCESSFUL TEST OF SUPPORT
by John Murphy,
Chief Technical Analyst, StockCharts.com
MAJOR STOCK INDEXES BOUNCE OFF CHART SUPPORT... After trading sharply lower today, stocks reversed upward to score a potential upside reversal day. And they did it at some critical support levels. Chart 1 shows the Dow Industrials bouncing off their 200-day moving average and chart support near their August lows....
READ MORE
MEMBERS ONLY
Martin Pring's Monthly Market Roundup 2019-10-02
by Martin Pring,
President, Pring Research
The monthly Market Roundup video for October is now available.
Good luck and good charting,
Martin J. Pring
The views expressed in this article are those of the author and do not necessarily reflect the position or opinion of Pring Turner Capital Group of Walnut Creek or its affiliates....
READ MORE
MEMBERS ONLY

STOCK SELLING INTENSIFIES -- 50-DAY MOVING AVERAGES ARE BEING BROKEN -- A TEST OF SUMMER LOWS NOW APPEARS LIKELY
by John Murphy,
Chief Technical Analyst, StockCharts.com
MAJOR STOCK INDEXES MAY BE HEADED FOR TEST OF SUMMER LOWS...Stock prices are undergoing more short-term technical damage. All three major stock indexes shown below have fallen decisively below their 50-day averages. Which raises the likelihood for a test of their August lows, and 200-day moving averages (red arrows)...
READ MORE
MEMBERS ONLY

STOCKS TURN LOWER ON WEAK MANUFACTURING DATA -- MAJOR STOCK INDEXES WEAKEN -- WEAKEST SECTORS ARE INDUSTRIALS, MATERIALS, ENERGY, AND FINANCIALS -- TRANSPORTS FALL BELOW 200-DAY LINE -- SO DOES RUSSELL 2000 -- ONLINE BROKERS TUMBLE
by John Murphy,
Chief Technical Analyst, StockCharts.com
STOCK INDEXES ARE UNDER HEAVY SELLING PRESSURE...The weakest U.S. manufacturing number in ten years turned an early stock rebound into a bout of heavy selling. And the short-term stock picture continues to weaken. Chart 1 shows the Nasdaq Composite Index failing an early attempt to regain its 50-day...
READ MORE
MEMBERS ONLY

STOCK INDEXES PULL BACK FURTHER FROM SUMMER HIGH -- NASDAQ CONTINUES TO LOSE LEADERSHIP ROLE AS TECHNOLOGY SECTOR WEAKENS -- INTERNET STOCKS PULL COMMUNICATION SECTOR LOWER -- SELLING OF CHINESE STOCKS WAS A FACTOR -- BUT FACEBOOK ALSO HAD A BAD WEEK
by John Murphy,
Chief Technical Analyst, StockCharts.com
NASDAQ ENDS BELOW ITS 50-DAY AVERAGE...While the three major U.S. stock indexes pulled back further from their July high, the Nasdaq was by far the weakest performer. Chart 1 shows the Nasdaq Composite Index ending the week well below its 50-day moving average (blue line). In addition, its...
READ MORE
MEMBERS ONLY

HEAVY SELLING IN COMMUNICATION AND TECHNOLOGY STOCKS PUSH NASDAQ SHARPLY LOWER -- INTERNET AND SEMICONDUCTORS LEAD THE SELLING -- SO DO CHINESE STOCKS ON THREAT OF DE-LISTING
by John Murphy,
Chief Technical Analyst, StockCharts.com
NASDAQ COMPOSITE FALLS FURTHER BELOW ITS 50-DAY LINE... Chart 1 shows the Nasdaq Composite falling sharply today and moving further below its 50-day moving average. Selling in software and semiconductors are leading the decline in the technology sector. Communication stocks are also having a bad day. Chart 2 shows the...
READ MORE