MEMBERS ONLY

STOCKS ARE ENDING WEEK AND QUARTER ON A FIRM NOTE -- ALL THREE MAJOR STOCK INDEXES HAVE KEPT THEIR 2019 UPTRENDS INTACT -- THE DOW TRANSPORTS MAY MAKE ANOTHER RUN AT THEIR 200-DAY LINE

by John Murphy,
Chief Technical Analyst, StockCharts.com
MAJOR STOCK INDEXES MAINTAIN THEIR 2019 UPTRENDS ... Major U.S. stock indexes appear on track to end the week and quarter with their 2019 uptrends intact. Chart 1 shows the Dow Industrials in a sideways trading pattern over the last month. This week's pullback bounced off its (blue)...
READ MORE
MEMBERS ONLY

DROP IN BOND YIELDS HERE AND IN GERMANY WEIGH ON STOCKS -- MAJOR STOCK INDEXES MAY RETEST THEIR 200-DAY AVERAGES -- THE BOND/STOCK RATIO IS RISING AGAIN WHICH SUGGESTS THAT INVESTORS ARE HEDGING THEIR BETS ON A STRONGER ECONOMY
by John Murphy,
Chief Technical Analyst, StockCharts.com
TREASURY YIELDS FOLLOW BUNDS LOWER ... German 10-year bunds were sold below zero at today's auction which is keeping downside pressure on Treasury yields. The daily bars in Chart 1 show the 10-Year Treasury yield falling today to the lowest level since the end of 2017. That's...
READ MORE
MEMBERS ONLY

US Stocks Looking Vulnerable Again

by Martin Pring,
President, Pring Research
* Long-Term Picture Remains Finely Balanced
* Short-Term Indicators Still Showing Weakness
* Confidence is Starting to Erode Again
* Financials Break Down from a Broadening Wedge
Earlier in the month, I wrote about the Ides of March and the fact that the market looked overstretched, apparently in need of some mean reversal corrective...
READ MORE
MEMBERS ONLY

PLUNGE IN GLOBAL BOND YIELDS AND INVERTED YIELD CURVE PUSHES BOND PRICES HIGHER AND STOCKS LOWER -- FALLING BOND YIELDS REWARD UTILITIES WHILE HURTING BANKS -- WEAKNESS IN SMALL CAPS AND TRANSPORTS MAY BE WARNING OF MORE PROFIT-TAKING TO COME
by John Murphy,
Chief Technical Analyst, StockCharts.com
PLUNGE IN BOND YIELDS CAUSES YIELD CURVE TO INVERT ... Weak economic numbers from the eurozone and the U.S. on Friday pushed bond yields here and in Europe sharply lower and caused heavy profit-taking in global stocks. The 10-Year German bond yield fell into negative territory (below zero) for the...
READ MORE
MEMBERS ONLY

Deflation Sensitive Stocks Are At A New All-Time High
by Martin Pring,
President, Pring Research
* Deflation Index Leading the Market Higher
* Inflation/Deflation Ratio Starting to Break in a Deflationary Direction
* Several Deflation-Sensitive Industry Groups Looking Stronger
Deflation Index Leading the Market Higher
Last week, I wrote about the possibility of an upside price move in the bond market. So far, most areas remain below...
READ MORE
MEMBERS ONLY

TECH-DOMINATED NASDAQ LEADS MARKET HIGHER -- THE NASDAQ AND S&P 500 ARE CLEARING THEIR NOVEMBER HIGHS -- FALLING BOND YIELDS HAVE HELPED BOOST STOCK AND BOND PRICES -- HIGH YIELD AND INVESTMENT GRADE BONDS ARE OUTPACING TREASURIES
by John Murphy,
Chief Technical Analyst, StockCharts.com
NASDAQ AND S&P 500 HAVE CLEARED THEIR NOVEMBER HIGH... Just a week after slipping below their 200-day averages, the Nasdaq Composite Index in Chart 1 and the S&P 500 in Chart 2 appear to be ending the week above their November highs. That's the...
READ MORE
MEMBERS ONLY
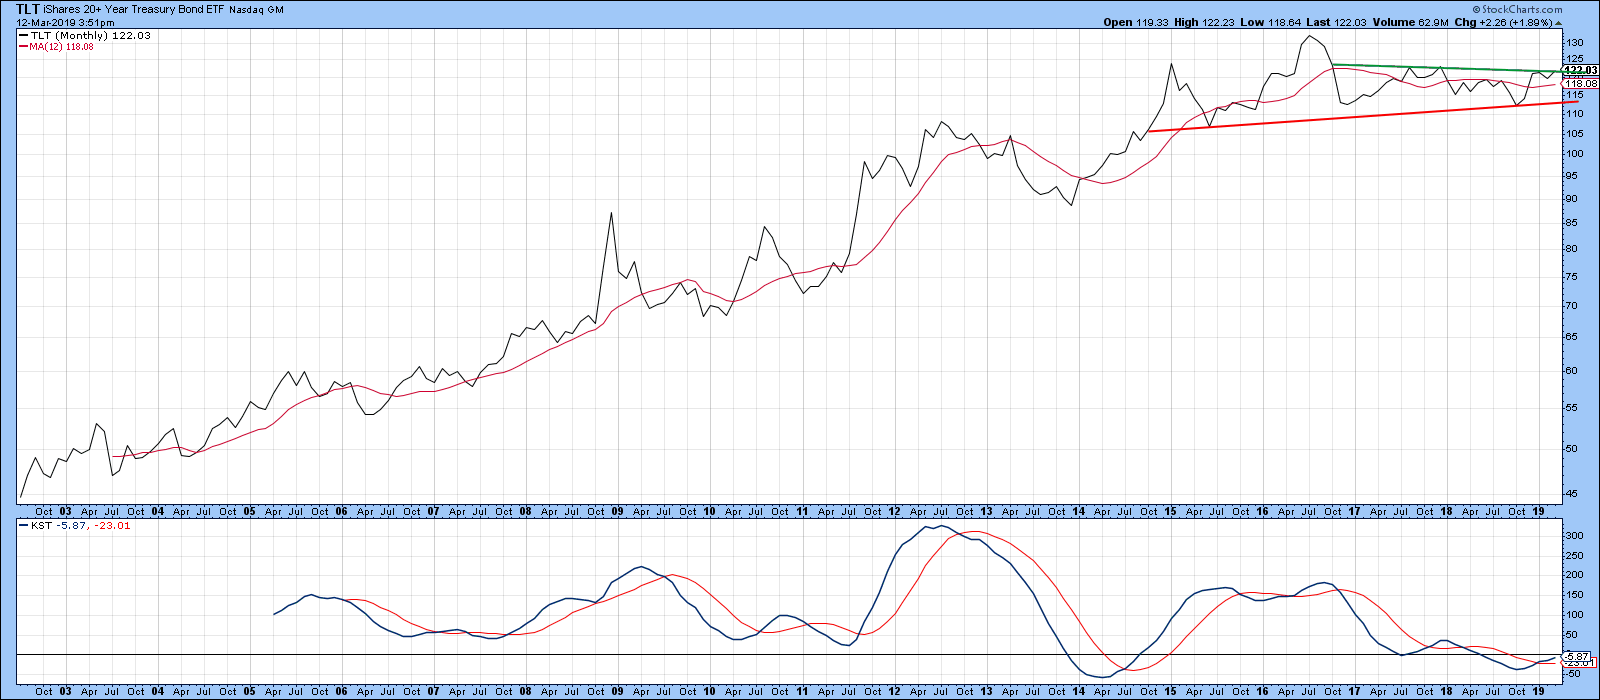
Bond Prices Poised For A Major Breakout, But Will They?
by Martin Pring,
President, Pring Research
* Adjusted vs. Unadjusted Prices
* Bonds Reflect the Fine Current Balance Between Inflationary and Deflationary Forces
Adjusted vs. Unadjusted Prices
Chart 1 shows that the iShares 20-year Trust ETF, the TLT, has been in a trading range since late 2014. Currently, the price is above its 12-month MA and the long-term...
READ MORE
MEMBERS ONLY

TECHNOLOGY SECTOR LEADS TODAY'S REBOUND AND HOLDS ITS 200-DAY LINE -- SEMICONDUCTORS ARE HAVING AN EVEN STRONGER DAY -- THE NASDAQ AND S&P 500 REGAIN THEIR 200-DAY LINES -- THE DOW SHRUGS OFF BIG BOEING LOSS
by John Murphy,
Chief Technical Analyst, StockCharts.com
TECHNOLOGY SPDR HOLDS ITS 200-DAY LINE ... Stocks are off to a strong start for the week. All stock sectors are in the green today led by technology, energy, communications, financials, and cyclicals. All stocks sectors are also in the green with the technology-dominated Nasdaq in the lead. The Dow Industrials...
READ MORE
MEMBERS ONLY

BULL MARKET IN STOCKS REACHES ITS TENTH ANNIVERSARY TODAY -- AND IS THE LONGEST IN HISTORY -- THE ECONOMIC EXPANSION WILL HIT ITS TENTH ANNIVERSARY IN JUNE -- AND IS NEARING A NEW RECORD AS WELL
by John Murphy,
Chief Technical Analyst, StockCharts.com
HAPPY TENTH ANNIVERSARY... Today marks the tenth anniversary of the bull market in stocks that started on March 9, 2009. It's already the longest in history, and the first bull market to last ten years. According to the Wall Street Journal, the S&P 500 has gained...
READ MORE
MEMBERS ONLY

CONSUMER DISCRETIONARY SPDR FALLS BACK BELOW 200-DAY AVERAGE -- APPAREL RETAILERS ARE LEADING THE S&P 500 RETAIL SPDR LOWER -- AMAZON.COM ISN'T DOING MUCH BETTER -- CONSUMER CYCLICALS/STAPLES RATIO IS ALSO WEAKENING
by John Murphy,
Chief Technical Analyst, StockCharts.com
CONSUMER DISCRETIONARY SPDR IS BACK BELOW ITS 200-DAY AVERAGE... As of today, the Nasdaq Composite Index and the S&P 500 are trading back below their 200-day averages. That leaves only the Dow Industrials still above that long-term support line. A number of sector ETFs have either failed a...
READ MORE
MEMBERS ONLY

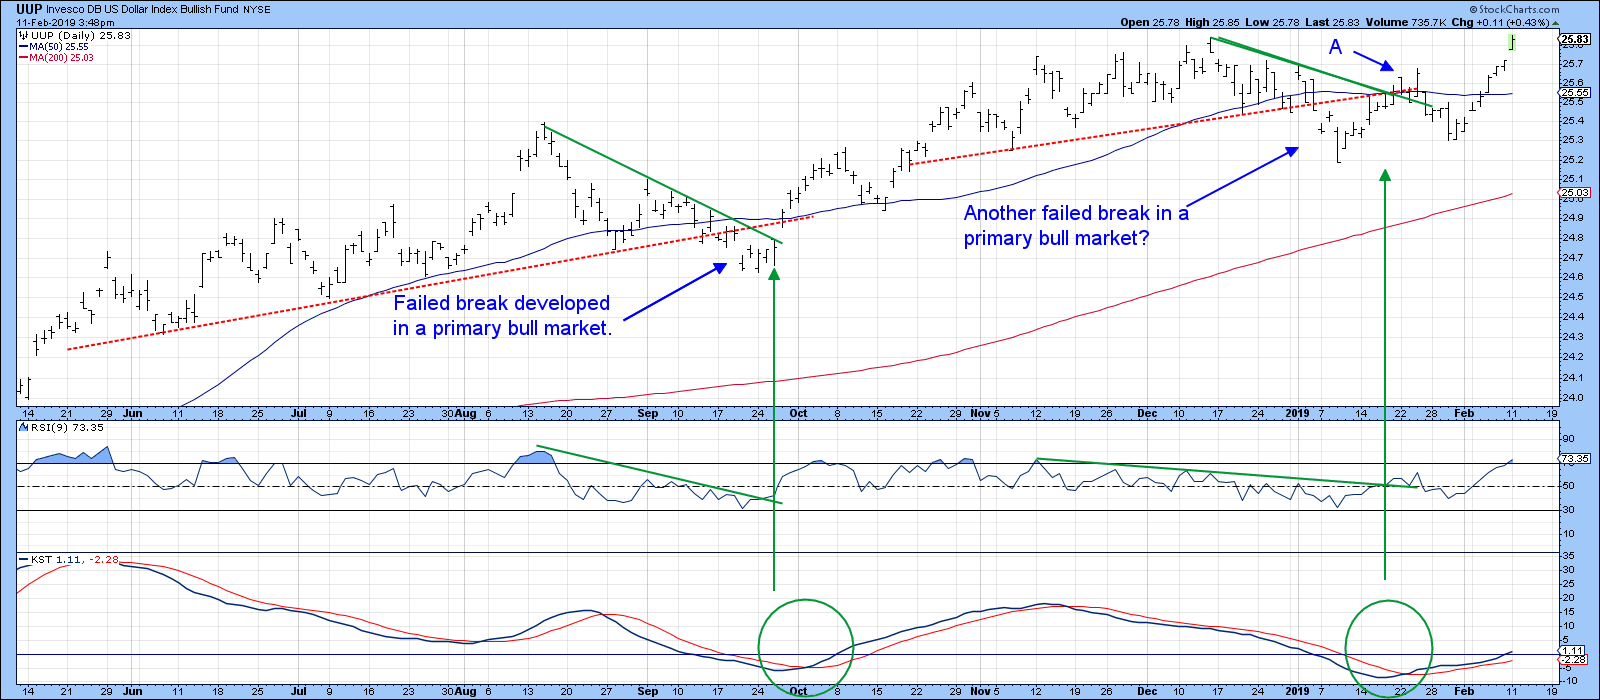
Dollar Breaks To New Highs As Several Stock Averages Drop Below Their 200-Day Moving Averages
by Martin Pring,
President, Pring Research
* Dollar Diffusion Gives a Buy Signal
* Differential Interest Rates Turn Bullish for the Dollar
* $NYA and $COMPQ Drop Below Their 200-Day MAs
One would think that a record trade deficit would be bearish for the dollar. However, the market does not agree, as the Invesco Bullish Dollar ETF (UUP) just...
READ MORE
MEMBERS ONLY

SMALL CAPS AND TRANSPORTS CONTINUE TO LEAD STOCKS LOWER -- STOCK INDEXES UNDERCUT 20-DAY AVERAGES -- AND ARE THREATENING 200-DAY LINES -- BOND PRICES RALLY -- EUROZONE BOND PRICES RISE ON MORE DOVISH ECB -- A PLUNGING EURO PUSHES DOLLAR TO TWO-YEAR HIGH
by John Murphy,
Chief Technical Analyst, StockCharts.com
GLOBAL STOCKS TURN DOWN FROM OVERBOUGHT TERRITORY... Several of the writers on this site have been pointing out that the strong 2019 stock rally had become over-extended, and was up against formidable chart resistance at their November high. So it's not a big surprise to see some profit-taking...
READ MORE
MEMBERS ONLY

Beware The Ides of March - and an Overstretched Stock Market
by Martin Pring,
President, Pring Research
* Strong Broadly-Based Rally
* NYSE Declining Peaks and Troughs Still in Force
* Several Short-Term Indicators Starting to Point South
Strong Broadly-Based Rally
The rally dating from Christmas Eve has been a powerful one, generating an approximate 20% gain from its low. It has also been broad, not only enabling the NYSE...
READ MORE
MEMBERS ONLY

KOHLS AND TARGET LEAD RETAILERS HIGHER -- RETAIL SPDR REMAINS BELOW 200-DAY LINE -- HOME CONSTRUCTION ISHARES FALL BELOW ITS 200-DAY LINE -- SO DO LENNAR AND DR HORTON -- STOCK INDEXES HOLD STEADY AFTER MODEST PROFIT-TAKING
by John Murphy,
Chief Technical Analyst, StockCharts.com
KOHLS AND TARGET LEAD RETAILERS HIGHER ... Chart 1 shows Kohls (KSS) surging 7% to clear its 200-day average and trade at the highest level since November. Chart 2 shows Target (TGT) up nearly 5% and also trading at the highest level in three months. The broadline retailer is also trading...
READ MORE
MEMBERS ONLY

MAJOR STOCK INDEXES CONTINUE TO TEST OVERHEAD RESISTANCE NEAR THEIR NOVEMBER HIGHS -- AND CONTINUE TO LOOK OVER-EXTENDED -- THE S&P 600 SMALL CAP INDEX AND THE DOW TRANSPORTS ARE MEETING SOME SELLING AT THEIR 200-DAY LINES
by John Murphy,
Chief Technical Analyst, StockCharts.com
NOVEMBER HIGH IS BEING TESTED ... After having one of the strongest starts to a new year in history, major stock indexes find themselves testing yet another potential overhead resistance barrier. And they're doing so while in an over-extended technical condition. But they've been looking over-extended for...
READ MORE
MEMBERS ONLY

BOND PRICES ARE UP AGAINST CHART RESISTANCE -- AND MAY BE SUBJECT TO PROFIT-TAKING -- RISING OIL PRICE MIGHT ALSO WEAKEN BOND PRICES -- SO COULD A STRONGER COPPER MARKET -- TODAY'S YIELD BOUNCE MIGHT BE CAUSING SOME PROFIT-TAKING IN GOLD
by John Murphy,
Chief Technical Analyst, StockCharts.com
TREASURY BOND ETFS ARE UP AGAINST CHART RESISTANCE... Last Thursday's message suggested that an overbought Treasury bond market was looking vulnerable to some profit-taking. That's still the case. The weekly bars in Chart 1 show the 7-10 Year Treasury Bond IShares (IEF) just below potential overhead...
READ MORE
MEMBERS ONLY

Monday's Sharp Rally In Shanghai Triggers Some Very Important Long-Term Signals
by Martin Pring,
President, Pring Research
* Shanghai Composite Secular Uptrend Line is Still Intact
* If China Rallies, Will It Take Commodities Along for the Ride?
* China vs. Hong Kong
* Chinese ETFs Experiencing a Reversal
Shanghai Composite Secular Uptrend Line is Still Intact
Chart 1 features a really important benchmark for the Shanghai Composite - a secular...
READ MORE
MEMBERS ONLY

CISCO, INTEL, AND MICROSOFT LEAD DOW HIGHER -- TECHNOLOGY SECTOR SHOWS NEW LEADERSHIP -- FINANCIAL SPDR IS TRADING OVER ITS 200-DAY AVERAGE -- CHINA LEADS EMERGING MARKET STOCKS HIGHER -- CHINESE STOCKS ARE NOW DOING BETTER THAN THE U.S.
by John Murphy,
Chief Technical Analyst, StockCharts.com
CISCO, INTEL, AND MICROSOFT ARE DOW LEADERS ... A glance at today's most actives list for the Dow shows three stocks attracting a lot of the buying. Chart 1 shows Cisco (CSCO) surging to an all-time high. Its rising relative strength line (upper box) shows it leading the Dow...
READ MORE
MEMBERS ONLY

STOCK INDEXES TEST OVERHEAD RESISTANCE WHILE LOOKING OVEREXTENDED -- FINANCIALS AND MATERIALS TEST 200-DAY LINES -- UTILITIES NEAR A NEW RECORD HIGH -- COPPER ACHIEVES BULLISH BREAKOUT AS COMMODITIES STRENGTHEN
by John Murphy,
Chief Technical Analyst, StockCharts.com
MAJOR STOCK INDEXES TEST OVERHEAD RESISTANCE ... All three major U.S stocks are testing overhead resistance barriers. Chart 1 shows the Dow Industrials right up against their early December peak at 26000. That's the Dow's first test of a previous peak formed during the fourth quarter...
READ MORE
MEMBERS ONLY

DOVISH FED HAS CONTRIBUTED TO FALLING BOND YIELDS -- FALLING GERMAN YIELDS ARE ALSO HOLDING TREASURY YIELDS DOWN -- FALLING GLOBAL BOND YIELDS MAY ALSO EXPLAIN RECENT BUYING OF GOLD AND MINERS
by John Murphy,
Chief Technical Analyst, StockCharts.com
TEN-YEAR TREASURY YIELD REMAINS WEAK ... Despite renewed optimism in the stock market which has had a spectacular start to the new year, Treasury yields remain surprisingly low. Chart 1 shows the 10-Year Treasury Yield ($TNX) still trading close to its lowest level in a year. The TNX also remains below...
READ MORE
MEMBERS ONLY

A New All-Time High In The NYSE A/D Line Is Bullish Until It Isn't
by Martin Pring,
President, Pring Research
* Superior Breadth Over Price Does Not Always Have a Positive Outcome
* Weighted versus Equal Weight
Chart 1 shows that the NYSE A/D Line touched a new high last week and seems to be leading the S&P higher. The textbooks tell us that a broad advance, such as...
READ MORE
MEMBERS ONLY

MARKET RALLY CONTINUES AS NASDAQ TESTS ITS 200-DAY AVERAGE -- FINANCIALS LEAD TODAY'S GAINS -- DRUGS HELP BOOST HEALTHCARE SECTOR -- HOME DEPOT, UNITED TECHNOLOGIES, AND TRAVELERS ARE DOW LEADERS -- SEMICONDUCTORS SHOW NEW LEADERSHIP
by John Murphy,
Chief Technical Analyst, StockCharts.com
NASDAQ MAY BE THE THIRD MAJOR STOCK INDEX TO CROSS ITS RED LINE ... Charts 1 and 2 show the Dow Industrials and S&P 500 building on their gains after rising above their 200-day averages (red lines). Both now appear headed for a test of their early December peaks....
READ MORE
MEMBERS ONLY

THE S&P 500 JOINS THE DOW ABOVE ITS 200-DAY AVERAGE -- CONSUMER DISCRETIONARY AND INDUSTRIAL SPDRS HAVE CROSSED THEIR THEIR RED LINES -- THE XLI HAS ALSO CLEARED ITS DECEMBER HIGH -- RAILS ARE BOOSTING THE XLI -- NYSE AD LINES NEAR TEST OF 2018 HIGHS
by John Murphy,
Chief Technical Analyst, StockCharts.com
S&P 500 CROSSES ABOVE ITS 200-DAY AVERAGE... Up to last night, the Dow Industrials were the only major stock index to trade above their 200-day average. The S&P 500 closed marginally above its 200-day line yesterday. Chart 2 shows the SPX extending that gain over its...
READ MORE
MEMBERS ONLY
Dollar Index On The Verge Of A Breakout?
by Martin Pring,
President, Pring Research
* Dollar About to Break New Ground?
* Euro Starting to Break Down
* Swiss Franc at a Major Juncture Point
* The Fortunes of the Canadian, Australian and EM Currencies are Tied to Commodities
Dollar About to Break New Ground?
I last wrote about the dollar at the end of January, pointing out...
READ MORE
MEMBERS ONLY

DOLLAR INDEX MAY BE NEARING AN UPSIDE BREAKOUT -- SEVERAL FOREIGN CURRENCIES HAVE FAILED TESTS OF 200-DAY AVERAGES -- THE EURO MAY RETEST NOVEMBER LOW -- THE RISING DOLLAR WEAKENS COMMODITY PRICES -- ESPECIALLY BASE METALS AND ENERGY
by John Murphy,
Chief Technical Analyst, StockCharts.com
DOLLAR INDEX NEARS NEW HIGH... The recent upturn in the dollar is continuing today. The daily bars in Chart 1 show the Invesco U.S. Dollar Index Fund (UUP) jumping to the highest level in two months and nearing a challenge of its December high. A close above that chart...
READ MORE
MEMBERS ONLY

STOCK INDEXES ARE FAILING TEST OF 200-DAY MOVING AVERAGES -- THE DOW MAY ALSO SLIP BACK BELOW ITS RED LINE -- FALLING BOND YIELDS ARE BOOSTING UTILITIES AND OTHER DEFENSIVE SECTORS -- WHILE A RISING DOLLAR IS HURTING ENERGY AND MATERIAL STOCKS
by John Murphy,
Chief Technical Analyst, StockCharts.com
200-DAY MOVING AVERAGES CONTAIN THE RECENT RALLY... With stocks losing ground over the past two days, it looks like the 200-day averages that we've all been watching have managed to contain the 2019 rally. Chart 1 shows the S&P 500 pulling back from that red overhead...
READ MORE
MEMBERS ONLY

TESTING OF 200-DAY AVERAGES CONTINUES -- THE SPX AND QQQ ARE TESTING IT NOW -- XLI AND XLY ARE ALREADY ABOVE -- WHILE THE XLC IS STALLING AT ITS RED LINE -- TREASURY YIELDS AREN'T FOLLOWING STOCKS HIGHER WHICH GIVES MIXED MESSAGE ON INVESTOR CONFIDENCE
by John Murphy,
Chief Technical Analyst, StockCharts.com
S&P 500 AND NASDAQ ARE TESTING 200-DAY AVERAGES ... It seems that everyone is watching 200-day moving averages. That's because the strong rebound since the end of December has pushed major U.S. stock indexes back to that overhead resistance line. What they do there should help...
READ MORE
MEMBERS ONLY

The State Of The 200-Day Moving Average
by Martin Pring,
President, Pring Research
* Three Major Averages are at their 200-Day MAs
* The NYSE Has Been Declining for a Year
* Will There Be Another Whipsaw?
Today, of course, is the State of the Union Address, but for the markets it might well be the “State of the 200-Day Moving Average,” as that’s the...
READ MORE
MEMBERS ONLY

WHAT TO MAKE OF THE 2019 REBOUND -- BEAR MARKET RALLY OR START OF A NEW UPLEG? -- OR PART OF A TOPPING PROCESS -- S&P 500 NEARS TEST OF 200-DAY AVERAGE AND MAYBE ITS DECEMBER HIGH -- WEEKLY CHARTS ALSO SHOW IMPROVEMENT
by John Murphy,
Chief Technical Analyst, StockCharts.com
S&P 500 NEARS TEST OF 200-DAY MOVING AVERAGE... The daily bars in Chart 1 show the S&P 500 nearing a test of its 200-day moving average (red line). That's an important test for it and rest of the stock market. A strong stock market...
READ MORE
MEMBERS ONLY
Weekly Market Roundup with Martin Pring 2019-02-02
by Martin Pring,
President, Pring Research
The Market Roundup Video For February is now available.
Good luck and good charting,
Martin J. Pring
The views expressed in this article are those of the author and do not necessarily reflect the position or opinion ofPring Turner Capital Groupof Walnut Creek or its affiliates....
READ MORE
MEMBERS ONLY

STOCK RALLY CONTINUES -- DOW IS THE FIRST INDEX TO REACH ITS 200-DAY AVERAGE -- CYCLICALS AND BIOTECHS ARE TRADING ABOVE THEIR 200-DAY LINES -- BIG DROP IN BOND YIELDS BOOSTS STAPLES, UTILITIES, AND REITS -- LOWER YIELDS ARE HURTING BANK STOCKS
by John Murphy,
Chief Technical Analyst, StockCharts.com
THE DOW IS THE FIRST TO REACH ITS 200-DAY AVERAGE... The stock rally that began right after Christmas is continuing today. Major stock indexes have been heading up to challenge potential overhead resistance at their 200-day moving averages. Chart 1 shows the Dow Industrials being the first major stock index...
READ MORE
MEMBERS ONLY

GOLD IS STARTING TO GAIN SOME UPSIDE ATTENTION -- SO ARE GOLD MINERS -- THAT MAY REFLECT EXPECTATIONS FOR A MORE DOVISH FED, A WEAKER DOLLAR, AND LOWER INTEREST RATES -- WEAKER GLOBAL STOCKS ALSO MAKE GOLD ASSETS A MORE ATTRACTIVE ALTERNATIVE
by John Murphy,
Chief Technical Analyst, StockCharts.com
GOLD ETFS ARE IN RALLY MODE ... Today is Fed day which could have an impact on several markets. The Fed isn't expected to raise its short-term rate today. But what it says after the meeting could have an impact. Two things are being watched very closely. The first...
READ MORE
MEMBERS ONLY

If The Economy Is Truly Weakening, Commodities Should Be Vulnerable
by Martin Pring,
President, Pring Research
* The Long-Term Trend for Commodities Remains Bearish
* What the Stock Market is Telling Us About Commodities
* Short-Term Picture Not So Strong
Recently, we have seen several reports of a weakening economy. These include a sharp drop in both the University of Michigan and Conference Board consumer sentiment and confidence numbers,...
READ MORE
MEMBERS ONLY

STOCK ADVANCE CONTINUES AS 50-DAY AVERAGES HOLD -- 200-DAY AVERAGES ARE NOW IN SIGHT -- EMERGING MARKETS ISHARES REACH SEVEN-MONTH HIGH AND ARE CHALLENGING 200-DAY AVERAGE -- CONSUMER DISCRETIONARY SPDR IS ALSO CHALLENGING ITS 200-DAY LINE
by John Murphy,
Chief Technical Analyst, StockCharts.com
MAJOR U.S. STOCK INDEXES HEAD TOWARD 200-DAY AVERAGES ... My Wednesday message expressed concern that several stock indexes were in danger of falling back below their 50-day averages, which would have put their January rebound in jeopardy. As today's first three charts show, however, the blue 50-day lines...
READ MORE
MEMBERS ONLY

XILINX LEADS SEMICONDUCTOR ISHARES TO THE HIGHEST LEVEL IN NEARLY TWO MONTHS -- LAM RESEARCH IS ALSO HAVING A VERY STRONG DAY -- INTEL CLEARS 200-DAY AVERAGE TO LEAD DOW HIGHER
by John Murphy,
Chief Technical Analyst, StockCharts.com
SEMICONDUCTOR ISHARES TURN UP... My message from yesterday showed semiconductor stocks under selling pressure. In today's trading, however, semis are having a very strong day and are the day's strongest stock group. Chart 1 shows the PHLX Semiconductor iShares (SOXX) jumping 5% to reach the highest...
READ MORE
MEMBERS ONLY

SEVERAL STOCK INDEXES ARE TRYING TO STAY ABOVE MOVING AVERAGE LINES -- CYCLICALS AND BIOTECHS ARE STRUGGLING WITH 200-DAY LINES -- SO ARE EMERGING MARKET ISHARES
by John Murphy,
Chief Technical Analyst, StockCharts.com
A LOT OF MOVING AVERAGES ARE BEING TESTED... Recent messages have focused on major U.S stock indexes reaching overhead resistance barriers which could slow their January advance; or maybe even end it. All of those major stock indexes remain below their 200-day averages; while their 50-day lines remain below...
READ MORE
MEMBERS ONLY

GLOBAL STOCKS DROP SHARPLY -- OVERBOUGHT S&P 500 BACKS OFF FROM TRENDLINE RESISTANCE -- WHILE AN OVERSOLD VIX INDEX BOUNCES OFF CHART SUPPORT -- TRADE AND ECONOMICALLY SENSITIVE STOCKS LEAD THE SELLING -- BIG DROP IN BOND YIELD BOOSTS BOND PRICES
by John Murphy,
Chief Technical Analyst, StockCharts.com
GLOBAL STOCKS SELL OFF WHILE BONDS RALLY... Stocks all over the world turned lower today. And they're doing it at a bad time. That's because the recent rebound has taken major U.S. stock indexes up to some formidable overhead resistance barriers. And they may be...
READ MORE
MEMBERS ONLY
Where's That Test Of The December Low?
by Martin Pring,
President, Pring Research
* Long-Term Trend Still Points South
* It Would be Unusual Not to Experience a Test of the December Low
* Dollar ETF Breaking Out?
Last week, I pointed out that the major averages were running into resistance at a moment when they were moderately overbought. At the time, some form of a...
READ MORE
MEMBERS ONLY

JANUARY STOCK REBOUND CONTINUES -- STOCK INDEXES HAVE CLEARED THEIR 50-DAY MOVING AVERAGES -- OVERHEAD RESISTANCE LINES STILL HAVE TO BE TESTED -- INCLUDING THEIR 200-DAY AVERAGES
by John Murphy,
Chief Technical Analyst, StockCharts.com
MAJOR U.S. STOCK INDEXES NEAR TEST OF OVERHEAD RESISTANCE ... All major U.S. stock indexes have exceeded their 50-day averages (blue lines). That still leaves their 200-day averages to contain the rally. But there are a couple of other resistance lines that still need to be tested. Chart 1...
READ MORE
MEMBERS ONLY

FINANCIAL STOCKS LEAD MARKET HIGHER -- OVERSOLD READINGS SUPPORT A RALLY -- BUT THEIR MAJOR TREND IS STILL DOWN -- THE S&P 500 NEARS OVERHEAD RESISTANCE WHILE THE VIX TESTS SUPPORT
by John Murphy,
Chief Technical Analyst, StockCharts.com
FINANCIAL SPDR CLEARS 50-DAY AVERAGE ... After months of poor absolute and relative performance, financial stocks are starting to show some upside leadership. The daily bars in Chart 1 show the Financial Sector SPDR (XLF) gapping higher today and trading above its 50-day moving average (blue circle). That would be enough...
READ MORE