MEMBERS ONLY

CSX AND UNITED AIRLINES LEAD TRANSPORTS HIGHER -- AND BOOST THE INDUSTRIAL SPDR -- FREEPORT MCMORAN LEADS MATERIALS HIGHER -- SIX-YEAR HIGH IN ALUMINUM PUSHES ALCOA TO NEW RECORD -- ENERGY AND METALS LEAD COMMODITIES SHARPLY HIGHER

by John Murphy,
Chief Technical Analyst, StockCharts.com
TRANSPORTS NEAR UPSIDE BREAKOUT ... Monday's message showed the Dow Transports rising above their 50-day average to turn their trend higher. Chart 1 shows the Dow Transports on the verge of breaking through overhead resistance formed in late February and mid-March. While rails and truckers (and FedEx) were Monday&...
READ MORE
MEMBERS ONLY

More Indicators Are Flashing The All Clear

by Martin Pring,
President, Pring Research
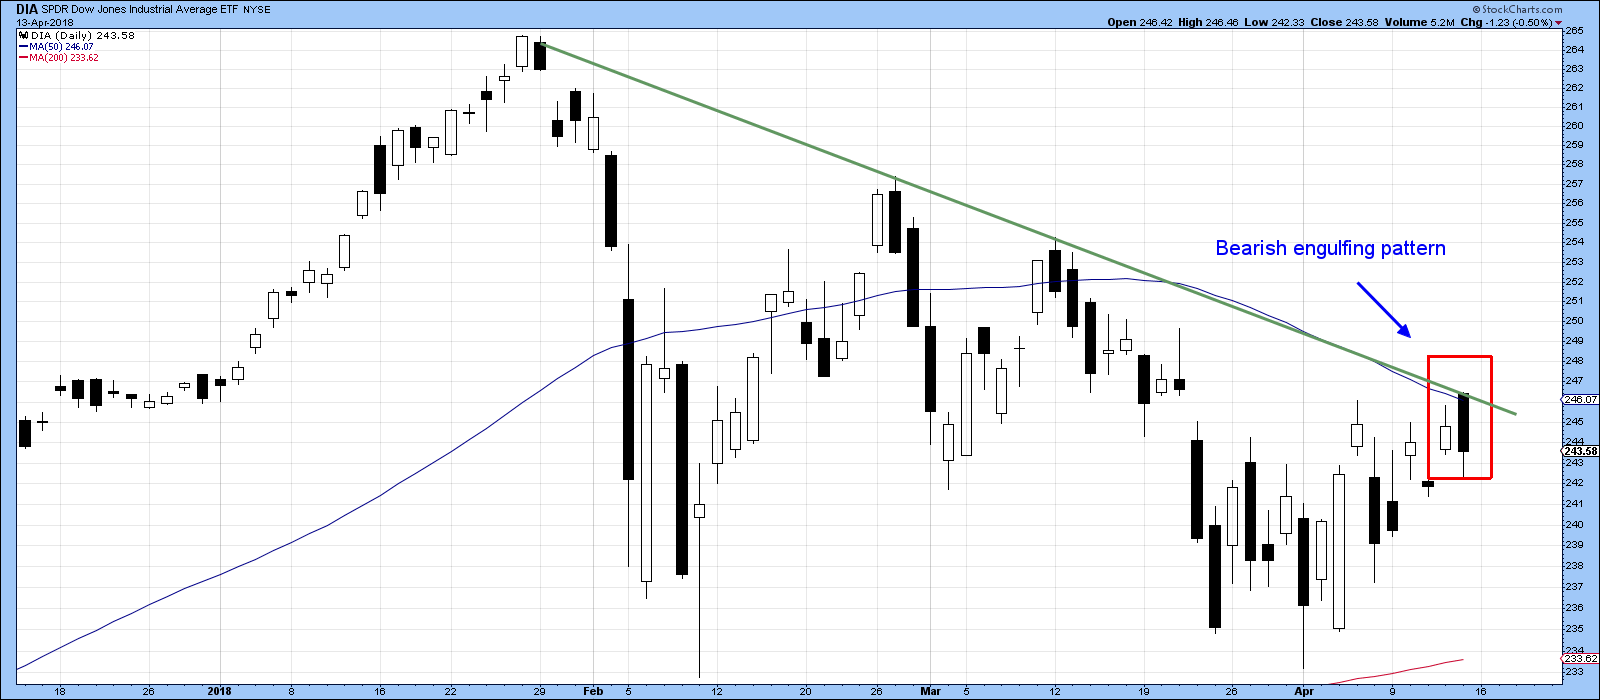
* Bearish engulfing pattern and outside day are cancelled
* Breath indicators are firming up
Bearish engulfing pattern and outside day are cancelled
Last week I wrote that many of the short-term indicators were flashing buy signals and that we should expect the US equity market to work its way higher. I...
READ MORE
MEMBERS ONLY

NASDAQ 100 LEADS MARKET HIGHER ALONG WITH THE TECHNOLOGY SECTOR -- TWITTER AND ALPHABET LEAD INTERNET STOCKS HIGHER -- INTEL AND MICROSOFT NEAR RECORD HIGHS -- THE DOW CLEARS 50-DAY LINE AND DOWN TRENDLINE -- ITS P&F CHART SHOWS AN UPTREND
by John Murphy,
Chief Technical Analyst, StockCharts.com
NASDAQ 100 LEADS MARKET HIGHER ... Stocks are having another good chart day. All major stock indexes are trading well above their 50-day averages. The Nasdaq market is in the lead. Chart 1 shows the PowerShares Nasdaq 100 (QQQ) gapping over its 50-day line today. The rising red line is a...
READ MORE
MEMBERS ONLY

DOW TRANSPORTS CLEAR THEIR 50-DAY AVERAGE -- JB HUNT AND CH ROBINSON ARE LEADING -- KANSAS CITY SOUTHERN, CSX, AND UNION PACIFIC ARE ALSO STRONG -- FEDEX CLEARS ITS 50-DAY AVERAGE -- THE DOW INDUSTRIALS ARE TESTING THEIR 50-DAY LINE AGAIN
by John Murphy,
Chief Technical Analyst, StockCharts.com
DOW TRANSPORTS EXCEED 50-DAY AVERAGE ... Stocks are opening the new week on a positive note. Transportation stocks are having an especially strong day. The daily bars in Chart 1 show the Dow Transports climbing 2% this morning. More importantly, the $TRAN is trading above its 50-day moving average (blue circle)...
READ MORE
MEMBERS ONLY
DJIA Engulfing Pattern Suggests A Pause Before Higher Prices
by Martin Pring,
President, Pring Research
* A small correction ahead?
* Short-term oscillators are primed for a rally
* Bitcoin is breaking out again
A small correction ahead?
If you want to be bullish, Friday’s technical action was somewhat disappointing. That’s because it represented an engulfing pattern for the DIA, as shown in Chart 1.
Chart...
READ MORE
MEMBERS ONLY

BANKS SUFFER BIG SELLOFF AFTER REPORTING STRONG EARNINGS -- JP MORGAN CHASE SUFFERS DOWNSIDE REVERSAL DAY -- FINANCIAL SPDR FAILS TEST OF 50-DAY AVERAGE -- STOCK INDEXES PULL BACK FROM 50-DAY AVERAGES BUT ON LIGHTEST TRADING OF THE YEAR
by John Murphy,
Chief Technical Analyst, StockCharts.com
JP MORGAN CHASE SUFFERS DOWNSIDE REVERSAL ON FRIDAY... Friday had to be a very discouraging day for investors in bank stocks. After reporting first quarter earnings that were much higher than expected, bank stocks opened higher before plunging in heavy trading. Chart 1 shows JP Morgan Chase (JPM) suffering a...
READ MORE
MEMBERS ONLY

BOND YIELDS MAY BE TURNING BACK UP AGAIN -- THAT'S BOOSTING FINANCIALS AND HURTING UTILITIES -- JP MORGAN AND GOLDMAN SACHS CLEAR 50-DAY AVERAGES -- BOEING AND INTEL LEAD DOW HIGHER
by John Murphy,
Chief Technical Analyst, StockCharts.com
TEN YEAR BOND YIELD MAY BE TURNING BACK UP AGAIN... After hitting a four-year high during January, the 10-Year Treasury Yield saw a modest decline from mid-February until the end of March. Some of that decline in yields was probably based on safe haven buying of Treasuries during the first...
READ MORE
MEMBERS ONLY

Small Caps May Be Breaking Out But Not All Are Created Equal
by Martin Pring,
President, Pring Research
* The technical position of small caps in general
* Small cap sectors
The technical position of small caps in general
Small caps, as represented by the Russell 2000 ETF (IWM), have outperformed the market since late March and have now broken out in their own right. We can see this from...
READ MORE
MEMBERS ONLY

COMMODITY PRICES ARE RISING -- CRUDE OIL BREAKOUT IS GIVING A BIG BOOST TO ENERGY SHARES -- SMALL CAPS CONTINUE TO SHOW RELATIVE STRENGTH -- S&P 500 STILL NEEDS TO CLEAR RESISTANCE -- STRENGTH IN HIGH YIELD BONDS IS ANOTHER POSITIVE SIGN
by John Murphy,
Chief Technical Analyst, StockCharts.com
CRUDE OIL LEADS BLOOMBERG COMMODITY INDEX HIGHER... The daily bars in Chart 1 show the Bloomberg Commodity Index rising to the highest level in two months. The index recently bounced off its 200-day moving average (red line) and a rising trendline drawn under its June/December lows. The commodity rally...
READ MORE
MEMBERS ONLY

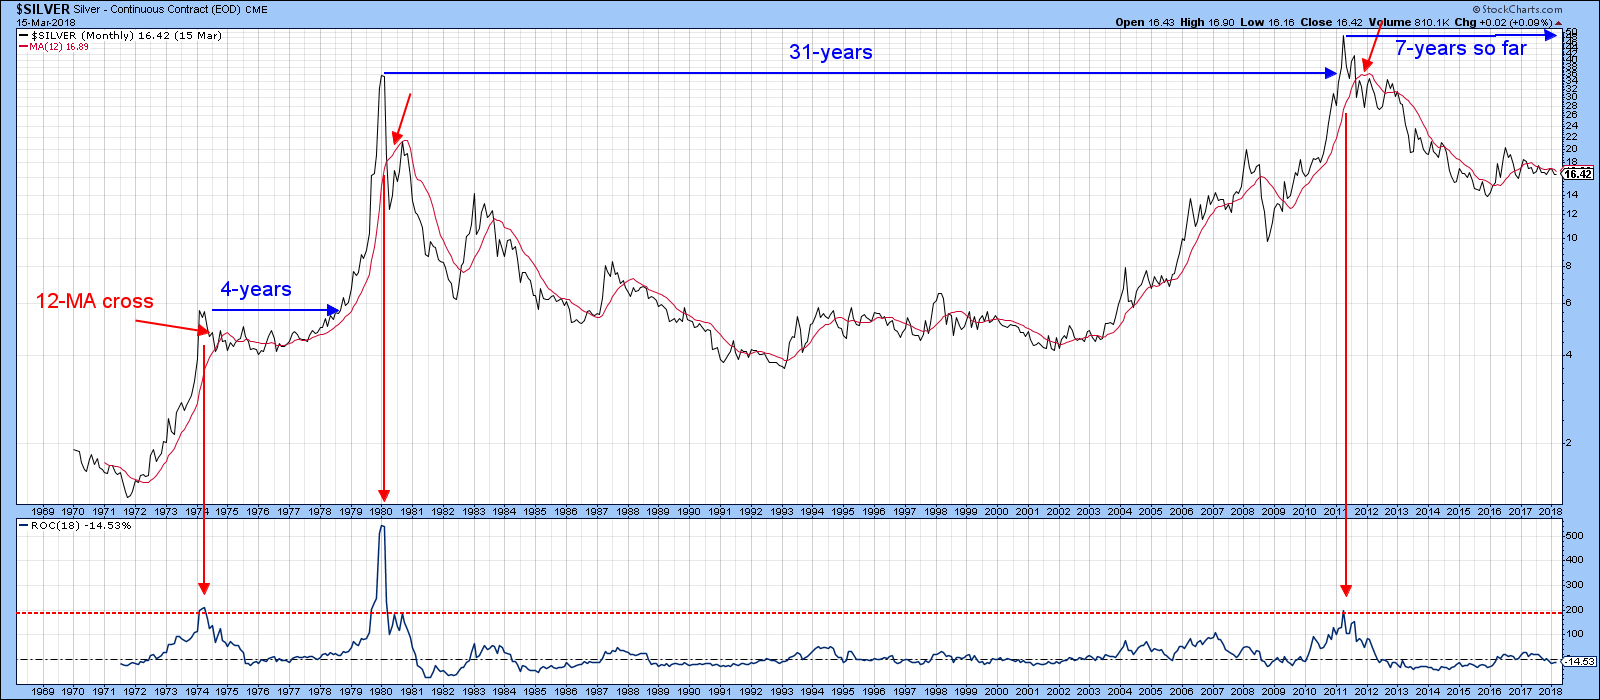
Identifying The Tapestry Of A Market Top
by Martin Pring,
President, Pring Research
* The importance of identifying the direction of the primary trend
* The Shiller P/E
* The four-way test
The importance of identifying the primary trend
Sometimes it’s a good idea to step back from the everyday trading of daily charts and short-term activity and look at the big picture. If...
READ MORE
MEMBERS ONLY

MARKETS GET TRUMPED FOR THE THIRD TIME -- WEEK'S STOCK GAINS ARE WIPED OUT ON FRIDAY AS TARIFF THREATS INTENSIFY -- ANOTHER TEST OF UNDERLYING CHART SUPPORT NOW APPEARS LIKELY
by John Murphy,
Chief Technical Analyst, StockCharts.com
THIRD TARIFF THREAT SINKS MARKET... Just when it looked like the stock market was about to recover from the first two rounds of tariff threats, stocks were hit with a third and bigger $100 billion tariff threat after the close on Thursday. As a result, stock market indexes fell more...
READ MORE
MEMBERS ONLY

REBOUND IN BOEING PUTS THE DOW IN THE LEAD FOR THE DAY -- THE DOW CLEARS INITIAL RESISTANCE BARRIER -- ENERGY AND MATERIAL SPDRS REGAIN 200-DAY AVERAGES -- FREEPORT MCMORAN AND MARATHON OIL HAVE A STRONG DAY -- S&P 500 NEARS TEST OF OVERHEAD RESISTANCE
by John Murphy,
Chief Technical Analyst, StockCharts.com
BOEING BOUNCES OFF 100-DAY AVERAGE ... The Dow Industrials led today's follow-through rally in stocks. Today's bounce in Boeing is a big reason why. The daily bars in Chart 1 show the aerospace giant gaining 2.74% today after bouncing off its 100-day moving average (green line)...
READ MORE
MEMBERS ONLY

STOCKS SURGE 3% AFTER A WEAK OPEN -- AND 200-DAY AVERAGES HOLD ONCE AGAIN -- SMALL CAPS ARE HOLDING UP BETTER THAN LARGE CAPS -- HOMEBUILDERS AND RETAILERS MADE CYCLICALS THE DAY'S STRONGEST SECTOR
by John Murphy,
Chief Technical Analyst, StockCharts.com
STOCKS SCORE BIG UPSIDE REVERSAL FROM 200-DAY AVERAGES ... The stock market staged an impressive upside turnaround today. After opening 500 points lower this morning, the Dow Industrials ended the day 230 points (0.96%) higher. That's a gain of more than 700 points from its opening price. Stock...
READ MORE
MEMBERS ONLY

Bottoms Up Part II
by Martin Pring,
President, Pring Research
* Positive breadth characteristics
* VIX is less fearful
* Short-term oscillators starting to get extremely oversold
* How about trend?
Last week I suggested that the market may be in the process of forming a double bottom. This week we take that possibility one step forward. Whenever the non-financial cable networks run a...
READ MORE
MEMBERS ONLY
Market Round Up April 2018
by Martin Pring,
President, Pring Research
Here is a link to the April edition of Market Round Up for 2018.
Martin-Pring-Market-Roundup-April-2018 from StockCharts.com on Vimeo.
Good luck and good charting,
Martin J. Pring
The views expressed in this article are those of the author and do not necessarily reflect the position or opinion of Pring...
READ MORE
MEMBERS ONLY

STOCKS START THE SECOND QUARTER UNDER HEAVY SELLING -- 200-DAY MOVING AVERAGES ARE BEING THREATENED -- ALL MARKET SECTORS END IN THE RED -- CONSUMER DISCRETIONARY AND TECHNOLOGY STOCKS ARE AMONG BIGGEST LOSERS
by John Murphy,
Chief Technical Analyst, StockCharts.com
MAJOR STOCK INDEXES RETEST UNDERLYING SUPPORT LEVELS ... Stocks started the second quarter under heavy selling pressure. Some major stock indexes saw losses in excess of 2%. Today's selling is resulting in retests of important underlying support levels. Chart 1 shows the Dow Industrials touching its 200-day average but...
READ MORE
MEMBERS ONLY

THE FIRST QUARTER WASN'T THAT BAD FOR STOCKS -- THE VANGUARD TOTAL STOCK MARKET ETF LOST LESS THAN 1% -- SOCIAL MEDIA ETF IS BOUNCING OFF CHART SUPPORT -- SO IS AN ETF OF BANK STOCKS -- GLOBAL X COPPER MINERS ETF BOUNCES OFF ITS 200-DAY AVERAGE
by John Murphy,
Chief Technical Analyst, StockCharts.com
VANGUARD TOTAL STOCK MARKET ETF LOST LESS THAN 1%... Despite all the volatility during the first quarter, the first three months of 2018 weren't really that bad. The Dow Industrials were the biggest losers with a quarterly drop of -2.5%. The broader S&P 500 Index...
READ MORE
MEMBERS ONLY

Bottoms Up?
by Martin Pring,
President, Pring Research
* Is the market forming a double bottom?
* Short-term indicators suggest the bottoming process is nearly complete
Sometimes a technical event or characteristic becomes very popular very quickly as a lot of people write and blog about them. Usually, the expectations based on those forecasts are not met. For example, every...
READ MORE
MEMBERS ONLY

MAJOR US STOCK INDEXES ARE TRYING TO STABILIZE NEAR 200-DAY AVERAGES AND FEBRUARY LOW -- TECHNOLOGY STOCKS ARE WEIGHING ON THE MARKET -- ESPECIALLY FAANG STOCKS -- BUT FACEBOOK LOOKS OVERSOLD WHILE ALPHABET IS TESTING CHART SUPPORT
by John Murphy,
Chief Technical Analyst, StockCharts.com
DOW AND THE S&P 500 ARE RETESTING 200-DAY LINES ... The Dow and the S&P 500 are still in the process of retesting underlying support levels near their 200-day averages and February lows. Chart 1 shows the Dow Industrials retesting its February intra-day low at 23,400...
READ MORE
MEMBERS ONLY

THE ALL COUNTRY WORLD INDEX IS HEADED FOR A TEST OF FEBRUARY SUPPORT -- SO IS THE S&P 500 WHICH IS ALSO TESTING A TRENDLINE EXTENDING BACK TO THE START OF 2016 -- FINANCIALS AND TECHNOLOGY ARE THE BIGGEST SECTOR LOSERS
by John Murphy,
Chief Technical Analyst, StockCharts.com
WORLD STOCK INDEX HEADED FOR A TEST OF ITS FEBRUARY LOW AND ITS 200-DAY AVERAGE... Stocks around the world had a terrible week. Foreign stocks fell along with the U.S. That's not unusual since global stocks become tightly correlated on the way down. Selling in Chinese stocks...
READ MORE
MEMBERS ONLY

NYSE Composite Draws Closer To Its 200-day And 12-month Moving Averages
by Martin Pring,
President, Pring Research
* Breadth is more of a positive than a negative factor
* Global breadth is also positive
* Dow Diffusion Indicator close to a buy signal
* Consumer cyclicals versus technology
Since early February, the US equity market, in the form of the NYSE Composite, has been in a trading range. This is flagged...
READ MORE
MEMBERS ONLY

DOW AND S&P 500 BREAK TRENDLINE SUPPORT -- NASDAQ 100 FALLS BELOW 50-DAY AVERAGE -- INTERNET SOCIAL MEDIA STOCKS CONTINUE TO LEAD TECHNOLOGY SECTOR LOWER -- TENCENT HOLDINGS REFLECTS HEAVY SELLING IN CHINESE STOCKS
by John Murphy,
Chief Technical Analyst, StockCharts.com
U.S. STOCK INDEXES BREAK SUPPORT LINES ... Major U.S. stock indexes are under heavy selling today and are breaking some important support lines. Chart 1 shows the Dow Industrials falling below a trendline extending back to early February. That signals a possible drop back to its February intra-day low...
READ MORE
MEMBERS ONLY

CRUDE OIL IS NEARING ANOTHER THREE-YEAR HIGH AND BOOSTING ENERGY SHARES -- ENERGY SPDR IS BOUNCING OFF MAJOR TRENDLINE SUPPORT AND 200-DAY AVERAGE -- OIL SERVICE ETF IS EVEN STRONGER -- ENERGY LEADERS ARE TRANSOCEAN, NATIONAL OILWELL, AND HESS
by John Murphy,
Chief Technical Analyst, StockCharts.com
PRICE OF OIL NEARS THREE-YEAR HIGH... WTIC Light Crude is trading more than 2% higher today near $65. The weekly bars in Chart 1 (plotted through yesterday) show Light Crude Oil also nearing another three-year high. Brent crude is in a similar situation. Chart 2 shows the United States Oil...
READ MORE
MEMBERS ONLY

NEGATIVE DIVERGENCE LEADS TO TECH SELLING -- FACEBOOK FALLS TO SIX-MONTH LOW AND LEADS INTERNET GROUP LOWER -- TECH SECTOR MAY BE VULNERABLE TO MORE PROFIT-TAKING -- DOW INDUSTRIALS AND S&P 500 ARE TESTING POTENTIAL TRENDLINE SUPPORT
by John Murphy,
Chief Technical Analyst, StockCharts.com
OVER-EXTENDED TECHNOLOGY SPDR TURNS LOWER... Last Wednesday's message showed the technology sector looking over-extended and vulnerable to profit-taking. So this week's tech selling wasn't too much of a surprise. The daily bars in Chart 1 shows the Technology SPDR (XLK) falling yesterday in heavy...
READ MORE
MEMBERS ONLY
Bitcoin Is A Mania But Is It Over?
by Martin Pring,
President, Pring Research
* Longer-term perspective
* Short-term Charts
* Dollar trying to break to the upside
Longer-term perspective
At its December 18 peak of $18,723, the Bitcoin Index ($NYXBT) outstripped all other bull markets in recorded history. By this yardstick alone this phenomenon qualifies as a mania. So far, the post high, low water...
READ MORE
MEMBERS ONLY

THE DOW TRANSPORTS ARE ALSO STRUGGLING AT 50-DAY AVERAGE -- BUT MAY BE FORMING ASCENDING TRIANGLE -- THE DOW INDUSTRIALS MAY BE FORMING BULLISH TRIANGLE OF ITS OWN -- THAT WOULD FIT INTO ELLIOTT WAVE FOUR CONSOLIDATION PATTERN
by John Murphy,
Chief Technical Analyst, StockCharts.com
DOW TRANSPORT UPTREND IS ALSO STALLED AT 50-DAY AVERAGE... Yesterday's message showed the Dow Industrials falling below their 50-day average. Today's message shows the Dow Transports doing the same. The daily bars in Chart 1 show the Dow Jones Transportation Average backing off from a test...
READ MORE
MEMBERS ONLY

STOCK UPTREND WEAKENS -- INDUSTRIAL SPDR RUNS INTO RESISTANCE AT 50-DAY LINE -- BOEING LEADS AEROSPACE LOWER -- ALUMINUM AND CHEMICALS PULL MATERIALS SPDR LOWER -- DOW INDUSTRIALS FALL BELOW 50-DAY LINE AS S&P 500 STALLS AT FEBRUARY HIGH
by John Murphy,
Chief Technical Analyst, StockCharts.com
BOEING LEADS INDUSTRIAL SPDR BELOW ITS 50-DAY LINE... The stock rally is starting to lose some upside momentum. That's partially because some market sectors are running into resistance at their 50-day moving average. The daily bars in Chart 1 show the Industrial Sector SPDR (XLI) slipping back below...
READ MORE
MEMBERS ONLY

STOCKS RALLY ON STRONG JOBS REPORT WITH SMALLER WAGE GAIN -- S&P 500 CLEARS 50-DAY AVERAGE -- NASDAQ 100 HITS NEW RECORD -- SEMICONDUCTOR ISHARES ARE LEADING THE QQQ INTO RECORD TERRITORY -- LAM RESEARCH AND INTEL HIT NEW RECORDS
by John Murphy,
Chief Technical Analyst, StockCharts.com
STRONG EMPLOYMENT REPORT BOOSTS STOCKS... A blockbuster employment report this morning is giving a big boost to stocks which were already in rally mode going into the report on easing tariff concerns from yesterday afternoon. U.S. employers added 313,000 jobs in February which was way above estimates and...
READ MORE
MEMBERS ONLY

What Will It Take To Trigger A Bull Market In The Dollar?
by Martin Pring,
President, Pring Research
* The indicated main trend is currently bearish
* What a more broadly-based Dollar index is saying
* Swiss Franc completes a small top
* Copper and the Dollar
The indicated main trend is currently bearish
The Dollar Index peaked in November 2016 and has so far bottomed in January of this year. If...
READ MORE
MEMBERS ONLY

LATE STOCK BUYING SHOWS POSITIVE REACTION TO TARIFF SPEECH -- S&P 500 CLOSES AT 50-DAY AVERAGE -- FIVE-MINUTE PRICE BARS SHOW STRONG BUYING IN FINAL MINUTES -- THE VIX NEARS TWO-WEEK LOW -- THE NASDAQ MARKET IS HEADED FOR ANOTHER TEST OF 2018 HIGHS
by John Murphy,
Chief Technical Analyst, StockCharts.com
S&P 500 CLOSES JUST SHY OF ITS 50-DAY AVERAGE... Late buying today pushed stocks higher and on rising volume. The daily bars in Chart 1 show the S&P 500 rising 12 points today (0.46%) to end at 2738 which is one point shy of its...
READ MORE
MEMBERS ONLY

SMALLER STOCKS ARE LEADING THE MARKET HIGHER -- S&P SMALL AND MIDCAP INDEXES NEAR UPSIDE BREAKOUTS -- THE S&P 500 SHOULD FOLLOW THEM HIGHER -- NASDAQ STRENGTH IS ALSO A POSITIVE SIGN
by John Murphy,
Chief Technical Analyst, StockCharts.com
SMALL AND MIDCAP STOCKS INDEXES CLEAR 50-DAY AVERAGES... Last Wednesday's message pointed out that smaller stocks were leading large caps lower. Small and midcap indexes had fallen below their 50-day average which increased odds that the S&P 500 would do the same, which it did. Today,...
READ MORE
MEMBERS ONLY

GRAIN PRICES ARE FINALLY MOVING HIGHER -- A WEAKER DOLLAR IS INCREASING DEMAND FOR AGRICULTURAL EXPORTS -- COTTON ALSO APPEARS TO BE BOTTOMING -- RISING PRICES COULD BOOST FOOD AND CLOTHING COSTS -- TODAY'S DOLLAR DROP IS BOOSTING GOLD
by John Murphy,
Chief Technical Analyst, StockCharts.com
GRAIN PRICES ARE LEADING COMMODITY RALLY THIS YEAR ... My market message from January 6 expressed the view that commodity prices appeared to be bottoming, which could increase inflation pressures later this year. It also suggested that the chart of the CRB Index might actually be understating the inflation threat. That...
READ MORE
MEMBERS ONLY
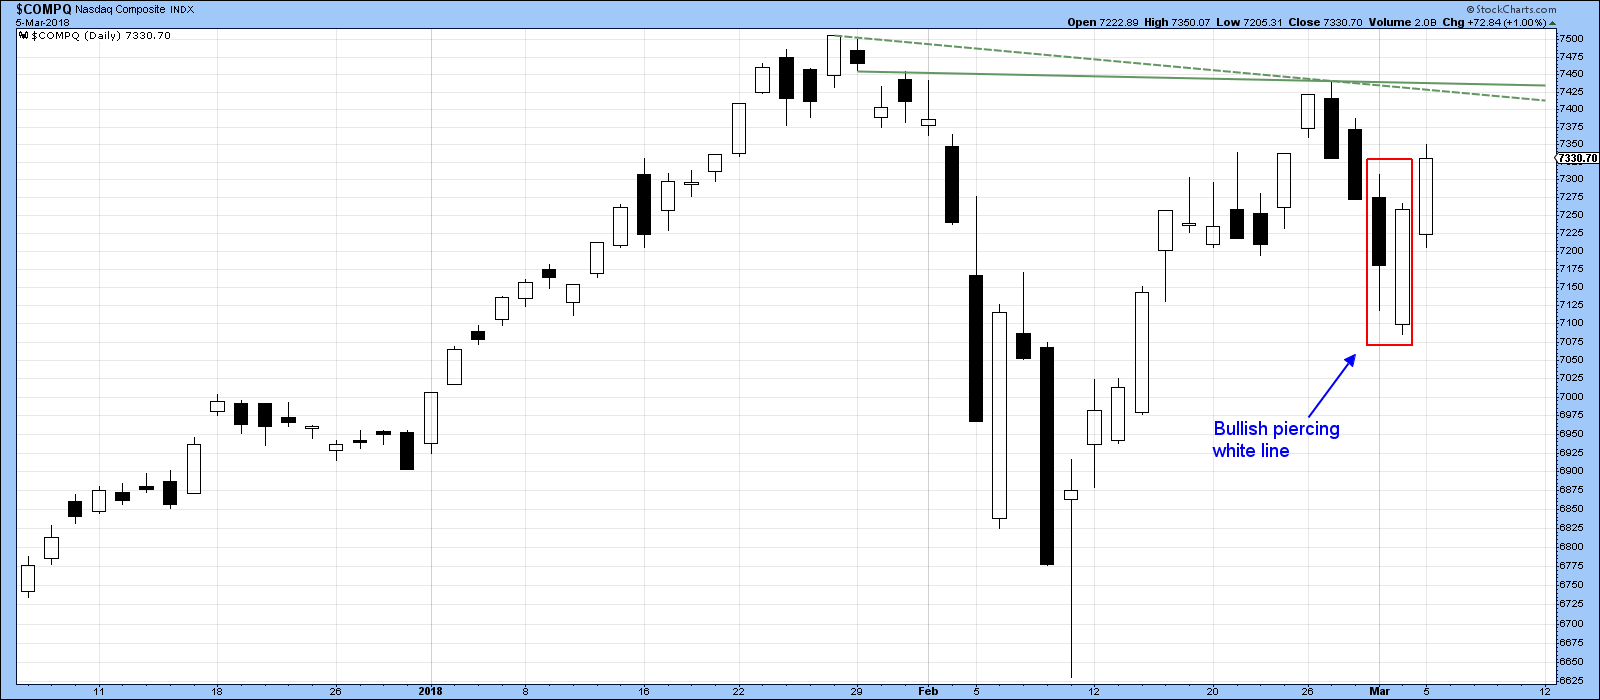
They Just Built A New Wall Of Worry For The US Stock Market
by Martin Pring,
President, Pring Research
* Two bullish piercing white lines
* A sector spread that predicts new stock market highs
* Two sectors affected by the proposed tariffs
Last week I wrote that the indicators seemed to be calling for a test of the early February low. My expectation was for a sharper and more prolonged decline...
READ MORE
MEMBERS ONLY

DOW AND S&P 500 BOUNCE IMPRESSIVELY OFF 100-DAY MOVING AVERAGES -- NASDAQ RISES FURTHER ABOVE 50-DAY LINE -- ALL SECTORS ARE IN THE GREEN -- WHILE THE VIX INDEX FALLS BACK BELOW 20 -- BLOOMBERG COMMODITY INDEX REGAINS ITS 50-DAY AVERAGE
by John Murphy,
Chief Technical Analyst, StockCharts.com
S&P 500 BOUNCES OFF 100-DAY AVERAGE... Last Friday's midday message showed the S&P 500 testing chart support near 2640 and in a short-term oversold condition (black line). After rallying off that support level on Friday afternoon, stocks built on those gains today. The daily...
READ MORE
MEMBERS ONLY

STOCKS REMAIN ON THE DEFENSIVE -- QQQ IS TESTING 50-DAY AVERAGE -- WHILE S&P 500 TESTS SHORT-TERM SUPPORT NEAR 2640 -- FALLING DOLLAR BOOSTS GOLD -- JAPANESE YEN SURGES TO 15-MONTH HIGH
by John Murphy,
Chief Technical Analyst, StockCharts.com
POWERSHARES QQQ IS TESTING 50-DAY AVERAGE ... Wednesday's message showed the PowerShares QQQ (representing the Nasdaq 100 Index) pulling back from overhead resistance at its late January peak. That suggested profit-taking in the technology-dominated QQQ and the rest of the market. It also suggested a retest of its 50-day...
READ MORE
MEMBERS ONLY

Market Round Up Monthly Video 2018-03-01 With Martin Pring
by Martin Pring,
President, Pring Research
Here is the market analysis reviewing the current market outlook. There is a host of information on commodities, bonds and US equities.
Market Roundup With Martin Pring 2018-03-01 from StockCharts.com on Vimeo.
Chartcon 2018 registration is now open! Registration kicked off today, February 1st!
Chartcon 2018! Follow the link...
READ MORE
MEMBERS ONLY

SMALL AND MIDCAP STOCKS LEAD LARGE CAPS LOWER -- THE S&P 500 IS IN DANGER OF CLOSING BELOW ITS 50-DAY AVERAGE -- RISING DOLLAR PUSHES ENERGY SECTOR INTO ANOTHER TEST OF 200-DAY AVERAGE
by John Murphy,
Chief Technical Analyst, StockCharts.com
S&P SMALL AND MIDCAP INDEXES FAIL TEST OF 50-DAY AVERAGE... The pullback in stocks that started yesterday is continuing today. And it's being led down by smaller stocks. Chart 1 shows the S&P 600 Small Cap Index ($SML) falling decisively back its blue 50-day...
READ MORE
MEMBERS ONLY

US Equities Emerging from The February Shakeout As A Global Leader Again
by Martin Pring,
President, Pring Research
* US is breaking out relative to the world
* Growth breaks decisively against value
* Blue Tuesday
US is breaking out relative to the world
Chart 1 shows that the ratio between the US stock market, in the form of the S&P Composite ($SPX), and the World Index (ACWI) often...
READ MORE
MEMBERS ONLY

JUMP IN BOND YIELDS PUTS STOCK REBOUND IN JEOPARDY -- QQQ IS PULLING BACK FROM TEST OF OLD HIGH -- S&P 500 LOOKS OVEREXTENDED -- BOUNCING DOLLAR WEAKENS GOLD -- EMERGING MARKETS ARE ALSO EXPERIENCING PROFIT-TAKING
by John Murphy,
Chief Technical Analyst, StockCharts.com
TEN-YEAR BOND YIELD IS BACK OVER 2.90% ... After a modest pullback that started last Thursday, bond yields are climbing again today. The daily bars in Chart 1 show the 10-Year Treasury Yield ($TNX) jumping 6 basis points to 2.92% and within striking distance of its four-year high reached...
READ MORE
MEMBERS ONLY

STOCKS REGAIN THREE-QUARTERS OF FEBRUARY SELLOFF -- QQQ NEARS TEST OF OLD HIGH -- AMERICAN AIRLINES AND UNION PACIFIC LEAD TRANSPORTS HIGHER -- COMMODITIES ARE ALSO RECOVERING
by John Murphy,
Chief Technical Analyst, StockCharts.com
STOCK INDEXES GAIN MORE GROUND -- QQQ NEARS TEST OF OLD HIGH... U.S. stock indexes continue to gain more ground today and have now regained about three-quarters of their recent correction. Charts 1 and 2 show the Dow Industrials and S&P 500 trading at three-week highs after...
READ MORE