MEMBERS ONLY

COMMODITIES ARE AT LOWEST LEVEL RELATIVE TO STOCKS IN HISTORY -- COMMODITIES HAVE A LOT OF CATCHING UP TO DO -- THAT PROCESS MAY BE BEGINNING -- CRB INDEX MAY BE NEARING UPSIDE BREAKOUT -- GLOBAL METALS AND MINING PRODUCERS ETF REACHES THREE-YEAR HIGH

by John Murphy,
Chief Technical Analyst, StockCharts.com
COMMODITIES ARE HISTORICALLY VERY CHEAP VERSUS STOCKS... I suggested yesterday that commodity prices (and stocks tied to them) usually do better in the later stages of a business cycle as inflation pressures start to build. We may be entering that stage. One of the reasons why investors may be turning...
READ MORE
MEMBERS ONLY

Four Markets To Watch In 2018 For A Potentially Important Breakout

by Martin Pring,
President, Pring Research
* 10-year bond yields could be in the process of a secular reversal.
* What odds is the S. Korean ETF placing on the breakout of war?
* China has gone uncharacteristically quiet. Is this the quiet before the storm?
* CRB Composite just below mega resistance
As we approach 2018 I thought it...
READ MORE
MEMBERS ONLY

WEAKER DOLLAR PUSHES COMMODITY PRICES HIGHER -- GOLD AND ITS MINERS CLIMB -- RISING ALUMINUM AND COPPER PRICES PUSH THEIR SHARES TO NEW HIGHS -- SOUTHERN COPPER HITS ALL-TIME HIGH -- RISING COMMODITIES MAY GIVE A BOOST TO CANADIAN STOCKS
by John Murphy,
Chief Technical Analyst, StockCharts.com
U.S. DOLLAR INDEX WEAKENS ... The U.S. dollar continues to weaken. Chart 1 shows the PowerShares US Dollar Index (UUP) falling today to the lowest level in a month. The dollar is down against all foreign developed currencies except the yen which is marginally lower. The biggest influence on...
READ MORE
MEMBERS ONLY

STOCKS HAVE ANOTHER UP WEEK BUT END QUIETLY -- - SURGE IN BOND YIELDS WAS WEEK'S BIGGEST STORY -- INFLATION-SENSITIVE STOCKS SURGED WHILE RATE-SENSITIVE STOCKS TUMBLED -- THAT SUGGESTS THERE MAY BE SOME HEDGING AGAINST FUTURE INFLATION GOING ON
by John Murphy,
Chief Technical Analyst, StockCharts.com
SANTA CLAUS RALLY STILL LIES AHEAD... The stock market experienced the second slowest trading day of the year on Friday as traders headed home for Christmas. All major stock indexes, however, hit new records during the week. The Russell 2000 Small Cap Index had the week's biggest percentage...
READ MORE
MEMBERS ONLY

The Yield Curve Is Not Forecasting A Recession Right Now
by Martin Pring,
President, Pring Research
* What message is the yield curve giving?
* Secular reversal in short-term bond yields is being signalled
* Energy sector breaks to the upside
* Energy strength may breathe life into the CRB Composite
What message is the yield curve giving?
Despite what you may be reading, the yield curve is not forecasting...
READ MORE
MEMBERS ONLY

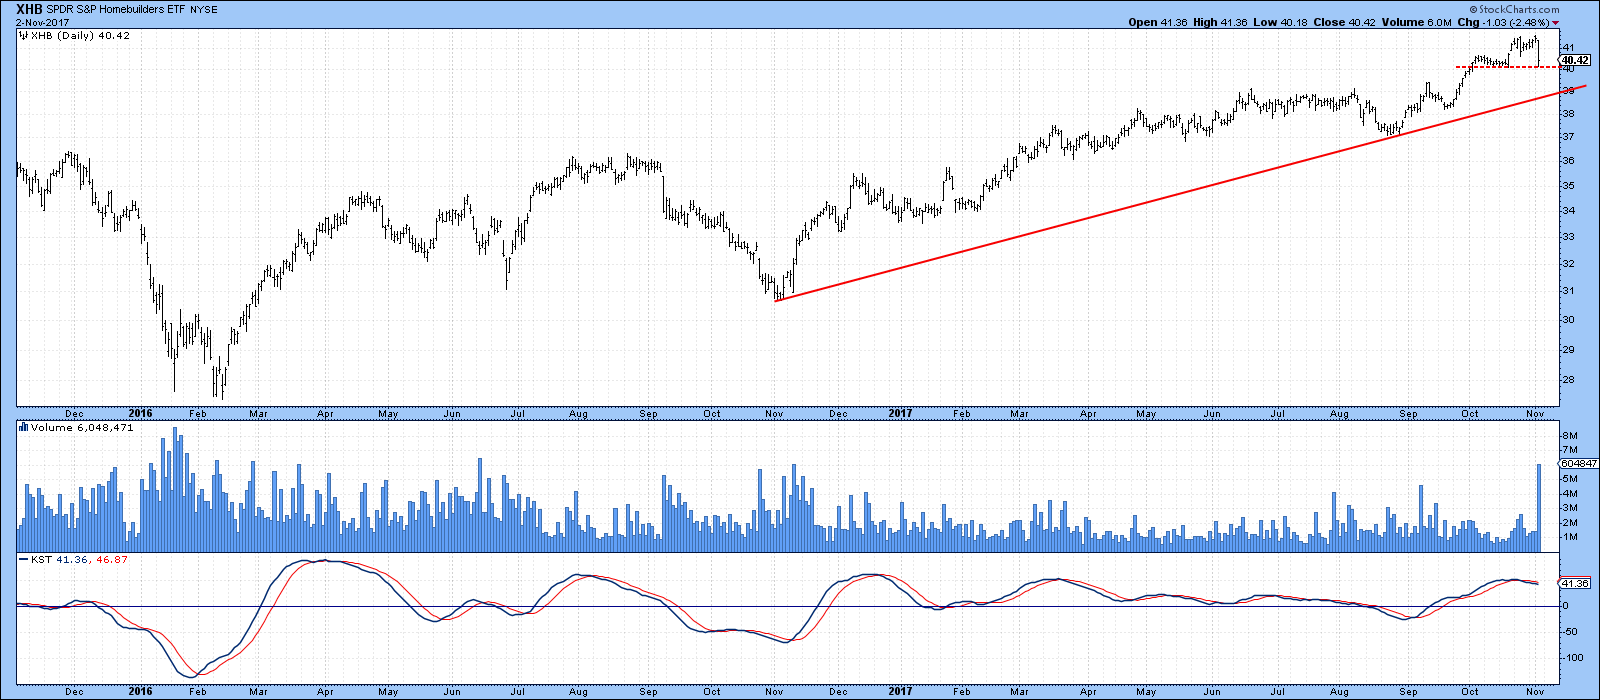
DOW JONES HOME CONSTRUCTION INDEX REACHES ELEVEN YEAR HIGH BUT STILL LOOKS CHEAP ON A RELATIVE STRENGTH BASIS -- US HOME CONSTRUCTION ISHARES ARE HAVING A STRONGER YEAR THAN THE S&P HOMEBUILDER SPDR -- ENERGY SPDR HITS ELEVEN MONTH HIGH
by John Murphy,
Chief Technical Analyst, StockCharts.com
DOW JONES HOME CONSTRUCTION INDEX REACHES ELEVEN-YEAR HIGH... Recent reports of strong home sales and home construction have boosted stocks tied to the housing sector. The low inventory of existing homes available for sale argues for even more homebuilding in the year ahead. All of which bodes well for the...
READ MORE
MEMBERS ONLY

TEN-YEAR TREASURY YIELD CLIMBS TO NINE-MONTH HIGH -- LONG-TERM TREASURY BOND CHART LOOKS BEARISH -- RELATIVE STRENGTH ANALYSIS SHOWS RISING RATES HURTING UTILITIES AND REITS -- BUT BOOSTING FINANCIALS
by John Murphy,
Chief Technical Analyst, StockCharts.com
10-YEAR TREASURY YIELD HITS NINE-MONTH HIGH ... Chart 1 shows the 10-Year Treasury yield climbing another 3 basis points today to the highest level since March (2.49%). That's most likely tied to the impending passage of the tax bill before Congress with expectations for faster economic growth and...
READ MORE
MEMBERS ONLY

10-YEAR BOND YIELD SURGES TO TWO-MONTH HIGH AND MAY BE ON VERGE OF UPSIDE BREAKOUT -- FOREIGN YIELDS ARE ALSO JUMPING -- THAT'S PUSHING BOND PRICES SHARPLY LOWER -- UTILITIES AND REITS ARE STARTING TO SHOW SERIOUS UNDERPERMANCE
by John Murphy,
Chief Technical Analyst, StockCharts.com
10-YEAR TREASURY YIELD SURGES... The daily bars in Chart 1 show the 10-Year Treasury yield ($TNX) jumping 7 basis points today to the highest level in two months in one of the biggest daily gains this year. That puts the yield within striking distance of its late October intra-day peak...
READ MORE
MEMBERS ONLY

STEEL STOCKS LEAD MATERIALS TO NEW RECORD -- STEEL ETF NEARS FIVE-YEAR HIGH -- STEEL LEADERS INCLUDE NUCOR AND STEEL DYNAMICS -- S&P METALS AND MINING SPDR ACHIEVES BULLISH BREAKOUT -- STOCKS HAVE ANOTHER STRONG DAY
by John Murphy,
Chief Technical Analyst, StockCharts.com
MATERIALS SPDR HITS NEW RECORD ... In a strong market day, materials led stocks higher. Chart 1 shows the Materials Select SPDR (XLB) breaking out to a new record. The XLB has been finding support along its 50-day average. The XLB/SPX ratio (top of chart) has been lagging behing the...
READ MORE
MEMBERS ONLY

TECHNOLOGY IS WEEK'S STRONGEST SECTOR AND HITS NEW HIGH -- SO DOES THE NASDAQ 100 -- MICROSOFT WAS ONE OF THE BIG REASONS WHY -- RUSSELL 2000 ISHARES BOUNCE OFF 50-DAY AVERAGE -- SMALL CAPS SHOULD BENEFIT FROM TAX CUT
by John Murphy,
Chief Technical Analyst, StockCharts.com
TECHNOLOGY HAS A STRONG WEEK... After leading the market higher for most of the year, technology stocks saw some profit-taking near the end of November, and have lagged behind the rest of the market since then. This week, however, technology was the market's strongest sector. And that was...
READ MORE
MEMBERS ONLY

What's The Market Going To Do When The Tax Bill Is Passed?
by Martin Pring,
President, Pring Research
* General thoughts on the discounting process
* Short-term indicators poised for, but not yet signalling a decline
General thoughts on the discounting process
There is an old adage on Wall Street to the effect that traders should, in the case of war, sell the rumor and buy on the sound of...
READ MORE
MEMBERS ONLY

DISNEY AND FOX SURGE TOGETHER -- TIFFANY BREAKS OUT WHILE NIKE CONTINUES TO RUN -- DELTA AND SOUTHWEST CLIMB TO NEW HIGHS
by John Murphy,
Chief Technical Analyst, StockCharts.com
DISNEY AND FOX SURGE ... The announcement that Walt Disney was buying $66 billion worth of assets from Fox sent both stocks surging today. And they helped make cyclical stocks the day's biggest gainer. Chart 1 shows Disney (DIS) surging more than 3% to the highest closing level since...
READ MORE
MEMBERS ONLY

RISING BOND YIELDS BOOSTS FINANCIAL STOCKS -- FINANCIAL SPDR LEADS MARKET HIGHER -- GOLDMAN SACHS SETS A NEW RECORD -- VERIZON SURGE LEADS TELECOM HIGHER -- AT&T CLEARS ITS 200-DAY AVERAGE -- EDISON INTL WEIGHS ON UTILITY SECTOR
by John Murphy,
Chief Technical Analyst, StockCharts.com
BOND YIELD IS CLIMBING... The daily bars in Chart 1 show the 10-Year Treasury Yield climbing 2 basis points to 2.40%. The 5-year Treasury Yield (not shown) has climbed to the highest level in six years. Today's strong PPI report may have something to do with that....
READ MORE
MEMBERS ONLY

INDUSTRIAL SECTOR CONTINUES TO SHOW NEW LEADERSHIP -- DOW JONES HEAVY CONSTRUCTION INDEX MAY BE NEARING UPSIDE BREAKOUT -- QUANTA SERVICES AND JACOBS ENGINEERING HAVE ALREADY BROKEN OUT -- AMONG RETAILERS, BEST BUY HITS A NEW RECORD
by John Murphy,
Chief Technical Analyst, StockCharts.com
INDUSTRIAL SECTOR CONTINUES NEW LEADERSHIP ROLE... Industrial stocks assumed a new market leadership role during November and remained in that role again this week. Chart 1 shows the Industrial Sector SPDR (XLI) gaining 1.4% during the week which made it second only to the financial sector's gain...
READ MORE
MEMBERS ONLY

Guess What? Short Term Indicators Are Saying That Bitcoin Is Getting A Bit Frothy!
by Martin Pring,
President, Pring Research
* 18-month ROC is literally off the charts
* Bitcoin and short- term momentum
* Comparing Bitcoin to the Bitcoin Trust
* Conclusion
* Links to videos on Bitcoin
18-month ROC is literally off the charts
There are two Bitcoin directly related vehicles that are available on the StockCharts platform. These are the NYSE Bitcoin...
READ MORE
MEMBERS ONLY
December 2017 Market Roundup With Martin Pring 2017-12-06
by Martin Pring,
President, Pring Research
This months Market Roundup highlights the three main assets of bonds, commodities and stocks. Rotations between these asset classes can help find major secular moves. This month shows multiple trends changing.
Market Roundup With Martin Pring 2017-12-06 from StockCharts.com on Vimeo.
Good luck and good charting,
Martin J. Pring...
READ MORE
MEMBERS ONLY

Precious Metals And Commodities Starting To Break Down
by Martin Pring,
President, Pring Research
* Gold leads commodities
* Gold, gold shares and silver complete head and shoulder patterns
* Two confidence ratios are forecasting lower gold prices
* Commodities headed lower
Gold leads commodities
Chart 1 compares the price of gold to commodities in the form of the CRB Composite. The green shaded areas represent rally periods...
READ MORE
MEMBERS ONLY

EMERGING MARKETS ISHARES FALL TO TWO-MONTH LOW -- MOST OF THE SELLING IS COMING FROM ASIA, AND TAIWAN IN PARTICULAR -- SELLING IN TAIWAN SEMICONDUCTOR IS THE MAIN REASON WHY -- SEMICONDUCTOR ETFS HAVE SLIPPED BELOW THEIR 50-DAY LINES
by John Murphy,
Chief Technical Analyst, StockCharts.com
EMERGING MARKETS ISHARES FALL TO TWO-MONTH LOW... The recent rotation out of technology stocks may be taking a toll on emerging markets which are heavily exposed to that sector. Chart 1 shows Emerging Markets iShares (EEM) falling below its 50-day average to the lowest level in two months. And it&...
READ MORE
MEMBERS ONLY

MONEY CONTINUES TO ROTATE OUT OF TECHNOLOGY AND INTO BANKS, RETAILERS, ENERGY AND TRANSPORTS -- FAANG STOCKS AND SEMICONDUCTORS WEIGH ON TECHNOLOGY SECTOR -- S&P 500 VALUE ISHARES ARE OUTPERFORMING GROWTH ISHARES
by John Murphy,
Chief Technical Analyst, StockCharts.com
CHEAPER STOCKS ARE GAINING ... The rotation into cheaper undervalued stocks that started last week is continuing today on the back of the weekend passage of the tax reform package. The relative strength lines in Chart 1 show the past week's leaders to be banks (blue line), retailers (red...
READ MORE
MEMBERS ONLY

ENERGY SHARES ARE BOUNCING ON OPTIMISM OVER OPEC AGREEMENT -- EXXON MOBIL MAY BE ON THE VERGE OF A BULLISH BREAKOUT -- CHEVRON IS NEARING A NEW RECORD HIGH -- ENERGY SHARES MAY START TO BENEFIT FROM RECENT BUYING OF CHEAP STOCK GROUPS
by John Murphy,
Chief Technical Analyst, StockCharts.com
ENERGY SHARES REBOUND ... Energy shares are finally showing some bounce. The daily bars in Chart 1 shows the Energy Sector SPDR (XLE) climbing above its 50-day average today. The XLE is bouncing off chart support along its late October low and its 200-day moving average. Those are logical chart points...
READ MORE
MEMBERS ONLY

RETAIL SPDR ACHIEVES BULLISH BREAKOUT -- TODAY'S RETAIL LEADERS INCLUDE NORDSTROM, KOHLS, AND TJX -- TRANSPORTATION AVERAGE RISES SHARPLY -- AIRLINES AND DELIVERY SERVICE STOCKS ARE HAVING A STRONG DAY
by John Murphy,
Chief Technical Analyst, StockCharts.com
S&P RETAIL SPDR BREAKS OUT TO THE UPSIDE... My Monday message showed the S&P Retail SPDR (XRT) attempting an upside breakout above its October high. Chart 1 shows the XRT accomplishing that in pretty decisive fashion over the last two days. In fact, retailers have been...
READ MORE
MEMBERS ONLY

FINANCIAL SPDR IS FINDING SUPPORT AT 50-DAY AVERAGE -- S&P BANK SPDR IS ALSO TRADING ABOVE ITS 50-DAY LINE -- BANK LEADERS INCLUDE J.P. MORGAN CHASE, REGIONS FINANCIAL, AND ZIONS BANCORP -- INSURERS ARE ALSO HAVING A STRONG DAY
by John Murphy,
Chief Technical Analyst, StockCharts.com
FINANCIAL SPDR CONTINUES TO BOUNCE OFF 50-DAY AVERAGE... My message from last Wednesday showed the Financial Sector SPDR (XLF) starting to bounce off its 50-day moving average. Chart 1 shows that the XLF continues to find support at its 50-day line. That's an encouraging sign. The gray area...
READ MORE
MEMBERS ONLY

Is The Oil Price Topping?
by Martin Pring,
President, Pring Research
* Oil experiences a major upside breakout
* Overstretched energy markets on a short-term basis
* Where oil goes commodities in general often follow
I recently came across a commitment of traders hedgers chart that shows a record low short position. Now it’s true that since the 1990’s there has been...
READ MORE
MEMBERS ONLY

RETAIL SPDR CHALLENGES OCTOBER HIGH -- ITS LONGER RANGE CHART SUGGESTS BASING ACTIVITY -- APPAREL RETAILERS HAVE TURNED UP -- LEADERS INCLUDE BURLINGTON STORES, GAP, AND URBAN OUTFITTERS -- INVESTORS ARE BUYING TIPS AS A HEDGE AGAINST RISING INFLATION
by John Murphy,
Chief Technical Analyst, StockCharts.com
S&P 500 RETAIL SPDR ATTEMPTS UPSIDE BREAKOUT ... Retail stocks may have a strong holiday season after all. Chart 1 shows the S&P 500 Retail SPDR (XRT) trying to clear its early October high near 42. That would put it at the highest level in six months....
READ MORE
MEMBERS ONLY

SEVERAL UNUSUAL FACTORS ARE CONTRIBUTING TO THE FLATTENING YIELD CURVE -- LOW INFLATION IS HELPING KEEP BOND YIELDS DOWN -- SO IS THE FACT THAT FOREIGN BOND YIELDS ARE MUCH LOWER THAN TREASURIES
by John Murphy,
Chief Technical Analyst, StockCharts.com
YIELD CURVE FALLS TO LOWEST LEVEL IN A DECADE ... I've been reading a lot about the yield curve falling to the lowest level since 2007 and the potential warning that carries. The green bars in Chart 1 plot the spread between 10-year and 2-year Treasury yields (the yield...
READ MORE
MEMBERS ONLY

DOLLAR INDEX IS WEAKENING -- THAT MAY BE HELPING COMMODITIES -- THE BLOOMBERG COMMODITY INDEX IS BOUNCING OFF ITS 50-DAY AVERAGE -- CRUDE OIL TOUCHES TWO-YEAR HIGH -- ENERGY SPDR IS BOUNCING OFF CHART SUPPORT -- SO ARE TRANSPORTS AND FINANCIALS
by John Murphy,
Chief Technical Analyst, StockCharts.com
DOLLAR INDEX THREATENS ITS 50-DAY AVERAGE... The U.S. dollar is in retreat today against most major foreign currencies. Chart 1 shows the PowerShares Dollar Index Fund (UUP) threatening to drop below its 50-day moving average (blue line). That would be the first time the UUP has slipped below that...
READ MORE
MEMBERS ONLY

Small Caps Break To The Upside Big Time
by Martin Pring,
President, Pring Research
* Small Caps breaking out
* Gold and Silver may be close to a resolution to their recent rangebound activity
* Euro in a real dilemma but with a bullish bias
In sorting through a number of charts I recently came across some potential price patterns that are developing in several key markets....
READ MORE
MEMBERS ONLY

GLOBAL STOCKS ARE HAVING A STRONG DAY -- HIGH YIELD BOND ETF IS BOUNCING SHARPLY OFF CHART SUPPORT -- MOST OF ITS RECENT SELLING HAS BEEN IN THE TELECOM SECTOR -- INDIVIDUAL TELECOM STOCKS ARE REBOUNDING FROM OVERSOLD CONDITIONS
by John Murphy,
Chief Technical Analyst, StockCharts.com
HIGH YIELD BOND ISHARES BOUNCE SHARPLY OFF 200-DAY AVERAGE... The recent selloff in high yield junk bonds has attracted a lot of attention in the financial media. My Tuesday message showed the iBoxx High Yield Corporate Bond iShares (HYG) headed down for a test of chart support at its August...
READ MORE
MEMBERS ONLY

Commodities: Are They About To Experience A Pause?
by Martin Pring,
President, Pring Research
The long-term picture
* Is the stock market smarter than the commodity market?
* Commodity indexes short-term overbought
The long-term picture
Since mid-summer, commodity prices reflected in broadly based indexes such as the CRB ($CRB), Bloomberg Commodity ETN (DJP) or the DB Commodity ETF (DBC) have been on a tear. However, short-term...
READ MORE
MEMBERS ONLY

STOCKS TAKE ON A MORE DEFENSIVE TONE AS STAPLES AND UTILITIES TAKE THE LEAD -- UTILITIES HIT NEW RECORD -- JUNK BOND SELLOFF IS ANOTHER CAUTION SIGNAL -- SELLOFF IN DOLLAR MAY BE PUSHING SOME DEFENSIVE MONEY BACK INTO GOLD
by John Murphy,
Chief Technical Analyst, StockCharts.com
UTILITIES HIT NEW RECORD ... With the rest of the market on the defensive, utility stocks are having another strong day. Chart 1 shows the Utilities Sector SPDR (XLU) climbing to another record high today. Utilities are the day's strongest sector (along with consumer staples), while all other sectors...
READ MORE
MEMBERS ONLY

TEN-YEAR TREASURY YIELD GAPS HIGHER -- 20-YEAR TREASURY BOND ISHARES GAP DOWN AND LOOK TOPPY -- THEIR LONGER-RANGE CHART ALSO SUGGESTS A MAJOR BOND TOP IN THE MAKING -- FINANCIAL SPDR AND SMALL CAPS ARE TESTING SUPPORT AT THEIR 50-DAY AVERAGES
by John Murphy,
Chief Technical Analyst, StockCharts.com
TEN-YEAR TREASURY YIELD BOUNCES OFF 200-DAY AVERAGE... My Wednesday message showed the 10-Year Treasury Yield ($TNX) testing its 200-day moving average. Chart 1 shows the TNX gapping 7 basis points higher today after finding support at its 200-day line. I also mentioned on Wednesday that the 10-Year Treasury yield was...
READ MORE
MEMBERS ONLY

Growth Is Breaking Out Against Value
by Martin Pring,
President, Pring Research
Growth versus value and a possible mega breakout favoring growth
* The technology/staples ratio supports the growth/value breakout
* Some credit spreads are looking shaky
* Are stocks finally breaking against commodities?
Growth versus value and a possible mega-breakout favoring growth
Chart 1 compares the performance of the S&P...
READ MORE
MEMBERS ONLY

TEN-YEAR TREASURY YIELD REMAINS IN SHORT-TERM PULLBACK -- IT'S BEING HELD BACK BY EVEN WEAKER FOREIGN YIELDS -- THAT EXPLAINS RECENT WEAKNESS IN FOREIGN CURRENCIES -- COMMODITY PRICES CONTINUE TO STRENGTHEN
by John Murphy,
Chief Technical Analyst, StockCharts.com
TEN-YEAR TREASURY YIELD IS PULLING BACK ... After reaching the highest level in seven months during October, the 10-Year Treasury Yield ($TNX) has experienced a pullback. Chart 1 shows, however, that pullback in the TNX over the last two weeks hasn't been enough to reverse its general uptrend. It...
READ MORE
MEMBERS ONLY

WTIC CRUDE OIL CLOSES AT TWO-YEAR HIGH -- ENERGY SHARES WERE THIS WEEK'S STRONGEST SECTOR -- ENERGY SHARES ARE LAGGING TOO FAR BEHIND THE RISING COMMODITY -- THE WTIC/XLE RATIO ALSO BREAKS OUT TO TWO-YEAR HIGH
by John Murphy,
Chief Technical Analyst, StockCharts.com
WTIC COMPLETES BULLISH BREAKOUT... The weekly bars in Chart 1 show WTIC Light Crude Oil ending the week above its early 2017 peak near $55 for the first time in more than two years. That upside breakout puts WTIC in sync with Brent Crude Oil which rose over $60 for...
READ MORE
MEMBERS ONLY

CRUDE OIL IS TRADING OVER $55 FOR FIRST TIME IN TWO YEARS -- THAT'S BOOSTING ENERGY SHARES -- OIL & GAS EXPLORATION AND PRODUCTION SPDR IS ENERGY LEADER -- XOP LEADERS INCLUDE CONCHO RESOURCES, EOG RESOURCES, AND DIAMONDBACK ENERGY
by John Murphy,
Chief Technical Analyst, StockCharts.com
WTIC CRUDE OIL ATTEMPTING BULLISH BREAKOUT OVER $55... My Wednesday message showed Brent Crude Oil trading over $60 for the first time in more than two years. Brent is trading over $62 today. It also showed West Texas Intermediate Crude Oil (WTIC) trying to break through overhead resistance at $55....
READ MORE
MEMBERS ONLY
Homebuilders Hit By Tax Reform
by Martin Pring,
President, Pring Research
* SPDR Homebuilder ETF (XHB)
* iShares Home Construction ETF (ITB)
* Euro and yen looking vulnerable
Limitations being proposed for the popular interest rate deduction on tax filings hit the two homebuilder ETF’s for six on Thursday. These are the SPDR Homebuilder ETF (XHB) and the iShares Home Construction ETF (ITB)...
READ MORE
MEMBERS ONLY

BLOOMBERG COMMODITY INDEX RISES TO EIGHT MONTH HIGH -- BASE METALS ETF REACHES HIGHEST LEVEL IN FOUR YEARS -- BRENT CRUDE OIL EXCEEDS $60 FOR FIRST TIME IN TWO YEARS
by John Murphy,
Chief Technical Analyst, StockCharts.com
BLOOMBERG COMMODITY INDEX REACHES EIGHT-MONTH HIGH... With all of the attention focused on daily stock market records, it may be going unnoticed that commodity prices are starting to show some decent gains. The weekly bars in Chart 1 show the Bloomberg Commodity Index ($BCOM) rising to the highest level in...
READ MORE
MEMBERS ONLY

BIG GAINS IN AMAZON, INTEL, MICROSOFT, GOOGLE, AND FACEBOOK PUSH NASDAQ 100 TO NEW RECORD -- AMAZON'S 13% GAIN HELPS LEAD CONSUMER CYCLICALS TO UPSIDE BREAKOUT -- INTEL AND MICROSOFT LEAD TECHNOLOGY SECTOR HIGHER
by John Murphy,
Chief Technical Analyst, StockCharts.com
NASDAQ 100 GAPS TO NEW RECORD ON FRIDAY... It started after the market closed on Thursday when a raft of big internet and technology stocks reported huge earnings which pushed their stock prices higher in after-market trading. It continued on Friday when those stocks scored explosive gains on strong volume....
READ MORE
MEMBERS ONLY

Short-term Indicators Signaling Trouble Ahead?
by Martin Pring,
President, Pring Research
* Global short-term indicators start to go bearish near-term
* VIX and other US oscillators showing signs of vulnerability
Global short-term indicators start to go bearish near-term
A couple of weeks ago I suggested that several short-term indicators were hinting at a near-term downside or range bound correction. Usually, I put in...
READ MORE
MEMBERS ONLY

10-YEAR BOND YIELD HITS FIVE-MONTH HIGH -- UK AND GERMAN BOND YIELDS ALSO TURN UP -- 3% UK INFLATION INCREASES ODDS FOR RATE HIKE AND BOOSTS POUND -- ECB IS EXPECTED TO REDUCE BOND PURCHASES
by John Murphy,
Chief Technical Analyst, StockCharts.com
TEN-YEAR TREASURY YIELD REACHES SEVEN-MONTH HIGH ... Treasury bond yields are leading an upturn in global bond yields. Chart 1 shows the 10-Year Treasury Yield ($TNX) rising to the highest level since March. Part of the reason for the upside breakout in the TNX is that foreign yields are also rising....
READ MORE