MEMBERS ONLY

CHINA A-SHARES REACH EIGHT-MONTH HIGH ON STRONG VOLUME -- SHANGHAI STOCK INDEX ALSO ACHIEVES BULLISH BREAKOUT -- ANNOUNCEMENT OF SHENZHEN-HONG KONG STOCK CONNECT SHOULD BOOST INTEREST IN MAINLAND CHINESE STOCKS

by John Murphy,
Chief Technical Analyst, StockCharts.com
CSI 300 CHINA A-SHARES COMPLETE CHART BOTTOM ... Last Friday's market message showed a big rise in the Hong Kong stock market, and suggested that mainland A-Shares might be starting to turn up as well. They did that this week. Chart 1 shows the Deutsche X-trackers CSI 300 China...
READ MORE
MEMBERS ONLY

FALLING GREENBACK BOOSTS CANADIAN DOLLAR -- IT'S ALSO PUSHING COMMODITY PRICES HIGHER -- ENERGY SPDR ACHIEVES BULLISH BREAKOUT -- OIL SERVICE ETF IS ALSO TURNING UP -- ENERGY LEADERS ARE SCHLUMBERGER, BAKER HUGHES, AND MARATHON OIL
by John Murphy,
Chief Technical Analyst, StockCharts.com
FALLING DOLLAR BOOSTS COMMODITY CURRENCIES... The falling U.S. dollar continues to support commodity prices and currencies tied to commodities. Chart 1 shows the PowerShares Dollar Index (UUP) falling to the lowest level in two months. A falling dollar is positive for foreign currencies, especially those of commodity producing countries....
READ MORE
MEMBERS ONLY

Is It Time To Emphasize Commodities And Reduce Bond Exposure?

by Martin Pring,
President, Pring Research
* The Six Stages
* Characteristics of Stage IV
* The stock market’s view on commodities
* All that glitters
The Six Stages
In the latest bi-weekly Market Round Up Webinar I looked at several inter-asset relationships to see which ones are likely to outperform going forward (watch the webinar here). To start...
READ MORE
MEMBERS ONLY

COMMODITY CURRENCIES CONTINUE TO STRENGTHEN -- CANADIAN DOLLAR MAY BE TURNING UP -- EMERGING MARKET CURRENCIES RISE WITH STOCKS -- HONG KONG STOCKS HAVE BEEN CHINESE LEADERS -- BUT A-SHARES MAY BE BOTTOMING AS YUAN STABILIZES
by John Murphy,
Chief Technical Analyst, StockCharts.com
CANADIAN DOLLAR STRENGTENS ... My Tuesday message wrote about the fact that stock ETFs in Canada and Mexico were looking stronger. I also mentioned their stronger currencies resulting from the rebound in crude oil and other commodity prices. With oil rebounding some more this week, commodity currencies in Australia, Canada, Mexico,...
READ MORE
MEMBERS ONLY

The World Order May Be Changing
by Martin Pring,
President, Pring Research
* The S&P 500 versus the world
* If things go against the US, where would be a good place to be?
* A true contrarian play
The S&P 500 versus the world
For several years the US stock market has been outperforming the rest of the world in...
READ MORE
MEMBERS ONLY

MSCI ALL WORLD STOCK INDEX HITS 12-MONTH HIGH -- VANGUARD ALL-WORLD EX US ETF ACHIEVES BULLISH BREAKOUT -- CANADIAN STOCKS CONTINUE TO CLIMB -- BRAZIL ISHARES HAVE STRONG YEAR -- MEXICO ISHARES MAY BE TURNING UP -- GERMAN STOCKS LEAD EUROPE HIGHER
by John Murphy,
Chief Technical Analyst, StockCharts.com
MSCI ALL COUNTRY WORLD INDEX HITS 12-MONTH HIGH ... Chart 1 shows the MSCI All Country World Index iShares (ACWI) trading at the highest level since last July. The index of world stocks recently broke through a "neckline" drawn over its November/May highs. The ACWI includes stocks in...
READ MORE
MEMBERS ONLY

The Technical Case For A Major Reversal In Bond Yields
by Martin Pring,
President, Pring Research
Two charts that may soon look to the bullish side for rates
Short-term technicals
Watch those metals
In the last 35 years, analysts and investors have gotten used to seeing ever lower rates, even negative ones in Europe and Japan. It seems to me that things may be getting out...
READ MORE
MEMBERS ONLY
Bearish Short-Term Equity Indicators May Bring Tears To The Bears Themselves!
by Martin Pring,
President, Pring Research
* Short-term technicals
* Two indicators that have not yet gone bullish
* More base building by commodities
* Oil greasing the way?
Last week we looked at some of the longer-term equity indicators. I concluded that prices were likely to work their way significantly higher for the balance of the year, despite historically...
READ MORE
MEMBERS ONLY

STRONG JOB REPORT PUSHES STOCKS AND BOND YIELDS HIGHER WITH FINANCIALS IN THE LEAD -- BANK, BROKER, AND INSURANCE ETFS STRENGHEN -- LEADERS INCLUDE BANK OF AMERICA, CHARLES SCHWAB, AND LINCOLN NATIONAL
by John Murphy,
Chief Technical Analyst, StockCharts.com
STRONG JOB REPORT PUSHES BOND YIELDS HIGHER... An unusually strong July job report is causing more optimism in financial markets. When that happens, stock prices usually rise and bond prices fall which is what's happening today. When bond prices fall, bond yields jump which is also happening. Chart...
READ MORE
MEMBERS ONLY

JUMP IN 10-YEAR JAPANESE BOND YIELD MAY BE HINTING AT TREASURY YIELD BOTTOM -- BOND PRICES ARE STARTING TO WEAKEN -- SO ARE BOND PROXIES -- BANKS AND FINANCIALS STRENGTHEN
by John Murphy,
Chief Technical Analyst, StockCharts.com
10-YEAR JAPANESE YIELD SURGES TO FOUR MONTH HIGH... Chart 1 show the 10-Year Japanese Bond yield surging over the last week to the highest level since March. That's the biggest weekly jump in recent memory. Last Friday's disappointing BOJ bond buying program followed by yesterday'...
READ MORE
MEMBERS ONLY
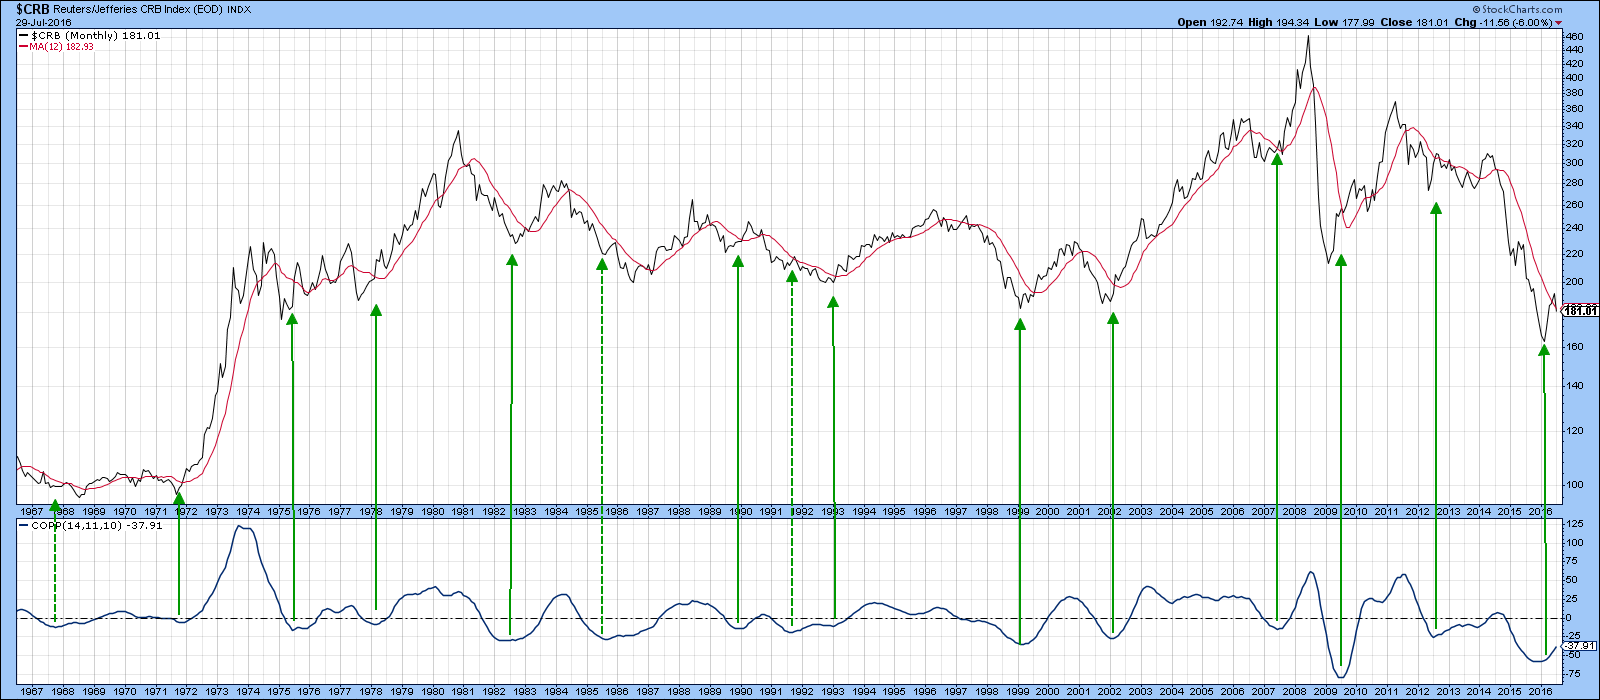
Are Commodities About To Take Off?
by Martin Pring,
President, Pring Research
* The long-term trend
* Shorter-term aspects
* The stock market’s view
Several weeks ago I suggested that commodity prices were likely to experience a correction of some kind. I also felt that any digestive process might well take the form of the right shoulder of an inverse head and shoulders pattern...
READ MORE
MEMBERS ONLY

DOLLAR DROPS ON WEAK GDP REPORT -- YEN SURGES ON BOJ DISAPPOINTMENT -- BLOOMBERG COMMODITY INDEX BOUNCES OFF TRENDLINE -- EMERGING MARKETS ISHARES HIT 12-MONTH HIGH -- EAFE ISHARES NEAR TEST OF SPRING HIGHS -- QQQ TOUCHES NEW RECORD
by John Murphy,
Chief Technical Analyst, StockCharts.com
DOLLAR DROPS AS YEN SURGES... A combination of factors are pushing the U.S. Dollar sharply lower. One is today's report of GDP growing only 1.2% in the second quarter. That pushed Treasury yields lower and bond prices higher and weakened the dollar. Chart 1 shows the...
READ MORE
MEMBERS ONLY

Better Days Lie Ahead
by Martin Pring,
President, Pring Research
* More long-term US Equity indicators turning bullish
* The case for a spirited rally
* Testing the theory
At my webinar last week I pointed out a couple of observations on the US equity market. First, that more and more indicators are signaling a bull market. Second, there are some characteristics that...
READ MORE
MEMBERS ONLY

NASDAQ GETS BOOST FROM APPLE AND BIOTECHS -- APPLE SURGES 7% HIGHER ON STRONG VOLUME -- TECH SPDR HITS NEW HIGH -- BIOTECH SPDR RISES TO SIX-MONTH HIGH AS AMGEN BUILDS ON BULLISH BREAKOUT -- PHARMACEUTAL ETF ALSO COMPLETES BASE
by John Murphy,
Chief Technical Analyst, StockCharts.com
POWERSHARES QQQ NEARS OLD HIGH... Chart 1 shows the PowerShares QQQ climbing again today and in the process of testing its early December high at 114.75. The QQQ achieved a bullish breakout earlier this month and has shown market leadership since then. That can be seen by the rising...
READ MORE
MEMBERS ONLY

TECHNOLOGY SHOWS NEW MARKET LEADERSHIP -- EBAY, MICROSOFT, AND QUALCOMM GAP HIGHER -- CISCO ACHIEVES BULLISH BREAKOUTS -- NASDAQ NEARS OLD HIGHS -- BIOGEN AND AMGEN LEAD BIOTECHS HIGHER -- HEALTHCARE PROVIDERS HAVE STRONG WEEK
by John Murphy,
Chief Technical Analyst, StockCharts.com
TECHNOLOGY SPDR SHOWS NEW LEADERSHIP... Stocks had another good week with the Dow and S&P 500 ending Friday at new records. One of the other positive developments was new upside leadership by technology which was the week's strongest sector. Chart 1 shows the Technology Sector SPDR...
READ MORE
MEMBERS ONLY

What's Up/Down With The Dollar?
by Martin Pring,
President, Pring Research
* The Dollar Index-too heavily weighted in favor of the Euro
* A closer look at the long-term cross Dollar relationships
* What are the Dollar sympathy indicators saying?
* Short-term technicals
The Dollar Index - Too heavily weighted in favor of the Euro
A few months ago I declared the Dollar Index to...
READ MORE
MEMBERS ONLY

HOMEBUILDERS LEAD ITB HIGHER -- LENNAR MAY BE NEXT HOMEBUILDER TO BREAK OUT -- THE XHB OFFERS BROADER EXPOSURE TO HOUSING-RELATED STOCKS -- OWENS CORNING IN STRONG UPTREND WHILE USG IS BREAKING OUT -- MOHAWK NEARS UPSIDE BREAKOUT AS WHIRLPOOL RALLIES
by John Murphy,
Chief Technical Analyst, StockCharts.com
US HOME CONSTRUCTION ISHARES TURN UP ... Several of my recent messages have written about the upturn in homebuilding shares. A lot of that has been due to the drop in bond yields and mortgage rates. Improvement in the housing area is also an encouraging sign for the economy. Chart 1...
READ MORE
MEMBERS ONLY

Equity Markets Start To Broaden Their Appeal
by Martin Pring,
President, Pring Research
* Whipsaw leads to sharp rally
* Global equity markets starting to heat up
* Broad sector participation
* What’s going on with the yield curve?
Whipsaw leads to sharp rally
Chart 1 compares the Dow ETF (DIA) with my Dow Diffusion Indicator, an oscillator that monitors a basket of Dow Stocks above...
READ MORE
MEMBERS ONLY

GLOBAL STOCKS RESUME UPTREND -- ALL WORLD STOCK INDEX EXTENDS BULLISH BREAKOUT -- ASIAN EX JAPAN ISHARES TURN UP -- WILSHIRE 5000 INDEX NEARS RECORD -- TRANSPORTS NEAR TEST OF APRIL HIGH -- RAILS COMPLETE BASING PATTERN
by John Murphy,
Chief Technical Analyst, StockCharts.com
MSCI ALL COUNTRY WORLD INDEX ISHARES BUILDS ON BULLISH BREAKOUT... Global stocks resumed their uptrend today in a replay of Tuesday's shift toward riskier assets. Chart 1 shows the MSCI All Country World Stock Index iShares (ACWI) building on its bullish breakout that took place on Tuesday when...
READ MORE
MEMBERS ONLY

REBOUND IN GLOBAL BOND YIELDS AND BRITISH POUND ACCELERATE RISK ON TRADE AS GOLD AND YEN SELL OFF -- EMERGING MARKETS ACHIEVE BULLISH BREAKOUT -- SO DO ALL COUNTRY WORLD INDEX ISHARES
by John Murphy,
Chief Technical Analyst, StockCharts.com
TREASURY YIELDS REBOUND ALONG WITH STERLING... A surge in global bond yields is contributing to a rotation out of safe havens and into riskier assets. Chart 1 shows the 10-Year Treasury Yield gapping 9 basis points higher to 1.52%. That puts the TNX back above its July 2012 closing...
READ MORE
MEMBERS ONLY
Breakout Or Fakeout
by Martin Pring,
President, Pring Research
* Take a deep 'breadth'
* Broadening formations
* Long-term indicators support an upside breakout
The recent breakout by the S&P and Dow to new high ground has caught the attention of market observers. Some say that the market is overvalued and that prices are unlikely to move higher....
READ MORE
MEMBERS ONLY

MAJOR STOCK INDEXES NEAR RECORD HIGHS -- NYSE COMPOSITE INDEX NEARS UPSIDE BREAKOUT -- SMALL CAPS TURN HIGHER -- CONSUMER DISCRETIONARY AND INDUSTRIAL ETFS ACHIEVE BULLISH BREAKOUTS -- INTEL AND SEMICONDUCTRS LEAD NASDAQ HIGHER
by John Murphy,
Chief Technical Analyst, StockCharts.com
MAJOR STOCK INDEXES NEAR NEW RECORDS... A strong job report on Friday helped push stocks close to record highs. Chart 1 shows the Dow Jones Industrial Average jumping 250 points (1.4%) on Friday to reach a two-month high. A test of its April high is imminent. The S&...
READ MORE
MEMBERS ONLY

Why The June Employment Report Is Worth Closer Attention Than Usual
by Martin Pring,
President, Pring Research
* Labor market crystal ball
* What are the credit markets saying
* Commodities ripe for a correction?
Labor market crystal ball
The weakness of last month’s Employment Report was a surprise to just about everyone, including yours truly. One month doesn’t make a trend, but two months of bad data...
READ MORE
MEMBERS ONLY

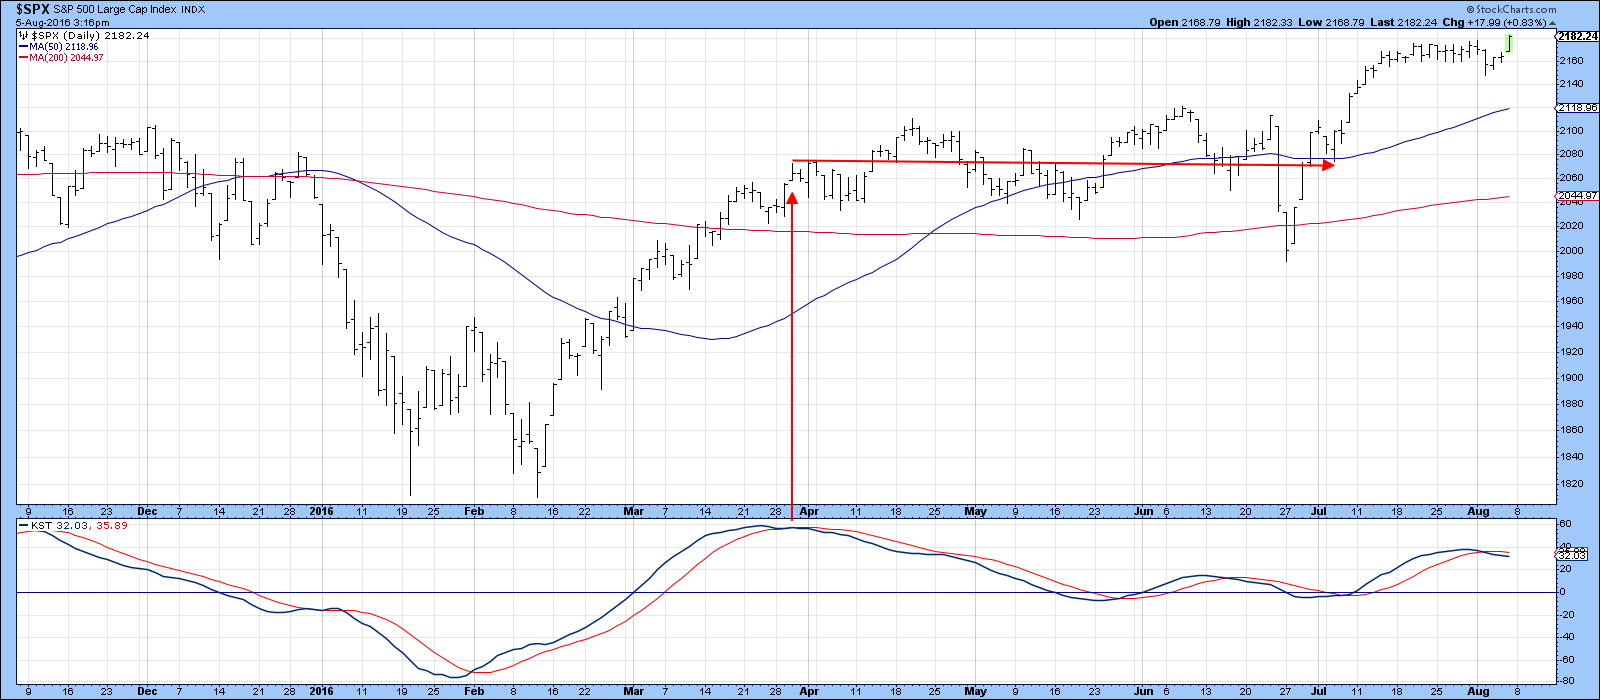
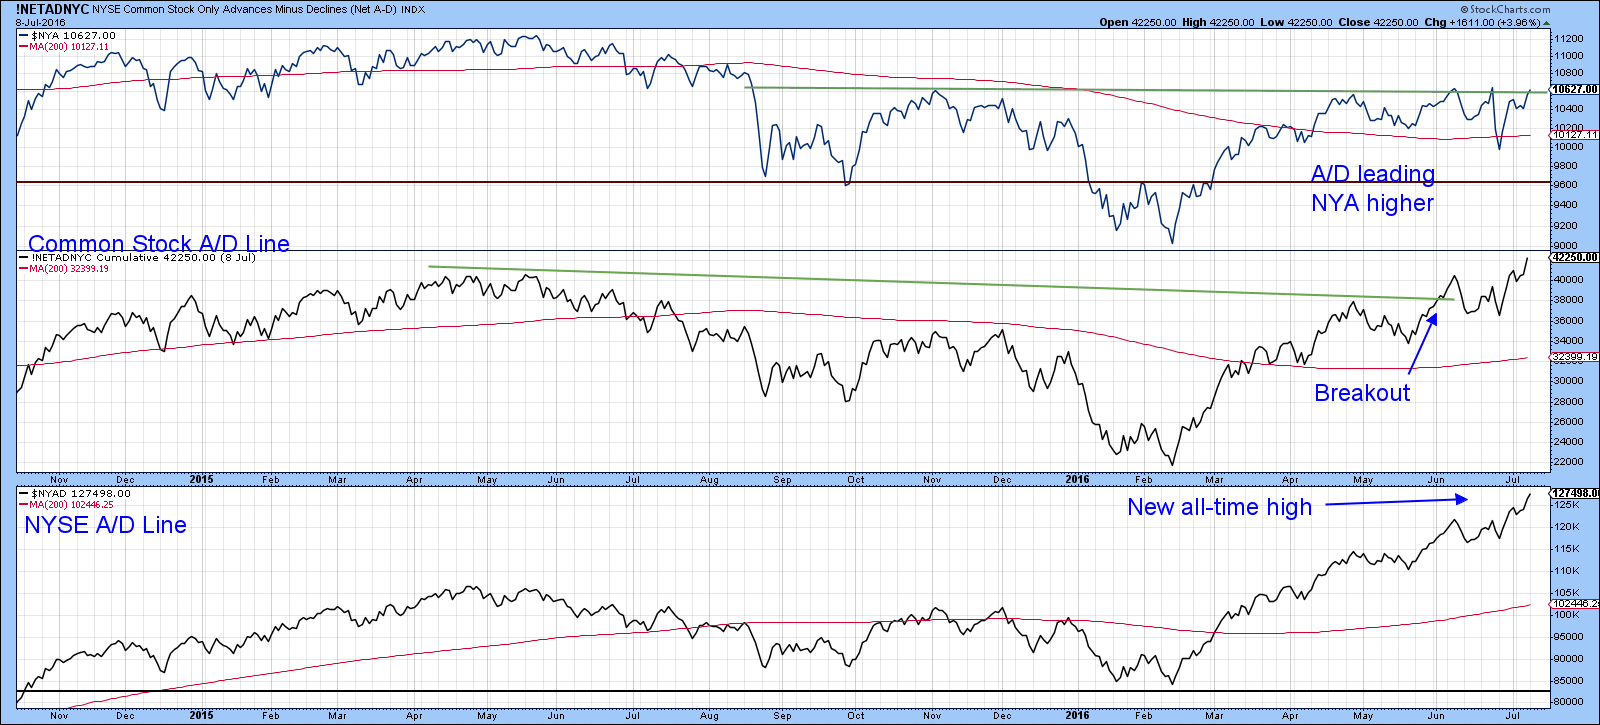
TECHNICAL ODDS FAVOR HIGHER STOCK PRICES -- ON BALANCE VOLUME FOR NYSE INDEX HITS NEW HIGH FOR THE YEAR -- BOTH VERSIONS OF THE NYSE ADVANCE DECLINE LINE HIT NEW RECORDS
by John Murphy,
Chief Technical Analyst, StockCharts.com
UPSIDE BREAKOUT IN NYSE COMPOSITE INDEX STILL LOOKS LIKELY... My May 25 market message suggested that the stock market still had more work to do on the upside. That was based primarily on Elliott Wave Analysis which suggested that the market was still in a Wave 4 correction/consolidation pattern...
READ MORE
MEMBERS ONLY

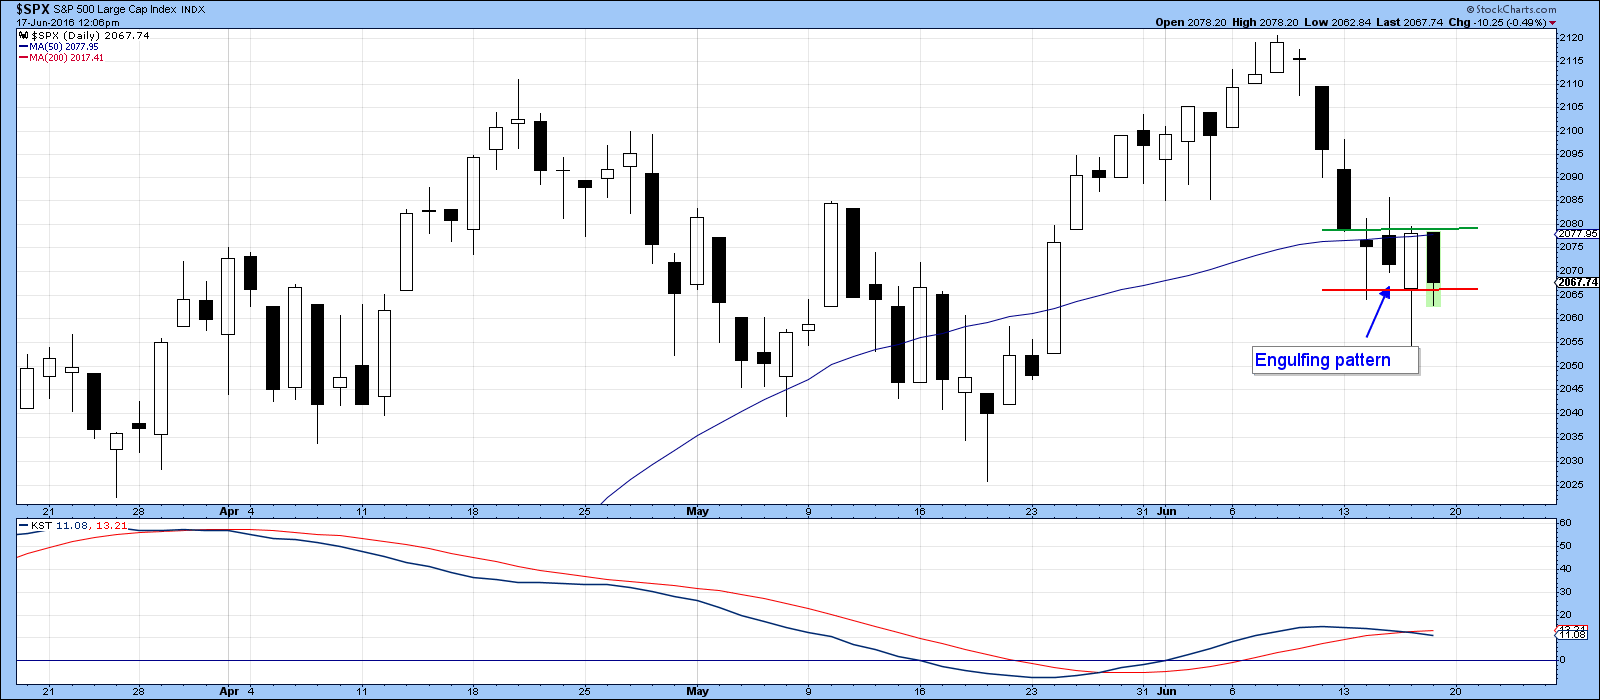
DOW AND S&P 500 BOUNCE OFF 50-DAY AVERAGES -- NASDAQ REGAINS 200-DAY LINE -- CELGENE AND MERCK LEAD HEALTHCARE SPDR TO HIGHEST LEVEL SINCE AUGUST -- HOMEBUILDERS LEAD CYLICALS HIGHER AS DR HORTON BREAKS OUT -- FACEBOOK HAS STRONG DAY
by John Murphy,
Chief Technical Analyst, StockCharts.com
MARKET HAS UPSIDE REVERSAL DAY ... After trading lower this morning, stocks rallied this afternoon to respectable gains. That upside reversal also helped the Dow Industrials and S&P 500 bounce off their 50-day moving averages as shown in Charts 1 and 2. Chart 3 shows the Nasdaq Composite Index...
READ MORE
MEMBERS ONLY

TREASURY YIELD FALLS TO FOUR-YEAR LOW -- LOWER MORTGAGE RATES ARE BOOSTING HOMEBUILDERS -- HOME CONSTRUCTION ETF NEARS UPSIDE BREAKOUT -- KBH HAS ALREADY BROKEN OUT -- OIL SERVICE ETF CONTINUES TO SHOW LEADERSHIP -- TRANSOCEAN CLEARS 200-DAY LINE
by John Murphy,
Chief Technical Analyst, StockCharts.com
10-YEAR TREASURY YIELD TESTING 2012 LOW... The plunge in global bond yields continues. Yesterday's statement from the Bank of England of its intention to lower rates sometime this summer pushed the British 2-year yield into negative territory for the first time, and its 10-Year to another record low...
READ MORE
MEMBERS ONLY

ALL COUNTRY WORLD INDEX REGAINS 200-DAY LINE -- EMERGING MARKETS LEAD GLOBAL REBOUND -- BRAZIL AND CHINESE ETFS STRENGTHEN -- ENERGY AND HEALTHCARE SPDRS CLEAR 50-DAY LINES -- OTHER SECTOR ETFS TURN BACK UP -- S&P 500 RETAKES 200-DAY LINE
by John Murphy,
Chief Technical Analyst, StockCharts.com
MSCI ALL COUNTRY WORLD INDEX BACK OVER 200-DAY AVERAGE... Investor confidence is returning to global stocks after the short-term panic caused by last Friday's Brexit vote. Improvement is being seen in both developed and emerging markets. Chart 1 shows the MSCI All Country World Index (ACWI) climbing back...
READ MORE
MEMBERS ONLY

EUROPEAN MARKETS LEAD STOCK BOUNCE -- EUROPEAN STOCK INDEX TESTS FEBRUARY LOW -- YIELD ON BRITISH BOND FALLS BELOW 1% -- 10 YEAR TREASURY YIELD MAY TEST 2012 BOTTOM -- EURO DROP IS ALSO BOOSTING DOLLAR
by John Murphy,
Chief Technical Analyst, StockCharts.com
EUROPEAN STOCKS LEAD GLOBAL BOUNCE ... A rebound in European stocks is leading a rebound in the states. Chart 1 shows the Dow Jones Europe Ex UK Index climbing 2.5%. France and Germany are up a similar amount. What may be significant from a charting standpoint is that the index...
READ MORE
MEMBERS ONLY

GLOBAL STOCK SELLOFF CONTINUES -- BRITISH POUND HITS NEW LOW -- EUROPEAN STOCKS HIT HARD AGAIN -- US STOCK INDEXES BREAK MAY LOW -- DOW AND S&P 500 FALL BELOW 200-DAY LINES -- TELECOM, UTILITIES, AND REITS BENEFIT FROM PLUNGING BOND YIELDS
by John Murphy,
Chief Technical Analyst, StockCharts.com
U.S. STOCK INDEXES BREAK CHART SUPPORT... The global selling of stocks that started on Friday continued into today. Big losses in Europe signaled another bad day. The British Pound fell to another 30-year low (Chart 1). Chart 2 shows London's FTSE 100 losing more than 2% and...
READ MORE
MEMBERS ONLY

Trend Of US Equities Slipping In A Southerly Direction
by Martin Pring,
President, Pring Research
* Low momentum close to price highs is often followed by above-average declines
* Failed patterns are often followed by above average price moves
* Those credit spreads are widening again
Last week I wrote that there were some positive short-term signs that suggested the reaction to Brexit might be overdone. Monday’s...
READ MORE
MEMBERS ONLY

BREXIT VOTE HAMMERS GLOBAL STOCKS -- BRITAIN AND EUROPE LEAD DECLINES -- GOLD, TREASURIES, AND THE YEN SOAR -- RISING DOLLAR PUNISHES OTHER COMMODITIES -- VIX SURGES TO 2016 HIGH -- US STOCK INDEXES HEAD TOWARD MAY LOWS
by John Murphy,
Chief Technical Analyst, StockCharts.com
WORLD MARKETS ARE SHOCKED AT BRITISH VOTE... Even though polls showed the British vote to be very close, a lot of money bet that the Brits would vote to stay in the European Union. That was true with London bookies and global investors. Strong currency and stock action on Wednesday...
READ MORE
MEMBERS ONLY

Brexit Or Bropportunity? What The Charts Are Saying
by Martin Pring,
President, Pring Research
* Selling climax at the opening
* UK versus European Monetary Union
* What are global equities saying?
* What’s up with the pound?
Selling climax at the opening
There is an old saying on Wall Street that the market does not discount the same thing twice. Back in early June, we saw...
READ MORE
MEMBERS ONLY

BRITISH POUND AND UK STOCKS STRENGTHEN -- UK ISHARES HIT SEVEN- MONTH HIGH -- EUROPEAN SHARES ARE ALSO RISING -- DOW JONES EUROPE INDEX LOOKS TO BE BOTTOMING -- WEEKLY CHART OF WILSHIRE 5000 COMPOSITE STOCK INDEX STILL LOOKS POSITIVE
by John Murphy,
Chief Technical Analyst, StockCharts.com
STERLING SHOULD BE BOTTOMING... I'm going to take the chance of ignoring the British vote on Thursday and concentrate instead on the charts themselves. If it's true that markets have a way of discounting (or anticipating) events, that's the best we can do. The...
READ MORE
MEMBERS ONLY

BRITAIN LEADS GLOBAL STOCK RALLY -- POUND SURGES 2% -- SAFE HAVEN ASSETS LIKE BONDS AND GOLD SELL OFF -- WEAK DOLLAR BOOSTS COPPER AND OIL -- S&P 500 GIVES BACK HALF ITS GAINS BY THE CLOSE
by John Murphy,
Chief Technical Analyst, StockCharts.com
UK LEADS GLOBAL RALLY ... Stocks around the world started the week on a strong note which appears to be tied to shifting sentiment in Britain. Chart 1 shows the British Pound surging more than 2% for its biggest gain in years. British stocks are sharply higher as well. Chart 2...
READ MORE
MEMBERS ONLY

EUROPEAN MARKETS BOUNCE ON FRIDAY BUT REMAIN IN DOWNTRENDS -- GOLD AND YEN ARE RISING TOGETHER FOR A REASON -- SO IS THE VIX -- TELECOM ISHARES CLOSE AT NEW RECORD -- VERIZON NEARS UPSIDE BREAKOUT -- REITS ARE ALSO GAINING AS BOND YIELDS DROP
by John Murphy,
Chief Technical Analyst, StockCharts.com
A FRIDAY REBOUND IN BRITAIN AND EUROPE... All eyes are on the British Brexit vote this coming Thursday (June 23) on whether to stay in the European Union or leave. Latest polls show the "leave" vote in the lead. A relief bounce on Friday in Britain and Europe...
READ MORE
MEMBERS ONLY
Turnaround Thursday: Several Markets Reverse On The Day: What Are The Implications?
by Martin Pring,
President, Pring Research
* Stocks show signs of a near-term reversal
* What about those bonds?
* Gold showing signs of tiredness
Stocks show signs of near-term reversal
On Thursday, several markets started off strongly in one direction but by the end of the day, these same markets reversed course. Normally when one market or an...
READ MORE
MEMBERS ONLY

FOREIGN STOCKS LEAD US STOCKS LOWER -- EUROPE ETFS TUMBLE -- TEN-YEAR TREASURY YIELD FALLS TO FOUR-YEAR LOW -- FALLING FOREIGN CURRENCIES BOOST DOLLAR -- BOUNCING DOLLAR HURTS OIL, WHILE FALLING YIELDS BOOST GOLD -- BANK STOCKS LEAD U.S. STOCKS LOWER
by John Murphy,
Chief Technical Analyst, StockCharts.com
FOREIGN SHARES TUMBLE... Foreign shares continue to fall sharply and are pulling U.S. shares lower. The biggest drops are being seen in developed markets. Chart 1 shows MSCI iShares (EFA) falling to the lowest level in early three months. The biggest losses are being seen in Europe and Japan....
READ MORE
MEMBERS ONLY

A Funny Thing Happened On The Way To The Rally
by Martin Pring,
President, Pring Research
* Some short-term equity market cracks are starting to appear
* Rates are starting to breakdown
* Keep watching those credit spreads
Some short-term equity market cracks are starting to appear
In my last article, I pointed out that most of the short-term oscillators were in a bullish configuration. Moreover, they were not...
READ MORE
MEMBERS ONLY

PLUNGE IN GLOBAL BOND YIELDS SPARKS FLIGHT TO SAFETY -- RECORD LOW FOREIGN YIELDS PULL 10-YEAR TREASURY YIELD TO THREE-YEAR LOW -- BREXIT FEARS HIT POUND AND EUROPE -- OVERBOUGHT OIL MARKET DUE FOR A PULLBACK -- SO IS THE S&P 500
by John Murphy,
Chief Technical Analyst, StockCharts.com
FALLING FOREIGN YIELDS PULL TREASURIES LOWER... The big story this week was the plunge in global bond yields, many of which fell to record lows and deeper into negative territory. Chart 1 compares 10-Year yields of the U.S. (green), Britain (red), Germany (blue), and Japan (orange). The last three...
READ MORE
MEMBERS ONLY

INDUSTRIAL SPDR NEARS NEW RECORD -- RAILS ARE BACK ON TRACK LED BY CSX AND UNION PACIFIC -- COMMODITY INDEXES REACH BULL MARKET THRESHOLD -- MATERIALS ALSO SHOW MARKET LEADERSHIP -- NUCOR LEADS STEEL STOCKS HIGHER -- FALLING BOND YIELDS HELP GOLD
by John Murphy,
Chief Technical Analyst, StockCharts.com
INDUSTRIAL SPDR NEARS RECORD ... One of the positive signs for the stock market is that it's being led higher by economically sensitive stock groups. Chart 1, for example, shows the Industrial Sector SPDR (XLI) testing its April high. The XLI scored a bullish breakout during March when it...
READ MORE