MEMBERS ONLY

STRONG HOUSING DATA GIVES HOMEBUILDERS AND STOCKS A BIG LIFT -- BANKS HELP LEAD FINANCIALS TO ANOTHER STRONG DAY -- TECHNOLOGY SPDR TURNS UP AS SEMICONDUCTORS NEAR UPSIDE BREAKOUT -- NASDAQ INDEXES CLEAR MOVING AVERAGE LINES

by John Murphy,
Chief Technical Analyst, StockCharts.com
HOME CONSTRUCTION ISHARES CLEAR MOVING AVERAGES ... April new home sales surged to the highest level since 2008. That followed on the heels of last week's report of strong existing home sales. The prospect of newer homes being built is good for homebuilders, the economy, and the stock market....
READ MORE
MEMBERS ONLY

The Balance of Technical Evidence At The Short-end Is Now Pointing Towards Higher Rates

by Martin Pring,
President, Pring Research
* A tale of two possible market scenarios
* Are we there yet?
* Watch those techies
* The charts support a higher interest rate scenario
A tale of two possible market scenarios
I have been calling for a US equity market correction for the last few weeks because an overbought condition in several...
READ MORE
MEMBERS ONLY

DOW AND S&P 500 REMAIN IN SIDEWAYS PATTERN AFTER PASSING ONE-YEAR ANNIVERSARY OF MAY 2015 TOP -- BOTH ARE IN SHORT-TERM PULLBACKS BUT REMAIN ABOVE THEIR 200-DAY LINES -- NASDAQ UNDERPERFORMANCE MAY BE ABOUT TO TAKE A TURN FOR THE BETTER

by John Murphy,
Chief Technical Analyst, StockCharts.com
VIX FAILS BREAKOUT ATTEMPT... My Thursday morning message showed the Volatility Index (VIX) trying to break through resistance near 17. It rose as high as 17.65 intra-day which was the highest level in two months. Fortunately, it wasn't able to close there. The good news is that...
READ MORE
MEMBERS ONLY

VIX NEARS UPSIDE BREAKOUT -- SHORT TERM MARKET CORRECTION CONTINUES AS DOW AND S&P 500 HEAD TOWARD 200-DAY AVERAGES -- RISING DOLLAR WEAKENS COMMODITIES AND MULTINATIONALS -- STOCKS COULD PULL BACK TOWARD MIDDLE OF YEARLONG TRADING RANGE

by John Murphy,
Chief Technical Analyst, StockCharts.com
VIX MAY BE TURNING UP ... Chart 1 shows the Volatility (VIX) Index trying to clear 17 for the first time since early March. A rising VIX is usually associated with lower stock prices. Chart 2 shows a point & figure version of the VIX and shows a similar picture. After...
READ MORE
MEMBERS ONLY

Is The Recent Superior Performance Of Oil Over Equities Sustainable?

by Martin Pring,
President, Pring Research
* The big picture for oil prices
* Oil versus stocks
* Commodities versus bonds-the ultimate inflation/deflation relationship
* Clean-tech starting to turn around
This morning ‘s MarketWatch had a story featuring a recent Goldman Sachs report favoring oil over equities. They also had another, right next to it, saying to the effect...
READ MORE
MEMBERS ONLY

RISING BOND YIELDS BOOST FINANCIALS -- FINANCIAL SPDR BOUNCES OFF 200-DAY LINE -- BANK LEADERS INCLUDE REGIONS FINANCIAL, SUNTRUST, AND JP MORGAN CHASE -- PRUDENTIAL AND UNUM ARE LIFE INSURANCE LEADERS -- E*TRADE AND SCHWAB LEAD INVESTMENT SERVICE GROUP

by John Murphy,
Chief Technical Analyst, StockCharts.com
BOND YIELDS JUMP... Chart 1 shows the 10-Year Treasury Yield ($TNX) bouncing strongly today. That's partially the result of stronger economic news this week combined with higher inflation. The Consumer Price Index (CPI) for April saw the biggest gain in three years. Most of that came from rising...
READ MORE
MEMBERS ONLY

AIRLINE SELLING HAS WEIGHED ON TRANSPORTS -- BUT THAT MAY BE IMPROVING -- DELTA AND UAL BOUNCE OFF FEBRUARY LOWS -- SOUTHWEST AIR SHOWS RELATIVE STRENGTH -- OIL SERVICE ETF BOUNCES OFF MOVING AVERAGES

by John Murphy,
Chief Technical Analyst, StockCharts.com
TRANSPORTS SHOW SHORT-TERM WEAKNESS... One of the market's short-term problems has been the recent downturn in transportation stocks. The daily bars in Chart 1 show the Dow Jones Transportation Average ($TRAN) slipping below its April low and trading under its moving average lines. So far, the decline has...
READ MORE
MEMBERS ONLY

Using The Special K To Identify Major Trend Reversals

by Martin Pring,
President, Pring Research
Using The Special K To Identify Major Trend Reversals:
* What’s the Special K saying for US equities?
* Important parts of Asia are looking sick
* Gold and the dollar two diverging trends
At my bi-weekly Tuesday Market Roundup Webinar 2015-05-10 last week, I had a few words to say about...
READ MORE
MEMBERS ONLY

BIOTECHS PULL HEALTHCARE AND NASDAQ LOWER -- BIOGEN AND GILEAD ARE BIG CAP LOSERS -- SKYWORKS SOLUTIONS AND NETFLIX LEAD QQQ LOWER -- APPLE FALLS TO NEW LOW -- NASDAQ FAILURE THREATENS UPTRENDS IN DOW AND S&P 500

by John Murphy,
Chief Technical Analyst, StockCharts.com
BIOTECHS PULL HEALTHCARE LOWER ... Healthcare is one of the day's weakest sectors. Chart 1 shows the Health Care SPDR (XLV) pulling back to retest its 50- and 200-day moving averages. Its relative strength line (top of chart) has starting to slip as well. Biotechs are the main drag...
READ MORE
MEMBERS ONLY

We Were Told That Rates Were Going Up, But Government Bond Yield Charts Look Like They Are Headed South

by Martin Pring,
President, Pring Research
* Balancing out the possibilities for US equities
* Show me the bullish sectors
* Those rates were supposed to go up but the charts say that might not be the case
Balancing out the possibilities for US equities
Chart 1 shows the NYSE Composite ($NYA) and the Coppock Curve. The curve gives...
READ MORE
MEMBERS ONLY

TECHNOLOGY SPDR TRIES TO BOUNCE AT KEY CHART SUPPORT -- BIG TECH STOCKS TESTING 200-DAY LINES ARE CISCO, GOOGLE, AND MICROSOFT -- FACEBOOK HITS NEW HIGH, WHILE APPLE TESTS CRITICAL CHART SUPPORT

by John Murphy,
Chief Technical Analyst, StockCharts.com
TECHNOLOGY SPDR BOUNCES OFF 200-DAY LINE ... The technology sector has been one of the market's weakest sectors over the last month. That, however, may be changing for the better. The daily bars in Chart 1 show the Technology Sector SPDR (XLK) bouncing off of its 200-day moving average...
READ MORE
MEMBERS ONLY

ONLY ONE VERSION OF THE NYSE ADVANCE-DECLINE LINE HAS HIT A NEW RECORD -- THE VERSION THAT INCLUDES COMMON STOCKS ONLY HASN'T -- RECENT HISTORY FAVORS THE MORE TRADITIONAL VERSION -- NYSE COMPOSITE INDEX STALLS AT NOVEMBER HIGH

by John Murphy,
Chief Technical Analyst, StockCharts.com
THE TRADITIONAL NYAD LINE HITS NEW RECORD... Chartists look to the NYSE Advance-Decline line to help determine the trend of the stock market. The NYAD line is simply a running cumulative total of the number of advancing stocks minus decliners on the big board. And it has a good track...
READ MORE
MEMBERS ONLY

All Sectors Experiencing Short-term Momentum Sell Signals. Does This Mean The February Lows Will Be Taken Out?

by Martin Pring,
President, Pring Research
* Long-term picture still mixed
* Analyzing the Short-term Picture
* Global equities are still vulnerable
* Confidence looking questionable again
* Spot the bullish sector
Long-term picture still mixed
A couple of weeks ago I pointed out that several long-term indicators had tentatively turned bullish and that others were not far behind. The problem...
READ MORE
MEMBERS ONLY

GLOBAL STOCKS SLIDE AS MONEY MOVES INTO TREASURIES -- STAPLES AND UTILITIES SHOW RELATIVE STRENGTH -- CLOROX AND CVS ARE STAPLE LEADERS -- PFIZER HAS A STRONG DAY -- BANK INDEX PULLS BACK FROM 200-DAY AVERAGE

by John Murphy,
Chief Technical Analyst, StockCharts.com
SHORT-TERM STOCK PULLBACK DEEPENS... Global stocks are continuing the pullback that started last week. Chart 1 shows the S&P 500 heading down toward a test of its early April low and/or its moving average lines. The 14-day RSI line (top of chart) has slipped below the 50...
READ MORE
MEMBERS ONLY

DOLLAR CONTINUES TO WEAKEN AS EURO AND YEN RALLY -- THAT FAVORS HIGHER COMMODITY PRICES, AND GOLD IN PARTICULAR -- GOLD INDICATORS SUPPORT HIGHER PRICES -- SO DOES THE FACT THAT GOLD MINERS ARE RISING EVEN FASTER THAN THE COMMODITY

by John Murphy,
Chief Technical Analyst, StockCharts.com
DOLLAR INDEX TESTS SUMMER LOW... The decline in the U.S. dollar continued this past week. The daily bars in Chart 1 show the US Dollar Index ($USD) falling to the lowest level since last summer. That was its lowest close since the start of 2015. Part of the dollar...
READ MORE
MEMBERS ONLY

Bearish Dollar Index Signal Has Major Implications For All Kinds Of Markets And Relationships

by Martin Pring,
President, Pring Research
* Changes in key relationships
* Implications for specific stock sectors of a declining dollar
* The US versus the world
At this week’s Market Roundup webinar, I suggested that we had reached an inflexion point for many markets as well as several Intermarket and inter-asset relationships. That inflexion point centered on...
READ MORE
MEMBERS ONLY

VALUE ISHARES CONTINUE TO OUTPACE GROWTH ISHARES WHICH ARE BEING PULLED DOWN BY TECHNOLOGY SELLING -- BUT FINANCIALS, HEALTHCARE, ENERGY, AND INDUSTRIALS SECTORS ARE RISING -- BOEING CLEARS 200-DAY LINE AND LEADS DOW HIGHER

by John Murphy,
Chief Technical Analyst, StockCharts.com
ROTATION FROM GROWTH TO VALUE CONTINUES... Last Thursday I wrote about a rotation from "growth stocks" which rely on growing earnings into "value stocks" that are viewed as relatively cheap. That rotation is continuing. Chart 1 shows the S&P Value iShares (IVE) trading at...
READ MORE
MEMBERS ONLY

COMMODITIES ETF CHALLENGES 200-DAY AVERAGE WHICH MAY BE PULLING TREASURY BOND YIELDS HIGHER -- HIGHER YIELDS ARE HELPING FINANCIALS -- INDUSTRIAL SPDR SIGNALS SHIFT TO ECONOMICALLY-SENSITIVE STOCKS -- RYDER, PACCAR, AND LOCKHEED MARTIN LEAD XLI HIGHER

by John Murphy,
Chief Technical Analyst, StockCharts.com
RISING COMMODITIES PULL BOND YIELDS HIGHER... The rally in commodity markets may be about to move into higher gear. Chart 1 shows the DB Commodities Tracking Index Fund (DBC) on the verge of moving above its 200-day average for the first time in two years. A weaker dollar is one...
READ MORE
MEMBERS ONLY

HEALTHCARE PROVIDER INDEX REACHES SIX-MONTH HIGH -- LED BY AETNA AND ANTHEM -- RAIL INDEX TURNS UP -- LEADERS ARE NORFOLK SOUTHERN, KANSAS CITY SOUTHERN, AND UNION PACIFIC -- DOW TRANSPORTS EXCEED MAJOR RESISTANCE LINE -- S&P GROWTH ISHARES UNDERPERFORM

by John Murphy,
Chief Technical Analyst, StockCharts.com
HEALTH CARE PROVIDERS INDEX TURNS UP ... I've been writing a lot about the recent upturn in the healthcare sector. Most of my attention has been on biotechs, pharmaceuticals, and medical equipment stocks (Boston Scientific, Thermo Fisher, Zimmer, and Waters). Today's message will focus on health care...
READ MORE
MEMBERS ONLY

Indicators Still Mixed As The Market Reaches All-Time Highs

by Martin Pring,
President, Pring Research
* Coppock Curve on a buy and sell?
* Record high indicator signals a bull market
* 6/180 PPO right on the cusp of a bull market signal
* Short-term overbought condition argues for a pause
* Commodities breaking to the upside
* Interest rates waffling
During the last couple of months I have been...
READ MORE
MEMBERS ONLY

VALUE STOCKS GAIN ON GROWTH -- VALUE GROUPS INCLUDE FINANCIALS, ENERGY, AND HEALTHCARE -- STAPLES AND UTILITIES TURN DOWN ON BOUNCING BOND YIELDS -- RISING COMMODITIES HURT BOND PRICES -- VERIZON LEADS TELECOM LOWER AS DIVIDEND-PAYING STOCKS WEAKEN

by John Murphy,
Chief Technical Analyst, StockCharts.com
S&P 500 GROWTH ISHARES ARE STARTING TO LAG... For the first time since the latest bull market began in 2009, value stocks are gaining ground on growth stocks. The bull market is in its seventh year and looking very mature. One way some investors are participating in the...
READ MORE
MEMBERS ONLY

FREEPORT MCMORAN AND SOUTHERN COPPER RISE WITH PRICE OF COPPER -- SILVER SHARES SURGE WITH THE COMMODITY -- SILVER STANDARD RESOURCES AND SILVER WHEATON NEAR UPSIDE BREAKOUTS -- FIRST MAJESTIC SILVER SURGES IN CANADA -- TORONTO STOCK INDEX LOOKS STRONG

by John Murphy,
Chief Technical Analyst, StockCharts.com
COPPER SHARES SURGE ON RISING PRICE OF COPPER... Money continues to flow into shares tied to industrial and precious metals. Copper shares are rising with the commodity. Copper is up nearly 2% today and 13% from its January bottom. Chart 1 shows Freeport McMoran (FCX) surging 7% to reach the...
READ MORE
MEMBERS ONLY

HEALTHCARE SPDR TRADES OVER 200-DAY AVERAGE -- WATERS CORP BREAKS OUT TO NEW HIGH -- ABBV, AMGEN, AND GILEAD SHOW STRONGER CHART PATTERNS -- PHARMA IS BEING LED HIGHER BY MERCK AND BMY -- ABBOTT LABS CLEARS 200-DAY LINE

by John Murphy,
Chief Technical Analyst, StockCharts.com
HEALTHCARE SPDR CLEARS 200-DAY AVERAGE... Healthcare stocks continue to get better. The daily bars in Chart 1 show the Health Care SPDR (XLV) trading back over its 200-day average and at the highest level since the start of the year. The XLV/SPX ratio (top of chart) has been rising...
READ MORE
MEMBERS ONLY

FINANCIALS HAVE A STRONG WEEK -- SO DO ECONOMICALLY-SENSITIVE MATERIALS AND INDUSTRIALS -- SMALL AND MIDCAP INDEXES TURN UP -- EQUAL-WEIGHTED S&P 500 ETF BREAKS OUT -- NYSE ADVANCE-DELINE LINE HITS NEW RECORD -- FTSE ALL-WORLD EQUITY INDEX TURNS UP

by John Murphy,
Chief Technical Analyst, StockCharts.com
FINANCIALS HAVE A STRONG WEEK... Financials went from the year's weakest sector to the strongest gainer for this past week (+3.8%). Chart 1 shows the Financials Sector SPDR (XLF) climbing to the highest level in three months and challenging its 200-day moving average (red arrow). The dotted...
READ MORE
MEMBERS ONLY

Which Sectors To Hold And Which Sectors To Fold Part II

by Martin Pring,
President, Pring Research
Earlier in the week I reviewed several US market sectors from the point of view of their potential strength or weakness. In this article I’ll cover the rest and then some. If you know what I mean by the term “Nirvana Template” you can skip the next paragraph and...
READ MORE
MEMBERS ONLY

Which Sectors To Hold And Which Ones To Fold?

by Martin Pring,
President, Pring Research
In my Tuesday webinar, I opined that the US equity market is pretty close to a make or break point. While several indicators were still bearish it would not take much in the way of upside action to turn them positive. Of course, they never make it easy, and right...
READ MORE
MEMBERS ONLY

SILVER AND STEEL STOCKS CONTINUE TO SURGE -- STEEL LEADERS INCLUDE RELIANCE, STEEL DYNAMICS, AND NUCOR -- FREEPORT MCMORAN LEADS MATERIALS -- CHINESE STOCKS LEAD EMERGING MARKETS HIGHER -- JP MORGAN LEADS BANKS AND FINANCIALS HIGHER

by John Murphy,
Chief Technical Analyst, StockCharts.com
GLOBAL X SILVER MINERS ETF CONTINUES TO SOAR... My market message from March 7 showed major upturns in industrial and precious metal mining stocks. I made the point that silver stocks were doing better that gold miners. That was due to the fact that silver is both an industrial and...
READ MORE
MEMBERS ONLY

ENERGY SPDR CLEARS 200-DAY AVERAGE -- ENERGY LEADERS INCLUDE CHEVRON, EXXON MOBIL, PIONEER NATURAL RESOURCES, EOG, AND SCHLUMBERGER -- S&P METALS AND MINING SPDR REACHES NINE-MONTH HIGH

by John Murphy,
Chief Technical Analyst, StockCharts.com
ENERGY SPDR TRADES ABOVE 200-DAY MOVING AVERAGE... My weekend message showed the Energy Sector SPDR (XLE) rising up to test its 40-week moving average for the third time since last May. I also pointed out that weekly MACD lines had already exceeded their fourth quarter highs, which increased the odds...
READ MORE
MEMBERS ONLY

FALLING BOND YIELDS HURT BANKS -- SAFE HAVEN BUYING OF TREASURIES, GOLD, AND YEN SHOW A CAUTIOUS MOOD -- HEALTH CARE SPDR RISES TO TEST 200-DAY AVERAGE -- ENERGY SPDR TESTS 40-WEEK AVERAGE -- MACD LINES LOOK POSITIVE

by John Murphy,
Chief Technical Analyst, StockCharts.com
FALLING BOND YIELDS HURTS BANKS ... Treasury bond yields continue to drop. Chart 1 shows the 10-Year Treasury Bond Yield touching the lowest level since February. Part of that is buying of Treasury bonds in an overbought stock market. Part of it is also historically low sovereign bond yields in Europe...
READ MORE
MEMBERS ONLY

Equities Are Rolling Over Into Corrective Mode

by Martin Pring,
President, Pring Research
* The Coppock Curve tells us the market is at a significant juncture point
* Those pesky credit spreads are deteriorating again
* The US credit markets are close to some important signals
The Coppock Curve tells us the market is at a significant juncture point
Chart 1 features a long-term smoothed momentum...
READ MORE
MEMBERS ONLY

FTSE ALL-WORLD INDEX STALLS AT RESISTANCE LINE -- RISING EURO HURTS GERMANY ISHARES -- SURGING YEN PUNISHES JAPANESE STOCKS -- OVERBOUGHT DOW INDUSTRIALS NEAR OVERHEAD RESISTANCE -- WILSHIRE 5000 TESTS MAJOR RESISTANCE LINE -- SO DO DOW TRANSPORTS

by John Murphy,
Chief Technical Analyst, StockCharts.com
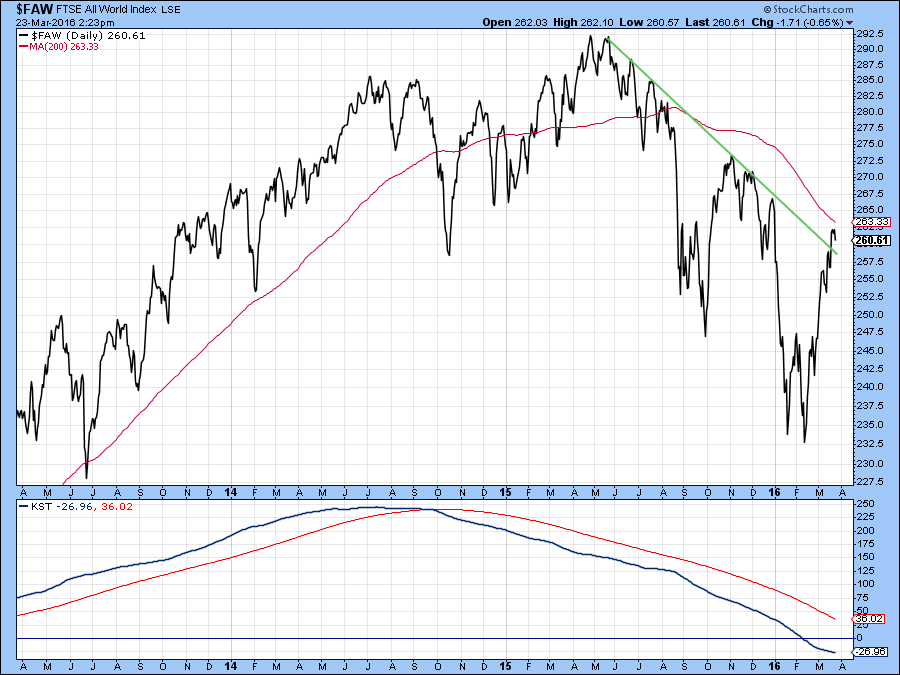
FTSE WORLD INDEX BACK BELOW 200-DAY LINE... Last Wedneday's message showed the FTSE All World Stock Index ($FAW) trying to move above its 200-day moving average. Although it rose above that resistance line for a couple of days, Chart 1 shows that it's back below it...
READ MORE
MEMBERS ONLY

Could Commodities Be In The Process Of Forming A Major Bottom?

by Martin Pring,
President, Pring Research
* A test of the bear market low for commodities is underway
* Relative commodity action favors metals and agriculture
* Stocks to continue to outperform commodities
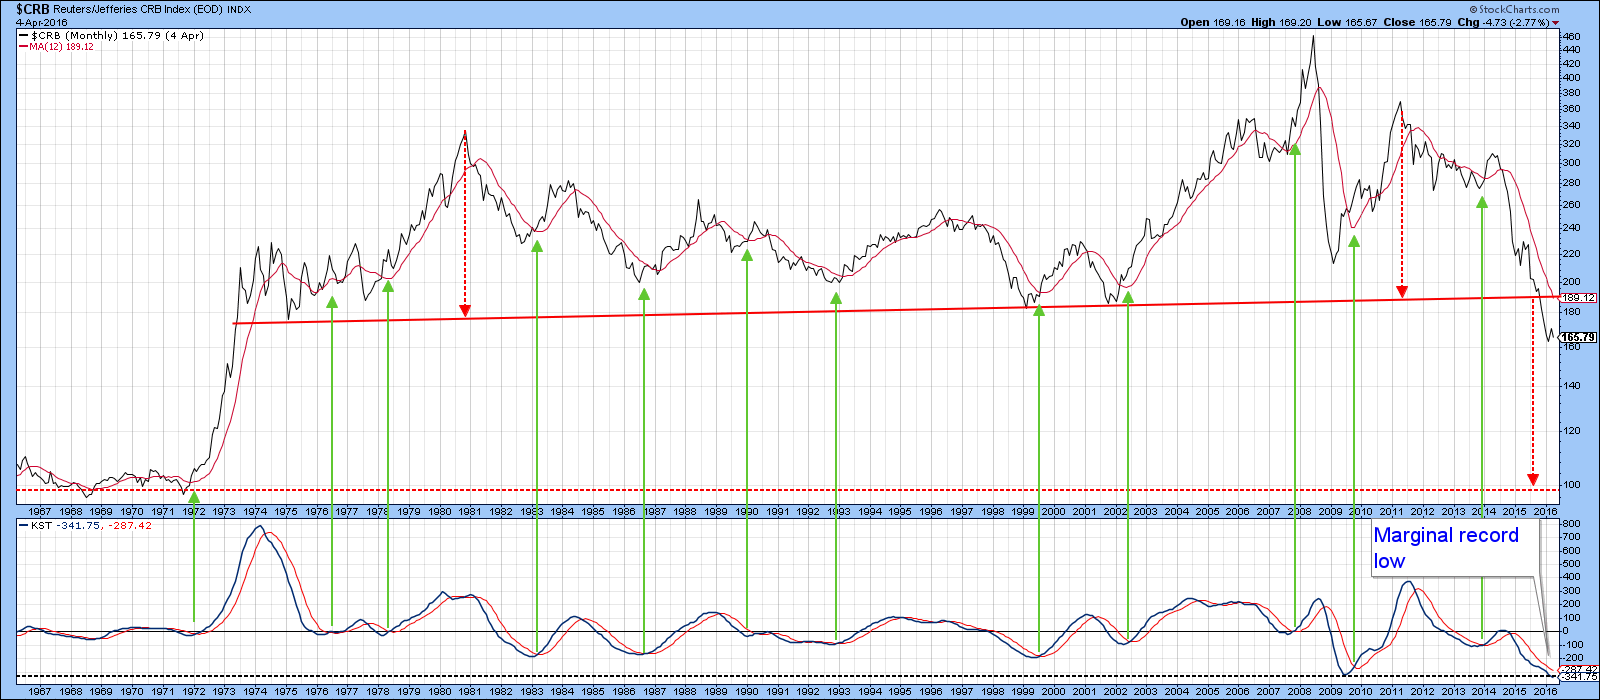
This week I am focusing on commodity prices, or more specifically on the Commodity Research Bureau Composite ($CRB) to see what might need to take place...
READ MORE
MEMBERS ONLY

HEALTHCARE SECTOR IS LOOKING HEALTHIER -- BOSTON SCIENTIFIC, THERMO FISHER SCIENTIFIC, AND ZIMMER BIOMET HOLDINGS ARE MEDICAL EQUIPMENT LEADERS -- BIOTECH LEADERS ARE ABBVIE, AMGEN, AND GILEAD -- THE LAST TWO ARE TESTING MAJOR DOWN TRENDLINES

by John Murphy,
Chief Technical Analyst, StockCharts.com
HEALTHCARE SPDR REACHES THREE-MONTH HIGH... Money is continuing to rotate into healthcare stocks which had been the year's weakest sector. It's been the market's strongest sector for the last two trading days. Chart 1 shows the HealthCare Sector SPDR (XLV) reaching the highest level...
READ MORE
MEMBERS ONLY

BIOTECHS LEAD HEALTHCARE HIGHER -- BOTH ETFS APPEAR TO BE BOTTOMING -- BIOTECH LEADERS ARE REGENERON, ILLUMINA, AND AMGEN -- NASDAQ COMPOSITE IS TRADING ABOVE 200-DAY LINE -- S&P 600 SMALL CAP INDEX IS TESTING RESISTANCE LINE

by John Murphy,
Chief Technical Analyst, StockCharts.com
BIOTECHS LEAD HEALTHCARE HIGHER... Last Friday's message showed that healthcare was the year's weakest sector, and most of that was because of a very weak biotech group. [It also mentioned that biotechs were holding back the QQQ. More on that later]. For the first time in...
READ MORE
MEMBERS ONLY

US Equities Remain At A Bull/Bear Crossroad

by Martin Pring,
President, Pring Research
* Consistently reliable primary trend indicator on the fence
* Strong breadth
* Equities overbought and lacking in volume
* Rates headed lower?
Consistently reliable primary trend indicator right on the fence
The US equity market continues to bump up against resistance at a time when most short-term oscillators are overstretched. Since volume has...
READ MORE
MEMBERS ONLY

FTSE ALL WORLD STOCK INDEX IS LOOKING A LOT STRONGER -- DOLLAR REMAINS WEAK ON DOVISH FED TALK -- THAT'S BOOSTING COMMODITIES AND MULTINATIONAL STOCKS -- NYSE ADVANCE-DECLINE IS TESTING SPRING 2015 HIGH

by John Murphy,
Chief Technical Analyst, StockCharts.com
FTSE ALL WORLD INDEX OUT OF DANGER... Back on February 17, I wrote a market message showing the FTSE All World Stock Index ($FAW) starting to find support at its 2011 peak. [The FAW includes 2900 stocks in 47 developed and emerging countries, including the US]. I pointed out that...
READ MORE
MEMBERS ONLY

QQQ CLEARS 200-DAY AVERAGE -- LAM RESEARCH SCORES BULLISH BREAKOUT -- YAHOO IS CLOSE TO DOING THE SAME -- FACEBOOK AND MICROSOFT HAVE A STRONG DAY -- APPLE IS REBOUNDING FROM LONG TERM SUPPORT AND MAY BE BOTTOMING

by John Murphy,
Chief Technical Analyst, StockCharts.com
QQQ CLEARS 200-DAY LINE... The market was led higher by the Nasdaq market today. Last Friday's message showed the PowerShares QQQ Trust testing its 200-day moving average. Chart 1 shows the QQQ clearing that important chart barrier today. Since the QQQ is comprised of the largest 100 non-financial...
READ MORE
MEMBERS ONLY

STOCK MARKET DIGESTS ITS GAINS -- DOW INDUSTRIALS AND S&P 500 REMAIN ABOVE 200-DAY LINES -- THE NASDAQ 100, HOWEVER, IS STILL TESTING THAT RESISTANCE LINE -- BIOTECHS HAVE BEEN THE BIGGEST DRAG ON THE NASDAQ -- GILEAD SCIENCES IS STILL IN DOWNTREND

by John Murphy,
Chief Technical Analyst, StockCharts.com
DOW AND S&P 500 HOLD ABOVE 200-DAY LINES... Given the size of the market rally since mid-February, it's not surprising to see it spend the past week consolidating. While the market had its first down week after five up weeks, very little changed on the charts...
READ MORE
MEMBERS ONLY

Is This The Top Of The Rally Or A New Bull Market?

by Martin Pring,
President, Pring Research
* World indexes not yet above their 200-day MA’s
* USA indexes very overstretched short-term
* Two reliable primary trend indexes at make or break points
Three world equity indexes
StockCharts carries three stock market indexes measuring “The World”. All of them are overbought on a short-term basis, two are below their...
READ MORE
MEMBERS ONLY

DEFENSIVE STOCKS LIKE STAPLES AND UTILITIES START TO LOSE LEADERSHIP ROLE -- INDUSTRIAL SPDR BULLISH BREAKOUT SHOWS NEW LEADERSHIP -- THAT'S USUALLY BEEN A GOOD SIGN FOR THE MARKET -- MATERIALS AND TECHNOLOGY SPDRS TEST FOURTH QUARTER HIGHS

by John Murphy,
Chief Technical Analyst, StockCharts.com
STAPLES START TO LOSE LEADERSHIP... Consumer staples were market leaders during December and January as the market started to weaken. That's normal. The daily bars in Chart 1 plot the Consumer Staples SPDR (XLP) along with the XLP/SPX relative strength ratio since last October. The XLP/SPX...
READ MORE


