MEMBERS ONLY

HEALTHCARE SECTOR IS LOOKING HEALTHIER -- BOSTON SCIENTIFIC, THERMO FISHER SCIENTIFIC, AND ZIMMER BIOMET HOLDINGS ARE MEDICAL EQUIPMENT LEADERS -- BIOTECH LEADERS ARE ABBVIE, AMGEN, AND GILEAD -- THE LAST TWO ARE TESTING MAJOR DOWN TRENDLINES

by John Murphy,
Chief Technical Analyst, StockCharts.com
HEALTHCARE SPDR REACHES THREE-MONTH HIGH... Money is continuing to rotate into healthcare stocks which had been the year's weakest sector. It's been the market's strongest sector for the last two trading days. Chart 1 shows the HealthCare Sector SPDR (XLV) reaching the highest level...
READ MORE
MEMBERS ONLY

BIOTECHS LEAD HEALTHCARE HIGHER -- BOTH ETFS APPEAR TO BE BOTTOMING -- BIOTECH LEADERS ARE REGENERON, ILLUMINA, AND AMGEN -- NASDAQ COMPOSITE IS TRADING ABOVE 200-DAY LINE -- S&P 600 SMALL CAP INDEX IS TESTING RESISTANCE LINE
by John Murphy,
Chief Technical Analyst, StockCharts.com
BIOTECHS LEAD HEALTHCARE HIGHER... Last Friday's message showed that healthcare was the year's weakest sector, and most of that was because of a very weak biotech group. [It also mentioned that biotechs were holding back the QQQ. More on that later]. For the first time in...
READ MORE
MEMBERS ONLY
US Equities Remain At A Bull/Bear Crossroad

by Martin Pring,
President, Pring Research
* Consistently reliable primary trend indicator on the fence
* Strong breadth
* Equities overbought and lacking in volume
* Rates headed lower?
Consistently reliable primary trend indicator right on the fence
The US equity market continues to bump up against resistance at a time when most short-term oscillators are overstretched. Since volume has...
READ MORE
MEMBERS ONLY

FTSE ALL WORLD STOCK INDEX IS LOOKING A LOT STRONGER -- DOLLAR REMAINS WEAK ON DOVISH FED TALK -- THAT'S BOOSTING COMMODITIES AND MULTINATIONAL STOCKS -- NYSE ADVANCE-DECLINE IS TESTING SPRING 2015 HIGH
by John Murphy,
Chief Technical Analyst, StockCharts.com
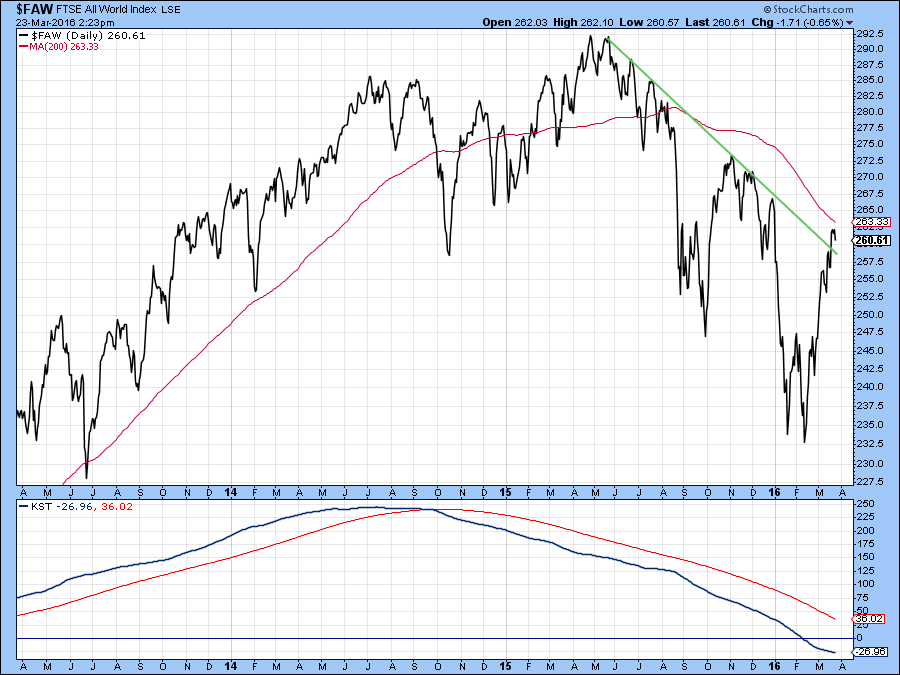
FTSE ALL WORLD INDEX OUT OF DANGER... Back on February 17, I wrote a market message showing the FTSE All World Stock Index ($FAW) starting to find support at its 2011 peak. [The FAW includes 2900 stocks in 47 developed and emerging countries, including the US]. I pointed out that...
READ MORE
MEMBERS ONLY

QQQ CLEARS 200-DAY AVERAGE -- LAM RESEARCH SCORES BULLISH BREAKOUT -- YAHOO IS CLOSE TO DOING THE SAME -- FACEBOOK AND MICROSOFT HAVE A STRONG DAY -- APPLE IS REBOUNDING FROM LONG TERM SUPPORT AND MAY BE BOTTOMING
by John Murphy,
Chief Technical Analyst, StockCharts.com
QQQ CLEARS 200-DAY LINE... The market was led higher by the Nasdaq market today. Last Friday's message showed the PowerShares QQQ Trust testing its 200-day moving average. Chart 1 shows the QQQ clearing that important chart barrier today. Since the QQQ is comprised of the largest 100 non-financial...
READ MORE
MEMBERS ONLY

STOCK MARKET DIGESTS ITS GAINS -- DOW INDUSTRIALS AND S&P 500 REMAIN ABOVE 200-DAY LINES -- THE NASDAQ 100, HOWEVER, IS STILL TESTING THAT RESISTANCE LINE -- BIOTECHS HAVE BEEN THE BIGGEST DRAG ON THE NASDAQ -- GILEAD SCIENCES IS STILL IN DOWNTREND
by John Murphy,
Chief Technical Analyst, StockCharts.com
DOW AND S&P 500 HOLD ABOVE 200-DAY LINES... Given the size of the market rally since mid-February, it's not surprising to see it spend the past week consolidating. While the market had its first down week after five up weeks, very little changed on the charts...
READ MORE
MEMBERS ONLY
Is This The Top Of The Rally Or A New Bull Market?
by Martin Pring,
President, Pring Research
* World indexes not yet above their 200-day MA’s
* USA indexes very overstretched short-term
* Two reliable primary trend indexes at make or break points
Three world equity indexes
StockCharts carries three stock market indexes measuring “The World”. All of them are overbought on a short-term basis, two are below their...
READ MORE
MEMBERS ONLY

DEFENSIVE STOCKS LIKE STAPLES AND UTILITIES START TO LOSE LEADERSHIP ROLE -- INDUSTRIAL SPDR BULLISH BREAKOUT SHOWS NEW LEADERSHIP -- THAT'S USUALLY BEEN A GOOD SIGN FOR THE MARKET -- MATERIALS AND TECHNOLOGY SPDRS TEST FOURTH QUARTER HIGHS
by John Murphy,
Chief Technical Analyst, StockCharts.com
STAPLES START TO LOSE LEADERSHIP... Consumer staples were market leaders during December and January as the market started to weaken. That's normal. The daily bars in Chart 1 plot the Consumer Staples SPDR (XLP) along with the XLP/SPX relative strength ratio since last October. The XLP/SPX...
READ MORE
MEMBERS ONLY

World Stock ETF Rallies Back To Its Bear Market Trendline And 200-day MA. Is The Bear Market Over?
by Martin Pring,
President, Pring Research
* World markets are just below key resistance
* Junk bonds break through their 200-day MA. Will the break hold?
* World Bond Index breaks to the upside
Last week I called for some corrective action in the US equity market based on what, at the time, appeared to be a couple of...
READ MORE
MEMBERS ONLY

COMMODITIES CONTINUE TO RALLY ON FALLING DOLLAR AND DOVISH FED -- SILVER WHEATON LEADS SILVER ETF HIGHER -- SOUTHERN COPPER CLEARS 200-DAY LINE -- FEDEX AND DOW TRANSPORTS CLEAR 200-DAY LINES
by John Murphy,
Chief Technical Analyst, StockCharts.com
U.S. DOLLAR FALLS TO FIVE-MONTH LOW ... Yesterday's dovish statement from the Fed that it was scaling back plans to raise short-term rates had the dual effect of pushing interest rates and the dollar lower. Chart 1 shows the Power Shares Dollar Index (UUP) falling to the lowest...
READ MORE
MEMBERS ONLY

FED TAKES MORE DOVISH TONE ON RATE HIKES -- SHORTER RATES LEAD YIELDS LOWER -- TIPS REBOUND ON INCREASED INFLATION EXPECTATIONS -- DROP IN DOLLAR BOOSTS COMMODITIES -- CANADIAN DOLLAR CLEARS 200-DAY LINE -- S&P 500 EXTENDS GAIN OVER 200-DAY AVERAGE
by John Murphy,
Chief Technical Analyst, StockCharts.com
FED SCALES BACKS 2016 RATE CUTS... The Fed left rates unchanged as expected. However, it also scaled back any potential rate hikes for this year. Previous estimates of three or four possible hikes were lowered to two. It also sounded more cautious on the global economy. Initial market reactions were...
READ MORE
MEMBERS ONLY

MATERIALS AND DISCRETIONARY SPDRS CLEAR 200-DAY AVERAGES -- CHEMICAL LEADERS ARE DOW, DUPONT, AND EASTMAN -- WHIRLPOOL EXCEEDS 200-DAY LINE -- BROADCOM AND ASML LEAD SEMICOMDUCTORS HIGHER -- CORPORATE BONDS JUMP AS TREASURIES SLIDE
by John Murphy,
Chief Technical Analyst, StockCharts.com
A LOT OF 200-DAY LINES ARE BEING TESTED OR EXCEEDED... Major stocks indexes in the U.S. are moving up to challenge their 200-day averages. Those are important tests because the 200-day line is the measure most used by chartists to distinguish uptrends from downtrends. A number of group indexes...
READ MORE
MEMBERS ONLY

PERCENT OF NYSE STOCKS ABOVE 50-DAY AVERAGE REACHES TWO-YEAR HIGH -- % OVER 200-DAY LINE TESTS FOURTH QUARTER HIGH -- NYSE ADVANCE-DECLINE LINE LOOKS STRONG -- NYSE BULLISH PERCENT INDEX CLEARS 50% -- BUYING OF CORPORATE AND JUNK BONDS SHOWS NEW OPTIMISM
by John Murphy,
Chief Technical Analyst, StockCharts.com
PERCENT OF NYSE STOCKS ABOVE 50-DAY AVERAGE REACHES TWO-YEAR HIGH... The debate continues about whether the stock market faces the likelihood of another downleg. Several technical indicators seem to suggest that a major selloff is unlikely. Here's the first one. I recently showed the NYSE percent of stocks...
READ MORE
MEMBERS ONLY

Contrarian Thinking Says The Equity, Oil And Junk Bonds Rally Is Over
by Martin Pring,
President, Pring Research
* Inflection point for junk bonds?
* Fake out rally a la 2008?
* Short-term oil rally over?
Inflection point for junk bonds?
It has been a feature of this bear market that stocks sell off in concert with junk bonds and oil prices as investors fret over potential energy company defaults. Not...
READ MORE
MEMBERS ONLY

MINERS HAVE ANOTHER BIG DAY -- ETFS TIED TO MINING AND PRECIOUS METALS CLEAR 200-DAY LINES -- STEEL STOCKS BENEFIT FROM RECORD JUMP IN IRON ORE -- ADD NUCOR TO LIST OF STEEL LEADERS -- PAN AMERICAN LEADS SILVER STOCKS HIGHER
by John Murphy,
Chief Technical Analyst, StockCharts.com
METALS AND MINING SPDR CLEARS 200-DAY AVERAGE ... Precious and base metal stocks are continuing their strong rally on the back of rising commodity prices. Chart 1 shows the S&P Metals and Mining SPDR (XME) trading above its 200-day average and at the highest level in five months. Its...
READ MORE
MEMBERS ONLY

COMMERCIAL VEHICLE AND TRUCK GROUP LEADS INDUSTRIAL SECTOR HIGHER -- DEERE, PACCAR, AND CATERPILLAR TEST 200-DAY AVERAGES -- GATX CLEARS ITS 200-DAY LINE TO LEAD TRANSPORTATION GROUP -- SO HAS JB HUNT
by John Murphy,
Chief Technical Analyst, StockCharts.com
LEAD INDUSTRIALS HIGHER... Economically-sensitive industrial stocks continue to show new strength. A leading industrial group is the Dow Jones US Commerical Vehicles and Trucks Index ($DJUSHR). Chart 1 shows that index climbing more than 2% today to a new three month high. It includes big percentage gainers like Joy Global...
READ MORE
MEMBERS ONLY

Three Indicators You Should Watch To Signal A New Bull Market
by Martin Pring,
President, Pring Research
* Credit spreads about to turn?
* A PPO that calls primary trends
* Record High Indicator
The market is now starting to respond positively to several bullish intermediate indicators. I still believe the main trend is down, but it seems like a good idea to look at three currently bearish indicators and...
READ MORE
MEMBERS ONLY

ALCOA AND FREEPORT MCMORAN CONTINUE TO RISE WITH INDUSTRIAL METALS -- SO DO STEEL STOCKS -- AKSTEEL, STEEL DYNAMICS, AND RELIANCE STEEL CLEAR 200-DAY AVERAGES -- AUSSIE AND CANADIAN DOLLARS ARE RISING WITH COMMODITIES
by John Murphy,
Chief Technical Analyst, StockCharts.com
ALCOA AND FREEPORT MCMORAN LEAD MARKET HIGHER ... A lot of attention is being paid to the recent upturn in the price of oil and energy shares, and its potentially positive influence on the global economy and stocks. An even more impressive upturn is taking place in industrial metals and their...
READ MORE
MEMBERS ONLY

MARKET RALLY PUSHES MAJOR INDEXES OVER 50-DAY AVERAGES TO STRENGTHEN SHORT-TERM TREND -- INDUSTRIAL AND TECHNOLOGY SPDRS CLEAR 200-DAY LINES -- BOUNCE IN BOND YIELD BOOSTS BANKS AND FINANCIALS -- EMERGING MARKETS LEAD GLOBAL RALLY
by John Murphy,
Chief Technical Analyst, StockCharts.com
MAJOR STOCK INDEXES ARE ABOVE 50-DAY AVERAGES ... The market's short-term trend continues to strengthen. Today's strong gains have pushed all major U.S. stock indexes above their 50-day moving averages. Chart 1 shows the Dow Industrials trading at a two-month high, with a good shot at...
READ MORE
MEMBERS ONLY

LOW BOND YIELDS CONTINUE TO BENEFIT DIVIDEND-PAYERS -- THAT INCLUDES STAPLES, REITS, UTILITIES, AND TELECOM -- DIVIDEND ISHARES TEST FOURTH QUARTER HIGH -- STAPLE AND UTILITY SPDRS HIT NEW HIGHS -- REITS AND TELECOM ETFS SHOW RELATIVE STRENGTH
by John Murphy,
Chief Technical Analyst, StockCharts.com
BOND YIELDS ARE STILL LOW... I recently showed the 10-Year Treasury Bond Yield ($TNX) bouncing off an "island reversal" bottom formed a couple of weeks ago (see circle), and pointed out that pattern usually signals a "short-term" change in direction. Chart 1 shows the TNX moving...
READ MORE
MEMBERS ONLY

STOCKS TRY TO STABILIZE WITH OIL -- SHORT-TERM TREND REMAINS NEUTRAL -- BANKS ALSO BOUNCE WITH OIL IN AFTERNOON TRADING -- KEEPING SHORT-TERM BUY SIGNALS IN PERSPECTIVE
by John Murphy,
Chief Technical Analyst, StockCharts.com
SHORT-TERM TREND STILL UNCERTAIN... Stocks opened lower with oil today, but are trying to stabilize with the commodity in afternoon trading. Chart 1, however, shows a somewhat neutral picture for the market's short-term trend. After successfully testing its January low earlier this month, the S&P 500...
READ MORE
MEMBERS ONLY

Bearish Two Bar Reversal Says Further Probing of Recent Lows Is Likely
by Martin Pring,
President, Pring Research
* Intermediate rally/consolidation for US equities still on the menu
* Test of the lows is likely first
* Emerging markets continue to look vulnerable
* Gold showing strong technical signs
The Intermediate Rally/trading range
The intermediate rally possibilities, which I have been discussing for several weeks, is still a probability. That’...
READ MORE
MEMBERS ONLY

RALLY PUSHES STOCK INDEXES INTO TEST OF OVERHEAD RESISTANCE -- RISING OIL AND BASE METALS BOOST ENERGY AND MINERS -- ALCOA AND FREEPORT MCMORAN LEAD MATERIALS HIGHER -- BRAZIL AND RUSSIA HAVE STRONG DAY ON BACK OF COMMODITY RALLY
by John Murphy,
Chief Technical Analyst, StockCharts.com
DOW IS THE FIRST TO CLEAR FEBRUARY HIGH ... A strong Monday stock rally pushed U.S. stock indexes right up against initial overhead barriers at their early February peak and 50-day averages. Chart 1 shows the Dow Industrials being the first to exceed its February high. It is still, however,...
READ MORE
MEMBERS ONLY

NYSE COMPOSITE INDEX TESTS OVERHEAD RESISTANCE -- IT'S ALSO IN A LONG-TERM SUPPORT ZONE -- NYSE BULLISH PERCENT INDEX GIVES P&F BUY SIGNAL -- % OF NYSE STOCKS ABOVE MOVING AVERAGES MAY BE BOTTOMING -- UAL AND DELTA BOOST INDUSTRIAL SPDR
by John Murphy,
Chief Technical Analyst, StockCharts.com
NYSE COMPOSITE INDEX TESTS RESISTANCE... Stocks had their best week of the year. While that's encouraging, they'll have to do a lot more to signal that the global correction/bear market has run its course. I'm focusing on the NYSE Composite Index (NYA) today...
READ MORE
MEMBERS ONLY

Forget The Hindenburg Omen - Here's Another Possibility To Consider
by Martin Pring,
President, Pring Research
* Five days of Armageddon
* Does the British market still lead the US market
Five Days of Armageddon
For some time, I have been drawing your attention to the fact that many intermediate indicators have been flashing buy signals that even in primary bear markets have triggered some kind of a...
READ MORE
MEMBERS ONLY

MARKET RALLY CONTINUES AS OIL BOUNCES -- ENERGY AND MATERIAL STOCKS ARE MARKET LEADERS -- FREEPORT MCMORAN HAS BIG DAY -- CH ROBINSON LEADS TRUCKERS HIGHER -- SMALL CAP INDEX TESTS MAJOR SUPPORT IN OVERSOLD CONDITION
by John Murphy,
Chief Technical Analyst, StockCharts.com
S&P 500 NEARS TEST OF FEBRUARY HIGH ... My weekend message suggested that stocks had put in a short-term bottom. We'll find out soon enough if last week's bottom was even more significant. Chart 1 shows the S&P 500 Index nearing a test...
READ MORE
MEMBERS ONLY

More Evidence Of An Intermediate Bear Market Rally Falls Into Place
by Martin Pring,
President, Pring Research
* World breadth series signal that global equities are ready to advance
* Dollar faces an important technical test
Sometimes when the market declines, things actually improve, and that’s what may have been happening this week. In my most recent article, Intermediate Indicators Signal a Rally but Remember It’s a...
READ MORE
MEMBERS ONLY

FRIDAY'S RALLY PREVENTS CHART BREAKDOWN -- OIL RALLY GIVES STOCKS A STRONG BOOST -- ENERGY SHARES ARE IN POTENTIAL SUPPORT ZONE -- BANK SHARES TEST LONG-TERM SUPPORT LINES -- FRIDAY'S JUMP IN BOND YIELDS ALSO HELPS STOCKS
by John Murphy,
Chief Technical Analyst, StockCharts.com
MARKET BENDS BUT DOESN'T BREAK... It looked on Thursday like the major U.S. stock indexes were on the verge of closing below their January lows. A Thursday afternoon rebound, however, followed by a 2% gain on Friday kept those support levels intact. Chart 1 shows the Dow...
READ MORE
MEMBERS ONLY

TREASURY YIELDS FALL TO THREE-YEAR LOW AS PRICES SURGE -- THAT'S REALLY HURTING BANKS AND LIFE INSURERS -- PRUDENTIAL TUMBLES -- MONEY CONTINUES TO FLOW INTO TREASURY BONDS, GOLD, AND THE JAPANESE YEN -- DOW ON VERGE OF BREAKDOWN
by John Murphy,
Chief Technical Analyst, StockCharts.com
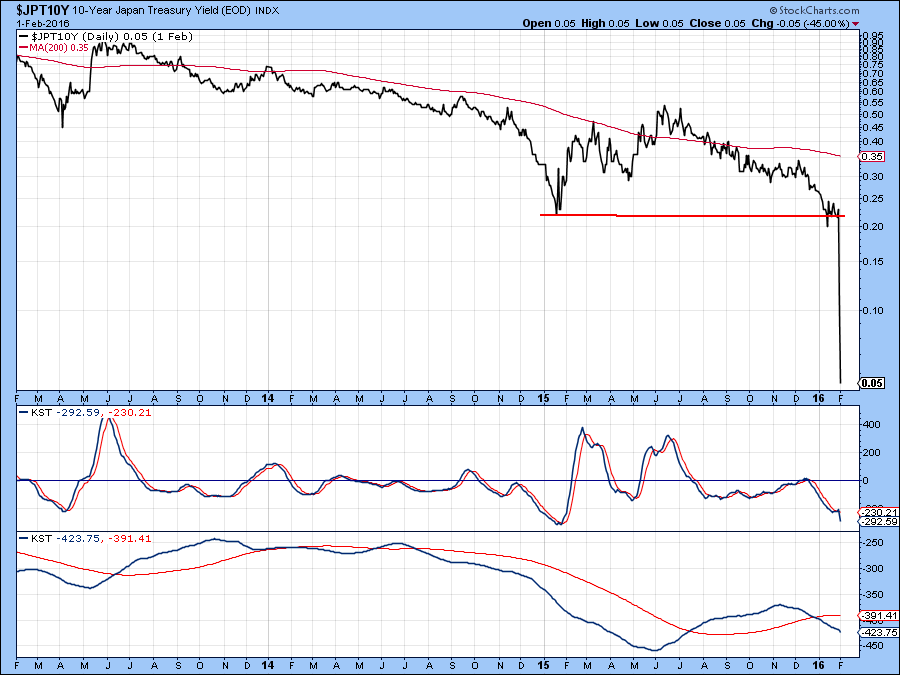
TREASURY YIELDS FALL TO THREE-YEAR ... The rapid descent in global bond yields continues uninterrupted. The 10-Year Japanese bond yield recently fell into negative territory for the first time in its history. That's helping drive sovereign bond yields lower everywhere else. Chart 1 shows the 10-Year Treasury Yield falling...
READ MORE
MEMBERS ONLY

TRANSPORTS TEST LONG-TERM SUPPORT LINES -- AIRLINES AND TRUCKERS ATTRACT SOME BUYING -- TRANSPORTATION/UTILITY RATIO IS OVERSOLD -- SO IS THE TRANSPORTATION/INDUSTRIAL RATIO -- THE DOW USUALLY HOLDS UP BETTER IN A WEAK MARKET
by John Murphy,
Chief Technical Analyst, StockCharts.com
TRANSPORTS START TO SHOW SOME BOUNCE... Transportation stocks have been one of the weakest parts of the stock market over the last year. In fact, the downtrend in that economically-sensitive group was cited several times last year as a negative warning for the economy and stock market. The daily bars...
READ MORE
MEMBERS ONLY

Intermediate Indicators Still Signal A Rally But Remember, It's A Bear Market
by Martin Pring,
President, Pring Research
* Monday may have been a successful test of the January low
* Five inter-market relationships break out
* The 5-year yield breaks down
For the last two weeks I have been pointing out that several intermediate type indicators that have traditionally signaled rallies were in a bullish mode. The problem is that...
READ MORE
MEMBERS ONLY

CONSUMER DISCRETIONARY AND TECHNOLOLGY STOCKS LEAD MARKET LOWER -- NASDAQ UNDERPERFORMANCE IS A BAD SIGN -- GOLD STOCKS HAVE A STRONG WEEK -- MONEY ALSO FLOWS TO UTILITIES, TELECOM, AND FOOD -- TYSON FOODS HITS RECORD HIGH -- NETFLIX TUMBLES BELOW SUPPORT
by John Murphy,
Chief Technical Analyst, StockCharts.com
CONSUMER DISCRETIONARY SPDR LEADS MARKET LOWER... It's never a good sign to see economically-sensitive stocks leading the market lower. That's because they're most closely tied to investor confidence (or lack therof) in the U.S. economy. But that's what happened this week....
READ MORE
MEMBERS ONLY

NASDAQ LEADS MARKET INTO BAD END FOR THE WEEK -- INTERNET-RELATED STOCKS LEAD TECHNOLOGY SECTOR LOWER -- AMAZON.COM BREAKS 200-DAY AVERAGE -- THAT'S ALSO BAD FOR CONSUMER DISCRETIONARY STOCKS WHICH ARE BIG FRIDAY LOSERS
by John Murphy,
Chief Technical Analyst, StockCharts.com
NASDAQ LEADS MARKET LOWER ... A 3% loss in the Nasdaq market is pulling the rest of the market lower. Chart 1 shows the Nasdaq Composite Index bearing down on last week's low. The Nasdaq/S&P 500 ratio (below chart) has plunged to the lowest level in...
READ MORE
MEMBERS ONLY

FALLING DOLLAR GIVES OIL AND GOLD A BOOST -- BARRICK GOLD AND NEWMONT LEAD GOLD MINERS HIGHER -- AMAZON.COM TESTS 200-DAY AVERAGE -- TESLA MOTORS FALLS TO TWO-YEAR LOW -- FINANCIAL STOCKS NEED A REBOUND IN BOND YIELDS
by John Murphy,
Chief Technical Analyst, StockCharts.com
DOLLAR PLUNGES ... The dollar is having its worst day in months. Chart 1 shows the Power Shares Dollar Index (UUP) tumbling to the lowest level in three months. That's due partially to the recent drop in U.S. rates, falling stock prices, and weak economic news which have...
READ MORE
MEMBERS ONLY
The BOJ Did Not Start The Trend - They Are Following It
by Martin Pring,
President, Pring Research
* Global rates are in freefall
* Interest-sensitive sectors will continue to improve their relative action
* Two sectors that are likely to underperform
The recent move by the Bank of Japan (BOJ) confirmed what rates around the world have already been doing, i.e. moving lower. In Japan’s case, some rates...
READ MORE
MEMBERS ONLY

PLUNGE IN JAPANESE BOND YIELD PULLS TREASURY YIELD TO NINE-MONTH LOW -- THAT HELPS EXPLAIN WHY BONDS RALLIED WITH STOCKS ON FRIDAY -- FALLING BOND YIELD IS GOOD FOR UTILITIES AND OTHER DIVIDEND PAYERS, BUT BAD FOR BANKS AND INSURERS
by John Murphy,
Chief Technical Analyst, StockCharts.com
10-YEAR TREASURY YIELD FALLS TO NINE-MONTH LOW... A seemingly strange thing happened on Friday. The Bank of Japan surprised everyone by adopting a negative interest rate for the first time by pushing its short-term rate below zero. Not surprisingly, the Japanese yen plunged 2% and Japanese stocks jumped 2.8%...
READ MORE
MEMBERS ONLY

JAPANESE MOVE TO NEGATIVE RATES PUSHES YEN SHARPLY LOWER AND JAPANESE STOCKS HIGHER -- THAT FAVORS WISDOM TREE JAPAN HEDGED EQUITY ETF OVER JAPANESE ISHARES -- FTSE ALL WORLD STOCK INDEX IS AT POTENTIAL SUPPORT LEVEL AND OVERSOLD
by John Murphy,
Chief Technical Analyst, StockCharts.com
PLUNGE IN YEN... The Bank of Japan (BOJ) announced this morning a move to negative interest rates for the first time in its history. That pushed Japanese yields sharply lower and caused the yen to plunge. Chart 1 shows the Japanese yen plunging -2% today, which is its biggest drop...
READ MORE
MEMBERS ONLY

FALLING BOND YIELDS BOOST UTILITIES -- AT&T HITS RECORD HIGH -- FOOD STOCKS LEAD CONSUMER STAPLES -- DOLLAR WEAKENS WITH SHORT-TERM RATES -- DOW BOUNCES ON RISING CRUDE
by John Murphy,
Chief Technical Analyst, StockCharts.com
BONDS AND UTILITIES ARE RISING TOGETHER... With the 10-Year Treasury yield slipping back below 2.00%, bond prices are rising. The daily bars in Chart 1 show the Barclays 7-10 Year iShares (IEF) nearing its January high. Rate-sensitive stocks like utilities usually rise right along with bonds. Chart 2 shows...
READ MORE
MEMBERS ONLY

STOCKS TURN DOWN AS BONDS BOUNCE -- APPLE WEIGHS ON TECHNOLOGY AS VERIZON HAS STRONG DAY -- WEAKER DOLLAR BOOSTS GOLD
by John Murphy,
Chief Technical Analyst, StockCharts.com
STOCK INDEXES TURN DOWN ... Stocks are weakening after the Fed statement. Chart 1 shows the DJ Industrial SPDR (DIA) reversing down in late afternoon trading. It may now retest last week's low. Chart 2 shows the S&P 500 SPDRS (SPY) doing the same. Chart 3 shows...
READ MORE
MEMBERS ONLY

DOLLAR DIRECTION IS IMPORTANT FOR GLOBAL STOCKS AND COMMODITIES -- SAFE HAVEN BUYING HAS PUSHED JAPANESE YEN HIGHER AND STOCKS LOWER -- U.S. STOCK INDEXES TRY TO BOUNCE OFF AUGUST LOWS -- TODAY'S FED ANNOUNCEMENT COULD BE IMPORTANT
by John Murphy,
Chief Technical Analyst, StockCharts.com
DOLLAR DIRECTION MAY HOLD KEY TO CRUDE OIL ... Everyone is waiting to hear what the Fed has to say today. Markets appear to hoping for a more dovish statement. Currency traders are also paying very close attention. That's because Fed policy has a big impact on dollar direction....
READ MORE