MEMBERS ONLY

GLOBAL STOCK BOUNCE CONTINUES -- OVERSOLD CHINESE STOCKS SHOW SOME BOUNCE -- EEM AND EAFE ISHARES BOUNCE OFF CHART SUPPORT -- SELLING IN TREASURIES, THE EURO, AND YEN SHOWS MORE CONFIDENCE

by John Murphy,
Chief Technical Analyst, StockCharts.com
CHINESE STOCKS REBOUND... Global stocks opened higher this morning from deeply oversold conditions. In many cases, those rebounds have also taken place from potential support levels. Chinese shares in Hong Kong and Shanghai jumped 3.6% and 5.3% respectively. That also relieved selling pressure around the globe. While it&...
READ MORE
MEMBERS ONLY

STOCK INDEXES ARE TRYING TO HOLD LAST OCTOBER'S LOW -- MORE BACKING AND FILLING IS NEEDED TO REPAIR TECHNICAL DAMAGE -- SAMPLES OF PREVIOUS CORRECTION BOTTOMS -- LONG-TERM UPTREND IS STILL INTACT
by John Murphy,
Chief Technical Analyst, StockCharts.com
DOW TRIES TO HOLD LAST OCTOBER'S LOW... My Saturday message suggested that U.S. stock indexes could drop to last October lows; but that those lows should hold if this is just a market correction (and not a major top). Chart 1 shows the Dow Industrials trying to...
READ MORE
MEMBERS ONLY
Whipsaw Decline Or The Start Of The Right Shoulder?

by Martin Pring,
President, Pring Research
* Monday’s action suggests a short-term rally is in the cards.
* Action by the S&P 48-month ROC argues for a bear market.
Catching a falling knife with your bear hands is never fun. Sorry, Freudian slip. Should be bare hands! I am not going to try to call...
READ MORE
MEMBERS ONLY

GRAY MONDAY, BULK OF THE EVIDENCE HAS TURNED, TREND IN FORCE UNTIL, MARKING FIRST RESISTANCE, NIKKEI BREAKS, FTSE HITS 30-MONTH LOW, DAX AND CAC TREND LOWER, EURO AND YEN SURGE
by John Murphy,
Chief Technical Analyst, StockCharts.com
GRAY MONDAY REARS ITS UGLY HEAD... Stocks are in the midst of a global rout that is turning into another Black Monday - of sorts. So far, there have been three Black Mondays in stock market history. The first was on October 28th, 1929, when the Dow fell 13%. This...
READ MORE
MEMBERS ONLY

STOCKS HAVE ENTERED WAVE 4 CORRECTION -- 2015 DOWNTURN CLOSELY MATCHES 2011 CORRECTION WHICH BOTTOMED IN OCTOBER -- TO KEEP THE LONG-TERM UPTREND INTACT, LAST OCTOBER'S LOWS HAVE TO HOLD -- VIX INDEX SURGES TO NEW 2015 HIGH
by John Murphy,
Chief Technical Analyst, StockCharts.com
AN ELLIOTT WAVE UPDATE ... My market message from July 9 offered my Elliott Wave analysis of the NYSE Composite Index. Chart 1 is an updated version of that view. The five red numerals show a five-wave advance from its 2011 bottom. My view was that the May peak in the...
READ MORE
MEMBERS ONLY

EW S&P 500 ETF CONFIRMS REVERSAL PATTERN, QUANTIFYING SELLING DISPERSION, SMALL-CAPS LEAD AD LINES LOWER, NASDAQ 100 LEADS NEW LOW EXPANSION, BANKS, BROKERS AND RETAILERS BREAK DOWN, SEVERAL ASIAN INDICES ARE IN BEAR MARKETS
by John Murphy,
Chief Technical Analyst, StockCharts.com
EW S&P 500 ETF CONFIRMS REVERSAL PATTERN... Programming Note: We are having technical difficulties with the screen recording software and there is no video today. I apologize and will get it fixed this weekend. The Equal-Weight S&P 500 ETF (RSP) is a good ETF to use...
READ MORE
MEMBERS ONLY

Major Equity Market Breakdowns Warn of Lower Prices to Come
by Martin Pring,
President, Pring Research
* McClellan Volume Model for NASDAQ goes bearish.
* EEM breaks down from a major top.
* Chinese equities are right on the brink.
The last time I wrote about equities, two weeks ago, I pointed out the dearth of breadth. I also mentioned that following the end of the 'bullish end-of-the-month&...
READ MORE
MEMBERS ONLY

FTSE ALL WORLD INDEX FALLS BELOW SUPPORT TO DEEPEN CORRECTION -- U.S. SUFFERS MORE TECHNICAL DAMAGE AS SEVERAL STOCK INDEXES FALL TO SIX-MONTH LOWS -- THE S&P 500 FALLS BELOW 200-DAY AVERAGE
by John Murphy,
Chief Technical Analyst, StockCharts.com
FTSE ALL WORLD INDEX FALLS TO SEVEN-MONTH LOW... Global stock selling is intensifying. Big losses are seen in developed and emerging markets in Asia, Europe, and the Americas. And more technical damage is being done. Chart 1 shows the FTSE All World Index (which includes the U.S.) falling below...
READ MORE
MEMBERS ONLY

GLOBAL STOCKS REMAIN UNDER PRESSURE -- EAFE ISHARES DROP BELOW 200-DAY AVERAGE -- EMERGING MARKET ISHARES FALL TO TWO YEAR LOWS -- NYSE COMPOSITE INDEX STILL LOOKS BEARISH -- SO DO MARKET BREADTH FIGURES
by John Murphy,
Chief Technical Analyst, StockCharts.com
EAFE ISHARES FALL BELOW 200-DAY AVERAGE... The trend in global stocks continues to weaken. As usually happens sooner or later, weakness in foreign markets is starting to weigh more heavily on the U.S. Chart 1 shows EAFE iShares (EFA) falling below its 200-day today for the first time since...
READ MORE
MEMBERS ONLY

SMALL AND MID CAP ETFS BOUNCE WITHIN CORRECTIONS, UPTREND TRUMPS FLAG BREAK IN XLF, INSURANCE HITS NEW HIGH AS REGIONAL BANKS RECOVER, FINANCE BREADTH IMPRESSES, FINDING BREADTH SYMBOLS, COMMODITY ETF BECOMES VERY OVERSOLD, OIL REMAINS IN STEEP DOWNTREND
by John Murphy,
Chief Technical Analyst, StockCharts.com
SMALL AND MID CAP ETFS BOUNCE WITHIN CORRECTIONS... Link for today's video. Small-caps have been the Achilles heel of the stock market by showing both relative and absolute weakness the last two months. Even with this poor performance, the decline in the Russell 2000 iShares (IWM) over the...
READ MORE
MEMBERS ONLY

SPY LOSES MOMENTUM, DIVERGENCE FOR RSP, HOME BUILDERS ETFS HIT NEW HIGHS, NETWORKING ETF BREAKS WEDGE, SEMIS SLIP, FINDING POCKETS OF STRENGTH, BONDS BREAK FREE AS COMMODITIES EXTEND LOSSES, SCTR MAKES BIG MOVE FOR XLY, IYR LEADS IN JULY-AUGUST
by John Murphy,
Chief Technical Analyst, StockCharts.com
S&P 500 SPDR LOSES MOMENTUM... Link for today's video. Before getting too bearish on the S&P 500 SPDR (SPY), chartists should keep in mind that this broad index ETF is trading above its rising 200-day SMA, the 50-day SMA is above the 200-day and...
READ MORE
MEMBERS ONLY

DOW DEATH CROSS, S&P 500 BREAKS KEY SMA, FINANCE LEADS LOWER, GOLDMAN AND MORGAN WEIGH ON BROKER-DEALERS ETF, BONDS EXTEND SURGE AS UTILITIES GAIN, HANG SENG LEADS CHINESE STOCKS LOWER, DAX LEADS EURO STOCKS LOWER
by John Murphy,
Chief Technical Analyst, StockCharts.com
DOW GETS DEATH CROSS AS S&P 500 BREAKS 200-DAY... The major index ETFs were down in early trading on Wednesday with the finance, technology and consumer discretionary sectors leading the way lower. It is quite negative to see these key sectors leading on the way down. The Dow...
READ MORE
MEMBERS ONLY

REVIEW OF MAJOR INDEX ETFS (QQQ,SPY,IJR,MDY),HOUSING AND RETAIL SPLIT, BIOTECH ETFS TEST KEY SUPPORT LEVELS, SPOT CRUDE TESTS 2015 LOWS, COPPER AND ALUMINUM HIT MULTI-YEAR LOWS, WEBINAR DETAILS
by John Murphy,
Chief Technical Analyst, StockCharts.com
REVIEW OF MAJOR INDEX ETFS (QQQ,SPY,IJR,MDY)... Click here for the webinar recording. The large-cap index ETFs continue to be tossed and turned within trading ranges, while the small and mid cap index ETFs remain in corrective mode. Chart 1 shows the S&P 500 SPDR (SPY)...
READ MORE
MEMBERS ONLY

Commodities Have Stopped Going Down... But For How Long?
by Martin Pring,
President, Pring Research
* Momentum indicators for commodities are turning up.
* The Dollar Index has violated a small down trend line.
The major averages have moved sideways over the last 12-months or so but under the surface a few sectors have managed to gain in price and some have lost considerable ground. Chart 1...
READ MORE
MEMBERS ONLY

SMALL-CAP ETF TESTS SUPPORT, SMALL-GROWTH AND EW QQQ SURPRISE, FINANCE-HEALTHCARE-TECH-STAPLES LEAD, BANK ETFS FORM CONTINUATION PATTERNS, HACK HITS KEY RETRACEMENT, TWO CYBER SECURITY STOCKS, VIDEO DETAILS
by John Murphy,
Chief Technical Analyst, StockCharts.com
SMALL-CAP ETF TESTS SUPPORT AGAIN... Link for today's video. I noted that the "average" stock is in correction mode in last week's Market Message and also showed the short-term downtrends in the small-cap, mid-cap and equal-weight ETFs. These short-term downtrends remain in play, but...
READ MORE
MEMBERS ONLY

AVERAGE STOCK CORRECTING, XLK ISLAND-PENNANT, RYT BEAR CHANNEL, XSD FIRMS AS IGN BREAKS WEDGE, ITB HOLDS TREND AMID DISPERSION, XRT TESTS SPRING LOWS, CHARTLIST, SUMMARY AND MARKETCARPET DEMO, VIDEO TIMELINE
by John Murphy,
Chief Technical Analyst, StockCharts.com
AVERAGE STOCK IS CORRECTING... Link for today's video. As its names suggest, the Equal-Weight S&P 500 ETF (RSP) tells us what is happening to the average stock in the S&P 500. This is opposed to the S&P 500 SPDR, which is weighted...
READ MORE
MEMBERS ONLY

QQQ BREAKS SMALL WEDGE, IWM EXTENDS CORRECTION, CONSUMER DISCRETIONARY AND HEALTHCARE WEIGH, ENERGY GETS OVERSOLD BOUNCE
by John Murphy,
Chief Technical Analyst, StockCharts.com
QQQ BREAKS SMALL WEDGE... Weakness in techs and small-caps weighed on the market Thursday. Chart 1 shows the Nasdaq 100 ETF (QQQ) falling over 1% with a sharp decline late Thursday afternoon. The ETF is still in an uptrend overall, but today's decline broke wedge support for a...
READ MORE
MEMBERS ONLY
Recent Quiet Market Action Continues To Mask Deteriorating Breadth
by Martin Pring,
President, Pring Research
* Special K continues to point to lower stock prices.
* Dollar looks set to break out on the upside.
* Euro and yen denominated commodities at new lows.
The market continues to move sideways, but under the surface things continue to deteriorate. For example, Chart 1 features a cumulative line derived from...
READ MORE
MEMBERS ONLY

SECTOR/INDUSTRY STALEMATES, SPY MAINTAINS TREND, MDY AND IJR CORRECT, FINANCE MAINTAINS UPTREND WITH INSURANCE LEADING, STAPLES LEAD AS DISCRETIONARY GETS STUCK, INDEX AD LINES TURN MIXED, SECTOR BREADTH, WEBINAR DETAILS
by John Murphy,
Chief Technical Analyst, StockCharts.com
SECTOR STALEMATE DEFINES TRADING RANGE... Click here for the Webinar recording. The S&P 500 and SPY are stuck in trading ranges because sector performance is split. Chartists can even see the market split at the industry group level as well. Looking at six-month performance for the 100+ Dow...
READ MORE
MEMBERS ONLY

TLT HITS MOMENT-OF-TRUTH, 30-YR T-YIELD TESTS, YIELD CURVE REMAINS POSITIVE, CRUDE SUFFERS BIGGEST DECLINE, COMMODITIES BOOSTS BONDS, UTILITIES LEAD IN JULY, REITS BOUNCE WITH BONDS
by John Murphy,
Chief Technical Analyst, StockCharts.com
TLT HITS MOMENT-OF-TRUTH WITH BIG WEEK ... Link for today's video. The first week of the month is always packed with economic reports and employment data, which makes it a big week for bonds. Bonds caught a bid over the last three weeks as the 20+ YR T-Bond ETF...
READ MORE
MEMBERS ONLY

SPY HOLDS UPTREND, SECTOR SPLIT DEFINES RANGE, REVIEWING 2007 TOP, SECTOR BREADTH IN 2007-2008, SECTOR BREADTH IN 2015, HEALTHCARE PROVIDERS ETF CORRECTS, SOFTWARE ETF CONSOLIDATES, AIRLINES TRY TO TAKE OFF
by John Murphy,
Chief Technical Analyst, StockCharts.com
SPY UPTREND CONTINUES TO HOLD... Link for today's video. By now we are all aware of deteriorating breadth on the NYSE and relative weakness in small-caps. We are also well aware of the trading range for the S&P 500 since March. The trading ranges for the...
READ MORE
MEMBERS ONLY

NYSE COMPOSITE REMAINS IN CONSOLIDATION -- % OF NYSE STOCKS ABOVE MOVING AVERAGES NEEDS TO SHOW IMPROVEMENT -- S&P INDEXES BOUNCE OFF 200-DAY AVERAGES -- SMALL CAPS NEED TO DO BETTER -- TRANSPORTS FINALLY SHOW SOME BOUNCE -- DOLLAR REBOUND CONTINUES
by John Murphy,
Chief Technical Analyst, StockCharts.com
NYSE COMPOSITE FINDS SUPPORT AT MARCH LOW... I wrote a message three Thursdays ago (July 9) on Elliott Waves which suggested that the May high on the NYSE Composite Index had completed a major upwave from its 2011 bottom (Wave 3), and was entering a Wave 4 period of correction...
READ MORE
MEMBERS ONLY

SECTORS FOR FOCUS, EW S&P 500 CORRECTS, PPO AS A TREND INDICATOR, AMAZON EFFECT DISSIPATES IN RCD, RETAIL WEAKENS AS HOUSING HOLDS, HEALTHCARE-STAPLES LEAD, TWO INTERNATIONAL ETFS TO WATCH, WEBINAR EXTRAS
by John Murphy,
Chief Technical Analyst, StockCharts.com
FOUR SECTORS FOR FOCUS ... Click here for the webinar recording. The materials and energy sectors are weighing on the broader market with outsized losses, but the broader market is still holding up relatively well. PerfChart 1 shows the performance for RSP and the nine equal-weight sectors since the beginning of...
READ MORE
MEMBERS ONLY

MARKING SUPPORT FOR BIOTECH ETFS, BANKING ETFS MAINTAIN TRENDS, FINANCE-STAPLES-HEALTHCARE LEAD NEW HIGHS, CHINESE STOCKS FALL FROM RETRACEMENT, HIGH-LOW PERCENT INDICATORS TURN, SECTOR RANKINGS REMAIN UNCHANGED
by John Murphy,
Chief Technical Analyst, StockCharts.com
MARKING KEY SUPPORT FOR BIOTECH ETFS... Link for today's video. Biotechs were star performers in 2012, 2013 and 2014. These stocks, and their respective ETFs, are also leading in 2015, even after last week's big decline. The Biotech iShares (IBB) and Biotech SPDR (XBI) are both...
READ MORE
MEMBERS ONLY

Is it Time to Pull the Plug?
by Martin Pring,
President, Pring Research
* NASDAQ, IWM and NYSE Composite face key tests early next week.
* Confidence in the bond market about to snap?
* Dow violates key bull market trendline.
Market tops are not usually straight up and down affairs but typically experience a trading range separating the primary bull from the bear. During that...
READ MORE
MEMBERS ONLY

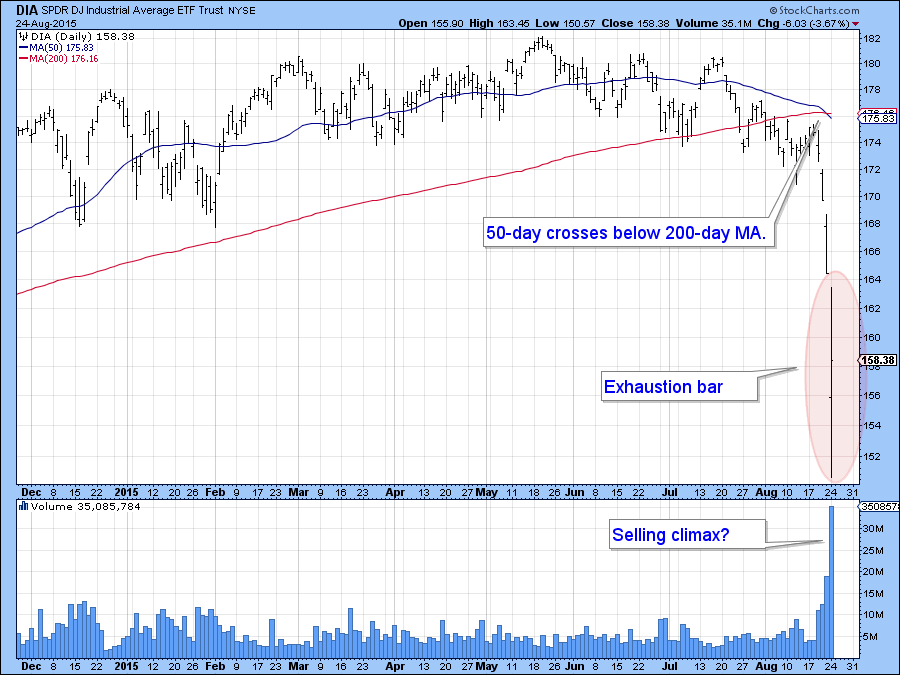
DOW ENDS THE WEEK BELOW 200-DAY AVERAGE -- INDUSTRIAL SPDR DROPS TO NINE-MONTH LOW -- S&P 500 ENDS BELOW 50-DAY LINE -- SMALL AND MIDCAP STOCKS THREATEN 200-DAY LINES -- NYSE ADVANCE-DECLINE LINE HITS NEW LOW -- CRB INDEX FALLS TO SIX-YEAR LOW
by John Murphy,
Chief Technical Analyst, StockCharts.com
DOW ENDS BELOW 200-DAY LINE -- XLI FALLS TO NEW 2015 LOW... The stock market had a bad chart week. Chart 1 shows the Dow Industrial Average closing well below its 200-day moving average and within striking distance of its July low. [Friday's drop marked the first "...
READ MORE
MEMBERS ONLY

UPTRENDS UNDER THREAT, BUT NOT REVERSED, SECTOR LEADERS ARE NEGATIVELY CORRELATED, CONSUMER DISCRETIONARY HOLDS THE KEY, HOUSING ETFS MAINTAIN UPTRENDS, RETAIL SPDR CONSOLIDATES WITHIN TREND, IS CORN FOR REAL?
by John Murphy,
Chief Technical Analyst, StockCharts.com
UPTRENDS ARE UNDER THREAT, BUT NOT YET REVERSED... Link for today's video. The major stock indices are still in uptrends, but price action has flattened over the last few months. Nevertheless, the S&P 500 is still around 2% from its all time high, while the S&...
READ MORE
MEMBERS ONLY

FIVE WEAK SECTORS ARE PULLING MARKET LOWER -- ENERGY AND MATERIALS ARE BEING HURT BY FALLING COMMODITIES -- UTILITIES, TELECOM, AND REITS ARE BEING HURT BY FALLING BOND PRICES -- CATERPILLAR AND 3M LEAD INDUSTRIALS LOWER
by John Murphy,
Chief Technical Analyst, StockCharts.com
FIVE SECTORS PULLING S&P 500 LOWER... There are ten major sectors in the S&P 500. Although five of them have held up relatively well, five others are in downtrends and dragging the market lower. Two of the worst sectors are tied to falling commodity prices. Chart...
READ MORE
MEMBERS ONLY

APPLE, MICROSOFT, AND CHIP STOCKS PULL TECHNOLOGY SECTOR LOWER -- EQUAL WEIGHTED NASDAQ AND TECHNOLOGY ETFS ARE NOT CONFIRMING RECENT ADVANCES -- EQUAL WEIGHTED S&P 500 ETF ALSO SHOWS RELATIVE WEAKNESS
by John Murphy,
Chief Technical Analyst, StockCharts.com
APPLE AND MICROSOFT PULL TECHNOLOGY SECTOR LOWER... Heavy selling in Apple and Microsoft is pulling the technology sector lower today. Chart 1 shows Apple (AAPL) gapping down in morning trading. Chart 2 shows Microsoft (MSFT) trading lower as well. Since those two are among the biggest stocks in the technology...
READ MORE
MEMBERS ONLY

The Market May Rally But Take Note, It's Getting Pretty Selective Out There
by Martin Pring,
President, Pring Research
* Dow diffusion indicator still on a buy signal.
* Dow Jones Composite Index facing important technical challenge.
* The reflation gold rallies in Euro and Yen are over.
Long-term Background
Last week at the webinar I came to the conclusion that enough short-term indicators were reversing from oversold readings to justify a...
READ MORE
MEMBERS ONLY

MAJOR INDICES BIFURCATE, EW S&P 500 STALLS IN TREND, IWM REMAINS IN UPTREND, MINDING THE GAPS, WEAKNESS WITHIN TECHNOLOGY, SEMIS WEIGH, HACK LOOKS VULNERABLE, WEBINAR FEATURES
by John Murphy,
Chief Technical Analyst, StockCharts.com
MAJOR STOCK INDICES BIFURCATE ... Click here for the webinar recording. The stock market is still positive year-to-date, but we are starting to see some bifurcation in the major indices over the last few months. It is still not clear if these divergences will lead to a significant decline or if...
READ MORE
MEMBERS ONLY

QQQ BREADTH LAGS, MEDIUM-TERM BREADTH WEAKENS, 55% OF MARKET REMAINS BULLISH, XLY AND XLV LEAD OVERSOLD BOUNCES, GOLD BREAKS TO NEW LOWS, XME AND XES PLUNGE TO NEW LOWS, BREADTH INDICATOR DETAILS AND CHART LINKS
by John Murphy,
Chief Technical Analyst, StockCharts.com
QQQ HITS NEW HIGH, BUT BREADTH LAGS... After a nice vacation and some time away from the market, I am going to start of with the indicator tables for the major index ETFs and sectors to get a broad overview. Before looking at these tables, let's look at...
READ MORE
MEMBERS ONLY

MARKET CONTINUES TO ADVANCE -- CITIGROUP BREAK OUT LEADS FINANCIAL SECTOR -- CELGENE, GILEAD, AND AMGEN LEAD BIOTECHS HIGHER -- GOOGLE BREAKOUT PACES INTERNET UPTURN -- TOBACCO STOCKS PUSH CONSUMER STAPLE SPDR TO NEW HIGH
by John Murphy,
Chief Technical Analyst, StockCharts.com
CITIGROUP PACES STRONG FINANCIAL GROUP... Financial stocks are having another good chart day. Chart 1 shows the Financials Sector SPDR (XLF) jumping to a new seven-year high today. Once again, banks are helping lead the way. Chart 2 shows the KBW Bank SPDR (KBE) nearing a new seven year high...
READ MORE
MEMBERS ONLY

DOLLAR STRENGTHENS AS EURO FALLS -- CANADIAN DOLLAR DROPS TO SIX-YEAR LOW -- COMMODITY PRICES WEAKEN ON RISING DOLLAR -- ENERGY AND METAL STOCKS WEAKEN -- GOLD AND SILVER STOCKS THREATEN MAJOR SUPPORT LEVELS -- BANK OF AMERICA AND USB PACE BANK RALLY
by John Murphy,
Chief Technical Analyst, StockCharts.com
DOLLAR RISES AGAINST THE EURO -- CANADIAN DOLLAR HITS SIX-YEAR LOW... Chart 1 shows the Power Shares Dollar Bullish Fund (UUP) nearing the highest close in a month, after having broken a three-month falling ressistance line. The longer-range trend of the greenback remains up as shown by the rising 200-day...
READ MORE
MEMBERS ONLY

Is The Chinese Equity Bull Market Over?
by Martin Pring,
President, Pring Research
* 25-day ROC experiences a mega oversold.
* Shanghai Composite rallies from 200-day MA.
* In 1929 in the US and 2007 in China, stocks retraced 50% of their first bear market decline. What does that say about today?
This week I am focusing on the Chinese equity market since events in China...
READ MORE
MEMBERS ONLY

FRIDAY'S BOUNCE KEEPS STOCK INDEXES ABOVE 200-DAY LINES, BUT ON LIGHT VOLUME -- GREEK STOCK ETF RALLIES ON HOPES FOR A COMPROMISE -- GERMAN AND FRENCH STOCKS ALSO BOUNCE OFF 200-DAY LINES -- AS DOES A VERY OVERSOLD SHANGHAI MARKET
by John Murphy,
Chief Technical Analyst, StockCharts.com
DOW AND S&P 500 HOLD 200-DAY LINES... After a wild week, stocks closed high enough on Friday to hold their 200-day averages. Chart 1 shows the Dow Industrials climbing 211 points on Friday to end above its 200-day line. Chart 2 shows the S&P 500 doing...
READ MORE
MEMBERS ONLY

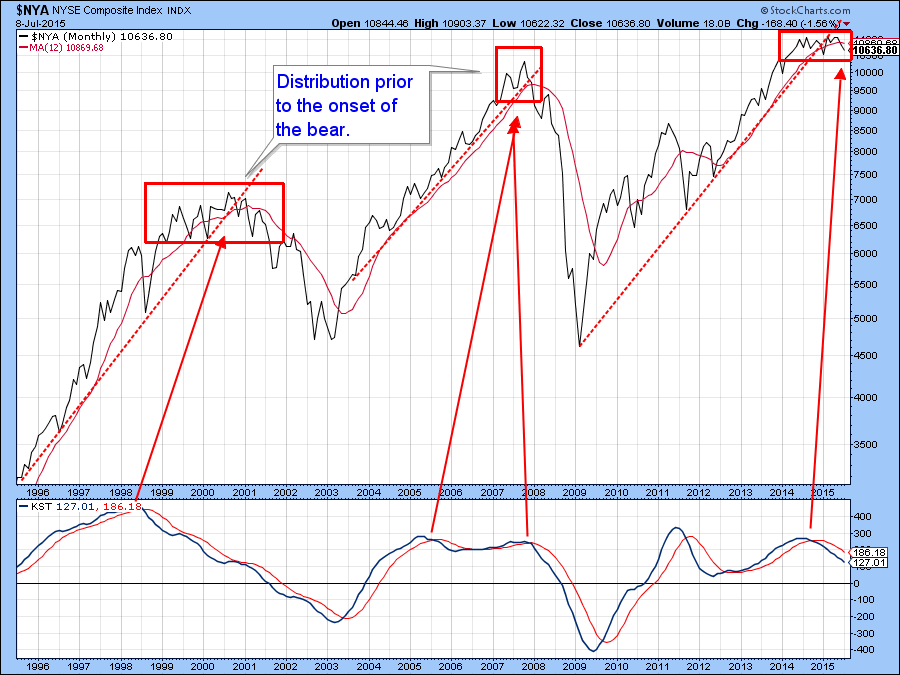
THE FIVE WAVE ADVANCE IN THE NYSE COMPOSITE INDEX SINCE 2011 SUGGESTS THE COMPLETION OF THE THIRD WAVE IN A BULL MARKET -- THE MARKET APPEARS TO HAVE ENTERED A PERIOD OF CONSOLIDATION OR CORRECTION WITHIN ITS MAJOR UPTREND
by John Murphy,
Chief Technical Analyst, StockCharts.com
NYSE INDEX APPEARS TO HAVE COMPLETED A WAVE THREE... They say when you start to feel seasick you should focus on the horizon. Daily market swings are starting to make me feel seasick. So in line with that nautical theme, I'm going to focus on the market'...
READ MORE
MEMBERS ONLY
Longer-term Equity Charts Offering An Ominous Warning
by Martin Pring,
President, Pring Research
* Emerging markets are on the brink.
* The European IEV tentatively breaks its bull market trend line.
* Copper being driven down by weakness in China.
Equities
“Price action on Tuesday was quite remarkable since it seemed at the opening that the equity market was about to fall off a cliff but...
READ MORE
MEMBERS ONLY

PLUNGE IN CHINESE SHARES CONTINUES -- EMERGING MARKETS NEAR TEST OF 2015 LOW -- CANADA STOCKS ARE FALLING ON WEAKER COMMODITIES -- ENERGY SHARES ARE THREATENING SPRING LOW -- RISING VIX RAISES RISK LEVEL FOR STOCKS
by John Murphy,
Chief Technical Analyst, StockCharts.com
CHINESE FREE FALL CONTINUES ... The free fall in Chinese stocks continued again today. Chinese stocks trading on the mainland and Hong Kong lost -6%. Chart 1 shows the phenomenal drop in China iShares (FXI). The FXI has fallen well below is 200-day moving average, and trendline support drawn under its...
READ MORE
MEMBERS ONLY

ADDENDUM TO TODAY'S MESSAGE: UPSIDE TURNAROUND KEEPS STOCK INDEXES ABOVE 200-DAY LINES
by John Murphy,
Chief Technical Analyst, StockCharts.com
DOW AND SPX REGAIN 200-DAY LINE... An afternoon rally has the look of a potential upside reversal day that has allowed the Dow and the S&P 500 to regain their 200-day lines. Chart 1 shows the Dow Industrials trading higher after hitting a five-month low earlier today. That...
READ MORE