MEMBERS ONLY

STEEP FOREIGN LOSSES PULL U.S. STOCKS LOWER -- COPPER STOCKS LEAD MATERIALS LOWER -- SEMIS PLUNGE BELOW 200-DAY AVERAGE AND THREATEN TO DO SAME FOR TECHNOLOGY SPDR -- DOW FALLS TO FIVE-MONTH LOW AS SPX FALLS BELOW 200-DAY LINE

by John Murphy,
Chief Technical Analyst, StockCharts.com
DOW JONES GLOBAL INDEX CONTINUES TO PLUNGE ... Foreign losses continue to deepen. European stocks are down another -1%, while Chinese stocks are losing more ground. EAFE ishares are down -2%, while Emerging Markets iShares (EEM) are falling -3%. [A stronger dollar is hurting foreign stocks ETFs even more because they&...
READ MORE
MEMBERS ONLY

GREEK NO VOTE PULLS GLOBAL MARKETS LOWER AGAIN -- FOREIGN SHARES LEAD US LOWER -- FALLING ENERGY SHARES LEAD TO PLUNGE IN CRUDE -- FALLING CHINESE STOCKS HURT COPPER AND AUSSIE DOLLAR --
by John Murphy,
Chief Technical Analyst, StockCharts.com
FOREIGN STOCK ETFS TUMBLE ... Today's plunge in global stocks is reminiscent of what happened last Monday. Except the global downturn in getting more serious. Although U.S. stocks are falling, foreign markets are falling a lot more. Chart 1 shows EAFE iShares (EFA) falling more than 2% to...
READ MORE
MEMBERS ONLY

IS LOW VOLATILITY GOOD?, A LOOK AT THE 2008 BREAK DOWN, 2008 MARKET MESSAGE, $SPX AND THE CURRENT BBAND STATUS, CURRENT SMALL-CAP SIGNAL IS BULLISH, KEY SUPPORT FOR QQQ, CONTRACTIONS FOR HOUSING, SEMICONDUCTOR AND RETAIL SPDRS
by John Murphy,
Chief Technical Analyst, StockCharts.com
IS LOW VOLATILITY A GOOD THING?... Link for today's video. I am going to step back and look at some weekly charts using Bollinger Bands and the BandWidth indicator. As many of us are aware, volatility has declined over the last six months and trading ranges are quite...
READ MORE
MEMBERS ONLY

STOCKS BOUNCE ON HOPE FOR GREEK COMPROMISE -- LONGER RANGE INDICATORS, HOWEVER, SHOW NEGATIVE DIVERGENCES AND SUGGEST DETERIORATION BENEATH THE SURFACE -- DOW WEEKLY AND MONTHLY MACD LINES ARE NEGATIVE -- LESS THAN HALF OF NYSE STOCKS ARE IN UPTRENDS
by John Murphy,
Chief Technical Analyst, StockCharts.com
DOW JONES COMPOSITE AVERAGE HITS NEW LOW... I don't know about you, but I'm tired of hearing about Greece. It makes day-to-day market analysis a lot more difficult. Monday's global stock plunge followed reports of a Greek default. Stocks are now bouncing on reports...
READ MORE
MEMBERS ONLY
Investors no Longer Hunting for Yield as Junk Bonds Break Down

by Martin Pring,
President, Pring Research
* Leading sectors experience false breaks to the upside.
* NYSE A/D Line completes a head and shoulders top.
* Dollar Index may be about to resume its bull market.
US Equities
Last week there appeared to be a sporting chance that the market was headed higher as several short-term indicators were...
READ MORE
MEMBERS ONLY

WEBINAR DETAILS, AUTO ETF CORRECTS, ITB MAINTAINS UPTREND, LEISURE AND ENTERTAINMENT ETF TRENDS LOWER, RETAIL ETFS TAKE HITS, SMALL-CAPS REMAIN BULLISH OVERALL, TECH AND INDUSTRIALS REDDEN, INDICATOR AND SIGNAL OVERVIEW, BREADTH CHART LINKS
by John Murphy,
Chief Technical Analyst, StockCharts.com
WEBINAR DETAILS... The charts and commentary below are from the Webinar on Tuesday, June 30th, at 1PM ET. In this Webinar, I looked at the key industry groups within the consumer discretionary sector because these hold the key to the most economically sensitive sector. I analyzed some key breadth indicators...
READ MORE
MEMBERS ONLY

GLOBAL STOCKS TUMBLE ON GREEK CRISIS -- EUROPE AND ASIA LEAD FOREIGN MARKETS LOWER -- TECHNICAL DAMAGE IS DONE TO U.S. MARKET -- DOW INDUSTRIALS FALL BELOW 200-DAY AVERAGE -- S&P 500 FALLS TO THREE-MONTH LOW
by John Murphy,
Chief Technical Analyst, StockCharts.com
FOREIGN SHARES TUMBLE... Global stocks tumbled today. Chart 1 shows EAFE iShares (EFA) falling 3% to the lowest level in nearly three months, and in very heavy trading. European stocks lost 4% on average, with Germany falling 3.5%. Asian stocks tumbled as well, including Japan (-2.8%) and China...
READ MORE
MEMBERS ONLY

SPY FALLS TO FIRST TEST, SEASONALITY CHARTS AND SUMMER, BONDS COULD BENEFIT FROM DOLDRUMS, JULY TOUGH FOR SMALL-CAPS, LT TREND SYSTEM REMAINS BULLISH, REFINERS CONSOLIDATE WITHIN UPTRENDS
by John Murphy,
Chief Technical Analyst, StockCharts.com
SPY FALLS TOWARDS FIRST TEST... Link for today's video. The major index ETFs are down across the board with the Nasdaq 100 Equal-Weight ETF (QQEW) getting hit the most. Small-caps and large-caps are also down with the Russell 2000 iShares (IWM) and S&P 500 SPDR (SPY)...
READ MORE
MEMBERS ONLY

HOMEBUILDERS HAVE A STRONG WEEK -- LENNAR GAPS HIGHER -- BEAZER HOMES AND KB HOME ALSO HAVE A STRONG WEEK -- RISING BOND YIELDS CONTINUE TO HELP BANKS AND INSURERS WHILE HURTING UTILITIES AND REITS
by John Murphy,
Chief Technical Analyst, StockCharts.com
HOMEBUILDERS HAVE A STRONG WEEK... The daily bars in Chart 1 show the Dow Jones U.S. Home Construction iShares (ITB) ending the week at the highest level in two months. Interestingly, that came in the face of rising bond yields. Earlier in the year, rising bond yields appeared to...
READ MORE
MEMBERS ONLY

MICRO-CAPS LEAD MIXED MARKET, SMALL-CAP ETF AND QQQ HIT NEW HIGHS, EW S&P 500 CONTINUES TO LAG, TREND SORTING WITH THE PPO (DEMO), FOUR KEY SECTOR ETFS ARE STILL TRENDING UP, INDUSTRIALS BREAK DOWN, OIL WEIGHT ON ENERGY
by John Murphy,
Chief Technical Analyst, StockCharts.com
MICRO-CAPS LEAD MIXED MARKET ... Link for today's video. The stock market is not clicking on all cylinders right now, but the majority of cylinders are still in uptrends, even after some selling pressure this month. Today I will look at some key uptrends and show what it would...
READ MORE
MEMBERS ONLY
Oversold Short-term Indicators Suggest Another Attempt At New Highs Is In The Cards
by Martin Pring,
President, Pring Research
* Pring Dow Diffusion indicator triggers a tentative buy signal.
* Net new high bond indicator is deeply oversold.
* Aussie and Canadian dollars experience bullish KST.
US Stocks
Action this week has been somewhat disappointing since several averages and sectors experienced reversal characteristics on Tuesday. This suggests that, over the next few...
READ MORE
MEMBERS ONLY

TRANSPORTS AND UTILITIES STILL IN DOWNTRENDS AND MAY BE PREVENTING UPSIDE BREAKOUT IN THE DOW -- DOW JONES COMPOSITE AVERAGE STILL IN A DOWNTREND AS WELL -- THAT'S A CAUTION SIGN FOR THE DOW
by John Murphy,
Chief Technical Analyst, StockCharts.com
TRANSPORTS AND UTILITIES ARE 2015 LAGGARDS... Chart 1 shows the divergence by the Dow Industrials (which are close to a new record) and the Dow Transports and Utilities which are both in downtrends. Since the start of the year, the industrials have gained 1.6%, while the transports and utilities...
READ MORE
MEMBERS ONLY

SMALL-CAP, MID-CAP AND NASDAQ ETFS LEAD, GROWTH CONTINUES TO LEAD VALUE, CONSUMER DISCRETIONARY ETFS BREAK OUT, HOUSING AND RETAIL LEAD CONSUMER DISCRETIONARY, WEBINAR EXCLUSIVES
by John Murphy,
Chief Technical Analyst, StockCharts.com
SMALL-CAPS, MID-CAPS AND NASDAQ SHOW LEADERSHIP... Note that the charts below are part of the webinar, which was at 1PM on Tuesday, June 23rd (Click here for recording). It is hard to argue against the bulls with the Russell 2000 iShares (IWM), S&P MidCap SPDR (MDY) and Nasdaq...
READ MORE
MEMBERS ONLY

UNIQUE SECTOR BREADTH INDICATORS, LONG-TERM VERSUS MEDIUM-TERM, SECTOR TRENDS, FINANCE AND HEALTHCARE TOP RANKS, ENERGY AND UTILITIES SEE RED, INDUSTRIALS SECTOR RANKS THIRD
by John Murphy,
Chief Technical Analyst, StockCharts.com
SLICING AND DICING THE SECTORS WITH UNIQUE INDICATORS... Link for today's video.. As promised, I am showing a breadth and trend table for the nine sectors today. Using the unique indicators available at StockCharts, chartists can slice and dice a sector by analyzing sector-specific breadth indicators, the cap-weighted...
READ MORE
MEMBERS ONLY

IWM AND XLI FOLLOW UP, BULK OF THE EVIDENCE, SMALL-CAP BULLISHNESS, FINDING SHORT-TERM PULLBACKS, CRUDE FLAGS, XES RELATIVE WEAKNESS, AEROSPACE & DEFENSE ETF BREAKS AND MORE
by John Murphy,
Chief Technical Analyst, StockCharts.com
IWM AND XLI STRATEGY FOLLOW UP... Link for today's video.. Today I am going to step back and focus a little on strategy. The first part will show a basic chart strategy to identify the bigger trend and find pullbacks within this chart. The second part will show...
READ MORE
MEMBERS ONLY

US STOCKS LEAD GLOBAL RALLY -- SMALL CAP INDEXES HIT NEW RECORDS -- MIDCAPS BREAK THROUGH RESISTANCE -- NASDAQ ALSO HITS NEW RECORD -- DOW AND S&P BREAK OUT TO UPSIDE -- RETAILERS LEAD CONSUMER DISCRETIONARY STOCKS HIGHER
by John Murphy,
Chief Technical Analyst, StockCharts.com
SMALL CAPS HIT NEW RECORD HIGHS... Let's start off today where we started yesterday -- with small cap stocks which continue to lead the market higher. Charts 1 and 2 show the S&P 600 and the Russell 2000 Small Cap Indexes hitting new record highs. As...
READ MORE
MEMBERS ONLY

STOCKS BOUNCE ON FED'S INTENTION TO RAISE RATES GRADUALLY -- BONDS BOUNCE ALONG WITH REITS AND UTILITIES -- CONSUMER STAPLES SPDR BOUNCES OFF 200-DAY LINE -- DOLLAR DROP BOOSTS GOLD
by John Murphy,
Chief Technical Analyst, StockCharts.com
STOCKS EXPERIENCE MODEST BOUNCE... Large cap stocks experienced a modest bounce on today's Fed statement about raising rates very gradually. Chart 1 shows the S&P 500 gaining four points (+0.20%) and ending just below its 50-day average. Small caps, which had been testing spring highs,...
READ MORE
MEMBERS ONLY

SMALL CAP INDEXES TEST OLD HIGHS -- GROWTH LEADS VALUE -- MIDCAPS EXCEED 50-DAY AVERAGE -- S&P 500 BOUNCES OFF CHART SUPPORT -- DOW SURVIVES TEST OF 200-DAY LINE WHILE NASDAQ HOLDS UP MUCH BETTER -- WATCHING THE FED AND GREECE
by John Murphy,
Chief Technical Analyst, StockCharts.com
SMALL CAP INDEXES TEST OLD HIGHS... Small cap stocks remain the strongest part of the stock market, and continue to lead the rest of the market higher. Charts 1 and 2 show the S&P 600 Small Cap Index ($SML) and the Russell 2000 Small Cap Index (RUT) in...
READ MORE
MEMBERS ONLY
Is The Greek Stock Market About To Collapse Or Explode?
by Martin Pring,
President, Pring Research
* HYG/IEF bond confidence indicator may be peaking.
* Cyclicals and financials have the ability to break to the upside.
* Spider Metal and Mining and Materials less favored.
US Equities
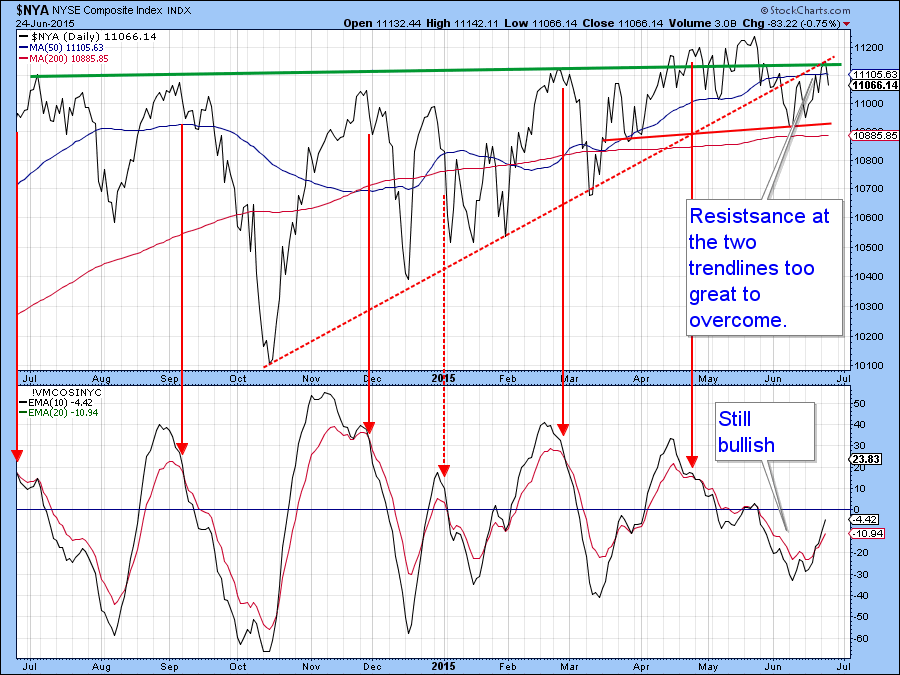
The NYSE Composite ($NYA) continues to trade in a narrow range frustrating bull and bear alike. The 200-day MA often acts...
READ MORE
MEMBERS ONLY

RRG FAVORS SMALL-CAPS, IJR CONSOLIDATES NEAR HIGHS, HEALTHCARE SPDR STALLS AFTER BREAKOUT, MEDICAL SUPPLIES AND MEDICAL EQUIPMENT INDEXES, XLB CORRECTS WITHIN UPTREND, COMMODITY CHEMICALS AND STEEL INDEXES, WEBINAR DETAILS
by John Murphy,
Chief Technical Analyst, StockCharts.com
RRG FAVORS SMALL AND MID CAPS... Note that Julius de Kempenaer and Arthur Hill (moi) recorded a webinar on Tuesday, June 16th. The following charts and commentary come from this webinar. More charts and detailed explanations can be found on webinar recording.
(from Julius de Kempenaer) Chart 1 shows a...
READ MORE
MEMBERS ONLY

3 GAPS DOMINATE SPY, IWM HOLDS SUPPORT, ITB BOUNCES OFF CHANNEL, 6 HOMEBUILDER STOCKS, RETAIL SHOWS RELATIVE STRENGTH, RCD GETS A BAND SQUEEZE, SMALL AND MID CAP BREADTH STRENGTHENS, LARGE-CAP BREADTH WEAKENS
by John Murphy,
Chief Technical Analyst, StockCharts.com
THREE GAPS DOMINATE THE SHORT-TERM TREND FOR SPY... It is currently a tale of two markets. The S&P 500 SPDR (SPY) has been trending lower since late May, but the Russell 2000 iShares (IWM) has been trending higher over this same timeframe. The broader market is likely to...
READ MORE
MEMBERS ONLY

If You Are Bullish On US Equities Try Looking At China For A Signal
by Martin Pring,
President, Pring Research
* - Special K for the NYSE Composite breaks support
* - Emerging markets getting oversold
* - Commodities are about to resolve their recent trading range
A Chinese leading Indicator?
It’s a well-known fact that the Chinese market has been the hottest on earth in recent months. What’s not so...
READ MORE
MEMBERS ONLY

BORING UPTREND, EQUAL-WEIGHT SPX WEAKNESS, IWM FOLLOW UP, INDUSTRIALS SPDR BOUNCES OFF SUPPORT, GE, HON AND UTX STALL, FEDEX HITS NEW HIGH, WILL UPS FOLLOW?, VIDEO EXTRAS
by John Murphy,
Chief Technical Analyst, StockCharts.com
A PERSISTENT AND BORING UPTREND... Link for today's video. The stock market, as measured by the S&P 500, remains in a boring uptrend. Better a boring uptrend than a boring downtrend. As noted in Tuesday's webinar, the 5-day Rate-of-Change has been between +3.5%...
READ MORE
MEMBERS ONLY

GLOBAL STOCKS BOUNCE SHARPLY ON POSSIBLE GREEK COMPROMISE -- DOW AND S&P 500 BOUNCE OFF INITIAL CHART SUPPORT -- NASDAQ HOLDS 50-DAY LINE -- SMALL CAPS LEAD ON THE UPSIDE -- RISING BOND YIELDS KEEP BANKS AND INSURANCE STOCKS RISING
by John Murphy,
Chief Technical Analyst, StockCharts.com
STOCKS BOUNCE SHARPLY OFF CHART SUPPORT... Reports of a compromise between the Germans and Greeks to prevent a default later this month appears to be contributing to a strong global stock rally. European stocks are up 2% on average. U.S. stocks are having a strong day of their own....
READ MORE
MEMBERS ONLY

WEBINAR DETAILS, LARGE-CAPS WEAKEN, SMALL-CAPS HANG TOUGHER, $NDX AND $SPX BREADTH BREAKS, SECTOR BREADTH LINES TURN MIXED, KEY EQUAL-WEIGHT SECTORS HOLD SUPPORT, SCANNING FOR YEAR-TO-DATE STRENGTH
by John Murphy,
Chief Technical Analyst, StockCharts.com
WEBINAR RECORDING AND TIMELINE... The charts and commentary below come from the webinar recording. Note that not all webinar charts are included. Overall, the market remains boring on the outside and mixed up on the inside. The S&P 500 is flat for the year, but some key sectors...
READ MORE
MEMBERS ONLY

What Are The Implications Of Rising World Interest Rates?
by Martin Pring,
President, Pring Research
* -World Bond Index completes a major top.
* -US short-term bonds on the verge of a breakout.
* -Stocks now being threatened by rising rates.
World Bond Index
Global bond markets have really been taking it on the chin recently without that usual push they get from rising commodity prices. Monetary policy...
READ MORE
MEMBERS ONLY

USO TRACKING ERROR, LIGHT CRUDE AND BRENT FORM FLAGS, XES TESTS BREAK, FIVE HORSEMEN OF TECH, FB GETS BREAKOUT, GOOGLE HOLDS BREAKOUT AND AIRLINES WEIGH ON PEJ
by John Murphy,
Chief Technical Analyst, StockCharts.com
USO AND THE LONG-TERM TRACKING ERROR ... Oil surged at the end of May, but fell back last week and remains in a short-term downtrend. For a different perspective, I am going to analyze the August futures contracts for Light Crude and Brent Crude. The USO Oil Fund (USO) and US...
READ MORE
MEMBERS ONLY

DOW AND S&P 500 LOSE GROUND WHILE NASDAQ HOLDS FIRM -- STRONG JOBS REPORT AND BOUNCING DOLLAR BOOST SMALL CAPS -- 10-YEAR TREASURY YIELD SURGES TO EIGHT-MONTH HIGH AND BREAKS DOWNTREND LINE -- 2-YEAR YIELD NEARS FOUR YEAR HIGH
by John Murphy,
Chief Technical Analyst, StockCharts.com
DOW AND S&P 500 SLIP WHILE NASDAQ HOLDS FIRM... U.S. stocks lost ground during the week, but not enough to do any serious chart damage. Chart 1 shows the Dow Industrials falling to the lowest level in a month and sliding below its 50-day moving average (in...
READ MORE
MEMBERS ONLY

MACD HOLDS FOR IWM, QQQ FORMS CUP-HANDLE, FINANCE LEADS SMALL-CAPS, BROKERS LEAD FINANCE, TREASURY YIELDS SURGE, BUT DOES IT MATTER?, YIELD CURVE STEEPENS FURTHER, GOLD AND PALLADIUM BREAK DOWN, MINERS FOLLOW
by John Murphy,
Chief Technical Analyst, StockCharts.com
MACD HOLDS BULLISH FOR IWM... Link for today's video. Chart 1 shows the Russell 2000 iShares (IWM) exceeding the late May high this week and keeping the uptrend alive. Even though IWM has yet to exceed its April highs, the chart is more bullish than bearish right now....
READ MORE
MEMBERS ONLY

Is Thursday's Negative Action The Start Of Something More Serious?
by Martin Pring,
President, Pring Research
* -Brokers experience a bearish two bar reversal.
* -Dollar diffusion indicator ticks up for the first time in many weeks.
* -Gold in dollars experiencing a short-term breakdown.
* -Gold in yen and euro at crucial support levels.
US Equities
The market has been working its way irregularly higher over the last few...
READ MORE
MEMBERS ONLY

FOREIGN STOCKS LEAD THE U.S. LOWER -- EMERGING MARKETS FALL THE HARDEST -- FALLING COMMODITY PRICES WEIGH ON CANADIAN STOCKS -- WEAK ENERGY SHARES LEAD OIL LOWER AS MOST COMMODITIES WEAKEN
by John Murphy,
Chief Technical Analyst, StockCharts.com
FOREIGN STOCKS SHOW NEW WEAKNESS... The global stock market rally is running into trouble. That can be seen more clearly in foreign markets. Chart 1 shows MSCI EAFE iShares (EFA) falling below its 50-day average after backing off from overhead resistance formed last June. Its daily MACD lines (top of...
READ MORE
MEMBERS ONLY

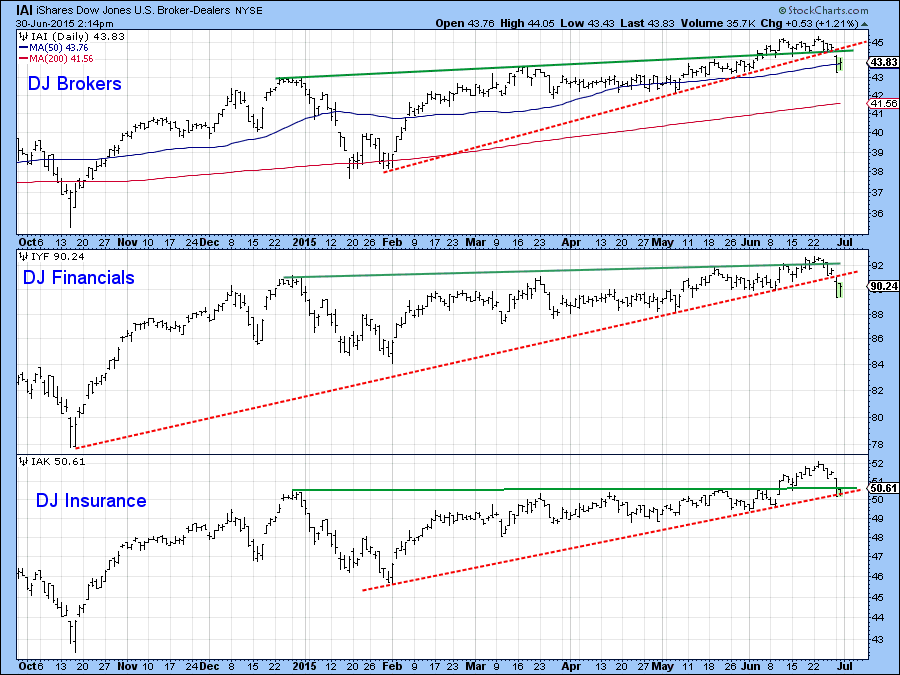
BOND YIELDS SURGE TO NEW 2015 HIGH AS BOND PRICES PLUNGE -- UTILITIES AND REITS FALL WITH BOND PRICES -- BANKS AND LIFE INSURERS RISE WITH BOND YIELDS -- INSURANCE LEADERS ARE UNUM, METLIFE, AND PRUDENTIAL -- BANK SPDR HITS NEW SEVEN YEAR HIGH
by John Murphy,
Chief Technical Analyst, StockCharts.com
BOND YIELDS REACH NEW 2015 HIGH... The surge in bond yields that started a month ago is accelerating to the upside. Chart 1 shows the 10-Year Treasury Note Yield climbing to the highest level since last November. Chart 2 shows the 30-Year T-Bond Yield doing the same. The driving force...
READ MORE
MEMBERS ONLY

FOUR KEY SECTORS IN HOLDING PATTERNS, TIMING ITB AND XHB, REGIONAL BANKS AND BROKER STAY STRONG, WATER BREAKS, OIL FORMS BULL FLAG, XES SURGES WITHIN WEDGE, MACD DIVERGENCES AND CHANDELIERS
by John Murphy,
Chief Technical Analyst, StockCharts.com
50% OF S&P 500 REMAINS IN HOLDING PATTERN... The following charts and brief commentary come from Click here for Tuesday's webinar. The broader market continues to grind higher and we can point the finger at four sectors. Technology and healthcare are doing their part for the...
READ MORE
MEMBERS ONLY

TECHNICAL SUMMATION FOR IWM, SIX STOCKS KEY TO QQQ, RANKING THE 18 SECTORS, BIOTECHS LEAD HEALTHCARE, GILEAD AND REGENERON LEAD IBB, MERCK HOLDS THE GAP, METALS-MINING-STEEL WEAKEN FURTHER, CATERPILLAR AND US STEEL
by John Murphy,
Chief Technical Analyst, StockCharts.com
TECHNICAL EVIDENCE REMAINS BULLISH FOR IWM ... Link for today's video. The Russell 2000 iShares (IWM) has been lagging the broader market since mid April, but the bulk of the evidence remains bullish. Chart 1 shows IWM with four bullish factors and two bearish factors at work. Working from...
READ MORE
MEMBERS ONLY

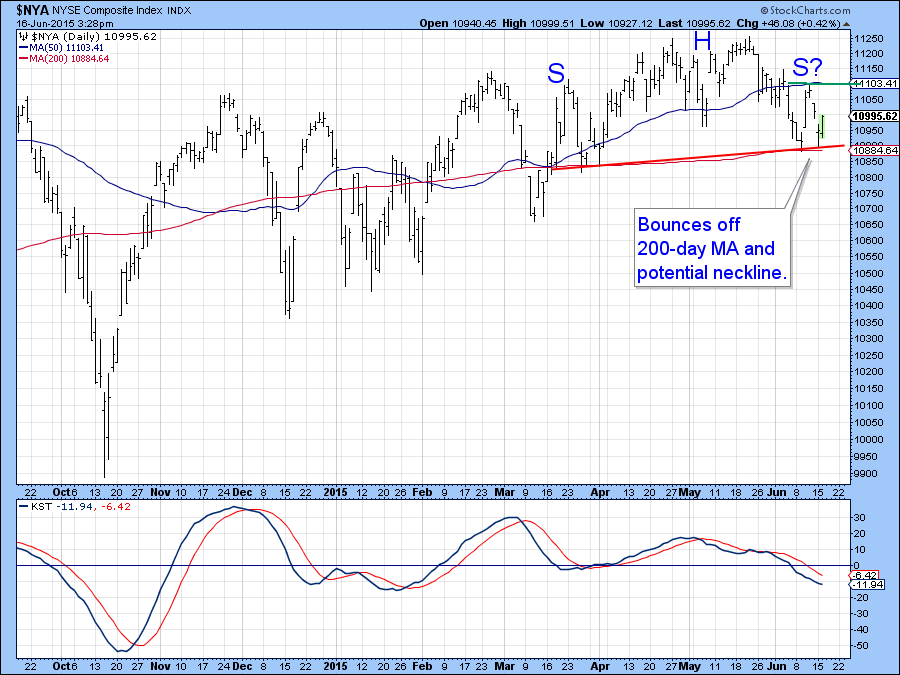
DOW JONES COMPOSITE AVERAGE CLOSES BELOW ITS 200-DAY LINE AS THE DOW INDUSTRIALS ENDS BELOW 50-DAY LINE -- THE DOW INDUSTRIALS ARE SHOWING NEGATIVE DIVERGENCES OF THEIR OWN -- INDUSTRIALS SPDR APPEARS TO BE FORMING HEAD AND SHOULDERS TOP
by John Murphy,
Chief Technical Analyst, StockCharts.com
DOW JONES COMPOSITE AVERAGE CLOSES BELOW 200-DAY AVERAGE ... I've been writing about the growing negative divergence between the transportation and industrial stocks which has gotten even worse. The Dow Transports fell -2.1% during the week and ended at the lowest level in seven months. It was just...
READ MORE
MEMBERS ONLY

SPY GRINDS HIGHER, QQQ LEADS, IWM LAGS, HEALTHCARE-FINANCE-TECH LEAD, CONSUMER DISCRETIONARY STALLS, INDUSTRIALS TAKE A HIT, XRT FAILS AT RESISTANCE
by John Murphy,
Chief Technical Analyst, StockCharts.com
S&P 500 CONTINUES TO GRIND HIGHER... Link for today's video. Price action has been rather boring in the major index ETFs since March, but there is a clear upward bias in price action and the trends remain up. Chart 1 shows the Equal-Weight S&P...
READ MORE
MEMBERS ONLY

TRANSPORTS STILL DIVERGE FROM INDUSTRIALS -- DJ COMPOSITE AVERAGE IS TESTING 200-DAY AVERAGE AND IS GOING TO NEED HELP FROM THE TRANSPORTS AND UTILITIES TO RESUME ITS UPTREND -- DOLLAR UPTURN INCREASES NEED TO HEDGE FOREIGN CURRENCY RISK
by John Murphy,
Chief Technical Analyst, StockCharts.com
INDUSTRIALS NEED SOME HELP FROM THE TRANSPORTS... I remain concerned about the negative divergence between the Dow Industrials (black bars) and the Dow Transports (red bars). The discrepancy between the two Dow Averages is the biggest in three years. That may not pull the Industrials lower, but it may prevent...
READ MORE
MEMBERS ONLY

Is It Too Late To Sell In May?
by Martin Pring,
President, Pring Research
* World Stock ETF falls to important support.
* Key bond confidence indicator at a key level.
* Dollar offering stronger signals that the correction is over.
Global Stocks
A couple of weeks ago I drew your attention to the $61 area on the MSCI World Stock ETF, the ACWI, as I felt...
READ MORE
MEMBERS ONLY

MEDIUM TERM TRENDS FOR SPY AND MDY, HEALTHCARE PROVIDERS REMAIN STRONG, WEAK YEN AND EURO PROPEL DOLLAR, OIL AND ENERGY GET HIT, GOLD TESTS WEDGE TREND LINE, VIDEO EXTRAS
by John Murphy,
Chief Technical Analyst, StockCharts.com
MAJOR INDEX ETFS PULLBACK WITHIN UPTRENDS... Link for today's video. Stocks came under selling pressure on Tuesday with small-caps, mid-caps and large-techs leading the way. At this point, today's decline is just a little noise within a bigger uptrend. The stock market has been working its...
READ MORE
MEMBERS ONLY

MID-CAP BREADTH LEADS, EQUAL-WEIGHT CONFIRMS CAP-WEIGHT, IWM SIGNAL FOLLOW UP, GE LEADS INDUSTRIALS, HEALTHCARE AND TECH LEAD SCTRS, FOUR TECH STOCKS WITH A 3-STEP SETUP
by John Murphy,
Chief Technical Analyst, StockCharts.com
INTERNAL STRENGTH CONFIRMS EXTERNAL STRENGTH... Link for today's video. The weight of the evidence is still bullish for stocks in general. As detailed below, several key index ETFs hit new highs and we are seeing leadership in three big sectors that account for almost half of the S&...
READ MORE