MEMBERS ONLY

Is it Time for the Dollar Bull Market to Resume?

by Martin Pring,
President, Pring Research
* Dollar Index ETF experiences a 38% Fibonacci correction and bounces.
* Key dollar relationships either at or just above major support.
* One way or another individual major currencies look vulnerable.
The Dollar Index ($USD) has been correcting for the last 9 weeks causing some observers to question the legitimacy of the...
READ MORE
MEMBERS ONLY

AIRLINES LEAD DOW TRANSPORTS TO SEVEN MONTH LOW -- SEVERAL AIRLINE STOCKS BREAK 200-DAY AVERAGES IN HEAVY TRADING -- RAILS AND TRUCKERS ARE ALSO IN DOWNTREND

by John Murphy,
Chief Technical Analyst, StockCharts.com
DOW TRANSPORTS FALL TO SEVEN-MONTH LOW... The chart picture for the Dow Tranports continues to weaken. Chart 1 shows the Dow Jones Transportation Average falling nearly 2% today and dropping to the lowest level since last October. It also fell further below its 200-day moving average. Although the rails and...
READ MORE
MEMBERS ONLY

WEBINAR, MDY AND SPY BREADTH, MARKETS ZIGZAG, OVERVIEW OF 9 SECTOR SPDRS, FIVE LEADING INDUSTRY GROUP ETFS, DOLLAR CORRELATION WITH COPPER-GOLD-OIL, BONDS HIT KEY LEVEL, SIX STOCK SETUPS
by John Murphy,
Chief Technical Analyst, StockCharts.com
AD LINES CONFIRM NEW HIGHS IN SPY AND MDY... When the major stock indices hit new highs, the first thing I do is check corresponding breadth indicators for confirmation. Breadth indicators tell us what is happening within the underlying indices. So far, the S&P 500 SPDR (SPY), the...
READ MORE
MEMBERS ONLY

EW S&P 500 STALLS NEAR HIGHS, SEMI SPDR BREAKS OUT, THREE SEMICONDUCTOR STOCK BREAKOUTS, AIRLINE INDEX CORRECTION, THREE AIRLINE STOCKS, THE REAL COMMODITY LEADERS
by John Murphy,
Chief Technical Analyst, StockCharts.com
EQUAL-WEIGHT S&P 500 CONSOLIDATES NEAR HIGHS... Link for today's video. The EW S&P 500 ETF (RSP) has yet to confirm the new high in the S&P 500 SPDR (SPY), but RSP is close to a new high and the current uptrend favors...
READ MORE
MEMBERS ONLY

DOW INDUSTRIALS HIT THREE-MONTH HIGH -- WEAKER TRANSPORTS AND UTILITIES SHOW SOME IMPROVEMENT -- BOND YIELDS TURN DOWN AS BOND PRICES BOUNCE OFF CHART SUPPORT -- THAT HELPS HOMEBUILDERS, REITS, AND TELECOM ETFS STAY ABOVE 200-DAY LINES
by John Murphy,
Chief Technical Analyst, StockCharts.com
TRANSPORTS AND UTILITIES ARE HOLDING MARKET BACK ... I've been writing about the continuing discrepancy between three Dow Averages. But things may be starting to improve. Chart 1 shows the Dow Industrials closing at a three-month high and just shy of its early March peak. [The S&P...
READ MORE
MEMBERS ONLY

OEX LEADS, IWM TRIGGERS BULLISH SIGNAL, INDUSTRIALS PERK UP, CONSUMER DISCRETIONARY LAGS, 5 BOLLINGER BAND BREAKOUTS, OIL WEAKENS DESPITE EURO STRENGTH, XLE WEAKENS BELOW KEY MOVING AVERAGE
by John Murphy,
Chief Technical Analyst, StockCharts.com
OEX LEADS WITH FIRST NEW HIGH... Link for today's video. The S&P 100 ($OEX) represents large-caps and this index is the first to hit a new high here in May. The S&P 500 reached a closing high on Thursday, but fell short of a...
READ MORE
MEMBERS ONLY

DOW INDUSTRIALS REACH THREE MONTH HIGH -- TWO OF ITS BIGGEST GAINERS ARE MICROSOFT AND VISA -- S&P 500 EXCEEDS LAST FRIDAY'S HIGH -- MIDCAPS EXCEED 50-DAY LINE -- SMALL CAPS MAY BE NEXT -- FACEBOOK AND ADOBE LEAD QQQ HIGHER
by John Murphy,
Chief Technical Analyst, StockCharts.com
DOW INDUSTRIALS NEAR 2015 HIGH ... Stocks are having a strong day. More importantly, several stock indexes are breaking through overhead resistance barriers, or are very close to doing so. Chart 1 shows the Dow Jones Industrial Average trading at the highest level in nearly three months. That puts it in...
READ MORE
MEMBERS ONLY

Why Is $61 Such An Important Number?
by Martin Pring,
President, Pring Research
* Key levels for the MSCI World Stock ETF.
* Asia Ex Japan and Japan ETF’s can support higher prices.
* Latin America and the Middle East look the most vulnerable.
Occasionally a specific price can show up as a pivotal number that provides a valuable clue as to the probable direction...
READ MORE
MEMBERS ONLY

10-YEAR BOND YIELD HOLDS ABOVE 200-DAY AVERAGE -- BANKS BENEFIT FROM HIGHER YIELDS -- BANK ETF HITS NEW SEVEN YEAR HIGH -- PERCENTAGE LEADERS ARE KEYCORP, COMERICA, AND FIFTH THIRD BANCORP -- FALLING DOLLAR IS BOOSTING PRECIOUS METALS
by John Murphy,
Chief Technical Analyst, StockCharts.com
10-YEAR TREASURY NOTE HOLDS FIRM ... The recent jump in bond yields has shown no sign of ending. The daily bars in Chart 1 show the 10-Year Treasury Note Yield trading back above its 200-day average (after dipping back below it last Friday). The TNX is also testing its March peak...
READ MORE
MEMBERS ONLY

RISING YIELDS, THE YIELD CURVE, BANKING STOCKS, KEY LEVELS FOR BREADTH, HOUSING-RETAIL-SEMI ETFS CORRECT, BIOTECH ETFS HOLD GAPS, OIL EXTENDS UPTREND, GOLD FLOUNDERS, AIRLINES CORRECT, STOCKS OF INTEREST
by John Murphy,
Chief Technical Analyst, StockCharts.com
THE KEY LINES IN THE SAND... There are certainly some concerns in the stock market right now, but I have yet to get a bearish signal to confirm these concerns. The bond market imploded over the last few weeks, long-term Treasury yields surged, small-caps have been lagging since early April...
READ MORE
MEMBERS ONLY

Will the Giant Trading Range for the Emerging Markets ETF be Resolved on the Upside or Downside?
by Martin Pring,
President, Pring Research
* China, Taiwan and South Korea digesting gains following upside breakouts.
* India, Russia, and Brazil face technical challenges.
* The counter-cyclical commodity rally may well be over.
Emerging Markets
The MSCI Emerging Markets ETF, the EEM, has been in a large trading range during the last few years, as you can see...
READ MORE
MEMBERS ONLY

LARGE AND GROWTH LEAD, DIA CHALLENGES HIGHS, IWM BOUNCES, SMALL-CAP BREADTH LAGS, TAIL VERSUS DOG, DEFENSE-AEROSPACE ETFS HIT SUPPORT, FOUR DEFENSE STOCKS
by John Murphy,
Chief Technical Analyst, StockCharts.com
LARGE-CAPS AND GROWTH SHOW RELATIVE STRENGTH... Link for today's video. Stocks surged on Friday, but small-caps and mid-caps lagged with smaller gains. In fact, looking at one-month performance for several major index ETFs, we can see that large-caps are leading and small-caps are lagging. Chart 1 shows a...
READ MORE
MEMBERS ONLY

LATE WEEK STOCK RALLY IS BASED ON MORE THAN A JOBS REPORT -- SPIKE IN BOND YIELDS PEAKED ON THURSDAY WHICH BOOSTED DIVIDEND ISHARES -- THE DJ COMPOSITE AVERAGE BOUNCES OFF 200-DAY AVERAGE -- BRITISH MARKETS BOUNCE ON ELECTION RESULTS
by John Murphy,
Chief Technical Analyst, StockCharts.com
10-YEAR TREASURY YIELD BACK BELOW 200-DAY AVERAGE... The report of 223,000 jobs created in April (and a drop in the unemployment rate to 5.4%) helped spark a strong stock rally on Friday. It's not that the report was so strong. In fact, it barely met expectations....
READ MORE
MEMBERS ONLY

SLOW AND STEADY IS STILL WINNING, SMALL-CAPS AND MID-CAPS ARE NOT BROKEN, XLY SURGES OFF SUPPORT, XLF RENEWS BREAKOUT, IAI CONSOLIDATES, CLOUD-INTERNET-SOFTWARE ETFS SPORT STRONG SCTRS, XLI BREAKS TRIANGLE
by John Murphy,
Chief Technical Analyst, StockCharts.com
SLOW AND STEADY IS STILL WINNING... Link for today's video. Stocks fell back from late April to early May and and this might have been enough to turn short-term bearish, but these declines did not affect the medium-term uptrends. In fact, the S&P 500 was never...
READ MORE
MEMBERS ONLY

SELLOFF IN ENERGY SHARES MAY SUGGEST OIL PEAK -- THAT'S HELPING AIRLINES AND TRANPORTS -- 10-YEAR BOND YIELD BACKS OFF FROM MARCH HIGH -- THAT'S HELPING RATE-SENSITIVE REITS
by John Murphy,
Chief Technical Analyst, StockCharts.com
ENERGY STOCKS BACK OFF FROM 200-DAY AVERAGE... While stocks in general are rebounding from yesterday's selloff, some interesting rotations are going on beneath the surface. One of the has to do with a pullback in energy shares and the price of crude. Energy stocks are the day'...
READ MORE
MEMBERS ONLY

STOCK MARKET CONTINUES TO RETREAT -- A LOT OF SHORT-TERM SUPPORTS ARE BEING BROKEN -- FALLING APPLE HURTS NASDAQ -- BOND ETFS FALL BELOW 200-DAY AVERAGES -- SO DO UTILITIES
by John Murphy,
Chief Technical Analyst, StockCharts.com
MAJOR STOCK AVERAGES BREAK 50-DAY LINES... Stock selling that started yesterday has spilled over to today as the market's short-term trend continues to weaken. Trading volume over the last week has also taken on a negative pattern, with heavier trading on down days and lighter volume on bounces....
READ MORE
MEMBERS ONLY

Will Last Month's NYSE Breakout Hold?
by Martin Pring,
President, Pring Research
* McClellan Summation gives a sell for the Wilshire 5000.
* Bond confidence ratios turn positive.
* Inflation ratios break to the upside. Trick or treat?
* Bonds complete a head and shoulders top.
US Equities
The NYSE Composite ($NYA) has been doing its best to break to the upside but continues to vacillate...
READ MORE
MEMBERS ONLY

STOCKS AND TREASURIES DIVERGE, KEY GROUPS AND BREADTH WEAKENING, FINANCE HOLDS STRONG, MATERIALS START TO LEAD, ENERGY ETFS EXTEND UPTRENDS, COPPER AND ALUMINUM LEAD BASE METALS, USING THE CHANDELIER EXIT
by John Murphy,
Chief Technical Analyst, StockCharts.com
WEBINAR ... Stocks came under selling pressure on Tuesday with techs and small-caps leading the way lower. The overall picture for stocks remains largely unchanged. The major index ETFs are in slow and steady uptrends this year, but we are seeing some weakness in a few key groups and some breadth...
READ MORE
MEMBERS ONLY

PUTTING THE BIOTECH DECLINE INTO PERSPECTIVE, GILEAD SURGES ON BIG VOLUME, MANAGING THE UPSWINGS IN OIL AND ENERGY, SEASONAL TENDENCIES FOR OIL, DOLLAR HITS SUPPORT ZONE
by John Murphy,
Chief Technical Analyst, StockCharts.com
PUTTING THE BIOTECH DECLINE INTO PERSPECTIVE... Link for today's video. It has been a rough ride for biotechs since mid March, but I am not ready to throw in the towel on the long-term uptrend. Chart 1 shows the Biotech iShares (IBB) with two sharp declines over the...
READ MORE
MEMBERS ONLY

THIS WEEK'S JUMP IN COPPER AND BOND YIELDS MAY BE LINKED -- SO IS THE BIG JUMP IN THE GERMAN 10-YEAR BUND YIELD -- TREASURY YIELD CURVE APPEARS TO BE BOTTOMING -- RISING BOND YIELDS HELP BANKS AND INSURERS WHICH GAINED ON THE WEEK
by John Murphy,
Chief Technical Analyst, StockCharts.com
COPPER AND YIELDS ARE WEEK'S BIGGEST GAINERS ... Two of the most significant events of the past week were the sharp rally in copper and Treasury bond yields. The two may be linked. Chart 1 shows the price of copper (red line) and the 10-Year Treasury Note Yield (green...
READ MORE
MEMBERS ONLY

SPY MAINTAINS UPTREND, BREADTH WANES, SMALL AND MID-CAP ETFS BREAK SUPPORT, QQQ IS STILL THE LEADER, A BIG WEEK FOR MATERIALS, TECH AND CONSUMER DISCRETIONARY HOLD STRONG, NOOSE TIGHTENS FOR FINANCE AND INDUSTRIALS
by John Murphy,
Chief Technical Analyst, StockCharts.com
SPY MAINTAINS UPTREND, BUT BREADTH WANES ... Link for today's video. There are clearly some signs of underlying weakness in the stock market and this could foreshadow a correction over the coming weeks. Today's market message will start with four major index ETFs. We will look at...
READ MORE
MEMBERS ONLY

BOND YIELDS CONTINUE TO RISE AS BOND PRICES FALL -- THAT'S HURTING BOND PROXIES LIKE REITS AND UTILITIES -- RISING RATES PUSH GOLD SHARPLY LOWER -- RISING OIL PRICES ARE HURTING TRANSPORTS -- SMALL STOCKS BREAK 50-DAY AVERAGE
by John Murphy,
Chief Technical Analyst, StockCharts.com
BOND YIELDS CONTINUE TO MOVE HIGHER... After jumping sharply yesterday, Treasury bond yields are climbing again today. [Yesterday's jump followed big gains in Eurozone bond yields]. Chart 1 shows the 10-Year Treasury Note yield trading at the highest level since mid-March. The jump in bond yields is obviously...
READ MORE
MEMBERS ONLY
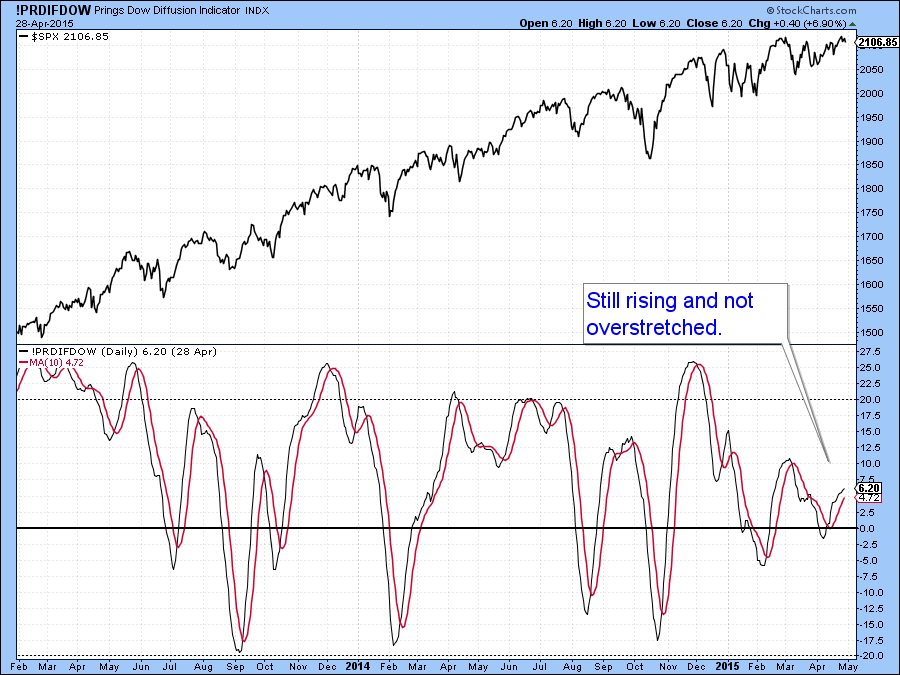
With Recent Breakouts Lacking Strong Conviction, "Sell in May?" Could Be A Legitimate Question
by Martin Pring,
President, Pring Research
* Global equities starting to get overbought.
* Dollar Index and related relationships break to new correction lows.
* Commodities tentatively break to the upside.
US Equities
From now until next Tuesday the market will be under the spell of the bullish end of the month seasonal. That condition, combined with the fact...
READ MORE
MEMBERS ONLY

JUMP IN GERMAN BUND YIELD HELPS BOOST TREASURY BOND YIELDS -- THAT'S GOOD FOR BANK AND INSURANCE STOCKS WHICH ARE TRADING HIGHER TODAY -- THE DOLLAR DROP IS PUSHING COMMODITY PRICES HIGHER
by John Murphy,
Chief Technical Analyst, StockCharts.com
GERMAN BUND YIELDS ARE RISING AS MANAGERS SELL... Something unusual is happening in Europe. For the first time in awhile, money managers are selling eurozone sovereign bonds which is pushing their yields higher. The best example is Germany. Chart 1 shows the 10-Year German Treasury yield jumping to 0.28%...
READ MORE
MEMBERS ONLY

SPY GETS NOISY, IWM ESTABLISHES SUPPORT, T-BONDS AND UTILITIES BRACE FOR BIG WEEK, CHEMICAL STOCKS LIFT MATERIALS SPDR, EW S&P 500 LAGS, SMALL-CAPS AND CONSUMER DISCRETIONARY START UNDERPERFORMING
by John Murphy,
Chief Technical Analyst, StockCharts.com
WEBINAR CHARTS... The charts below represent some of those featured in today's Webinar. The big trends are clearly up for the major index ETFs, but I am seeing some signs of weakness in a few key groups. It is not a major concern right now, however, it is...
READ MORE
MEMBERS ONLY

RCD CHALLENGES RESISTANCE, HEALTHCARE IS THE STRONGEST, MRK, GILD AND JNJ LAG, ABBV AND BMY LEAD, BASE METALS ETF CHALLENGES RESISTANCE, XME EXTENDS UPSWING, STEEL ETF BREAKS OUT, GOLD SURGES
by John Murphy,
Chief Technical Analyst, StockCharts.com
EQUAL-WEIGHT CONSUMER DISCRETIONARY CHALLENGES RESISTANCE... Link for today's video. A funny thing happened on the way to new highs last week. The S&P 500 recorded a new high last week, but only one sector SPDR recorded a new high and only one equal-weight sector ETF hit...
READ MORE
MEMBERS ONLY

RISING STOCK MARKET IS BAD FOR GOLD -- COPPER LOOKS LIKE A BETTER ALTERNATIVE -- GLOBAL X COPPER MINERS ETF HITS FIVE-MONTH HIGH -- FREEPORT MCMORAN FLATTENS OUT -- SOUTHERN COPPER BREAKS NECKLINE RESISTANCE -- HUDBAY MINERALS ALSO TURNS UP
by John Murphy,
Chief Technical Analyst, StockCharts.com
RISING STOCKS ARE BAD FOR GOLD... During last Saturday's webinar, one of the attendees asked what I thought of gold. I responded that I didn't like gold and haven't liked it for at least two years. The main reason for that view is the...
READ MORE
MEMBERS ONLY

AMAZON AND MICROSOFT POWER QQQ, BROAD INDICES-TECHS-ASIA DOMINATE NEW HIGHS, NEW HIGH-NEW LOW SCAN, RRG SHOWS BIFURCATION IN FINANCE, XLF AND RYF LAG, REGIONAL BANK AND BROKER ETFS CONSOLIDATE NEAR HIGHS, JAPANESE FINANCIALS MAKE A MOVE
by John Murphy,
Chief Technical Analyst, StockCharts.com
QQQ SURGES TO NEW HIGH... Link for today's video. Large-cap techs took charge on Friday and powered the Nasdaq 100 ETF (QQQ) to a new high. The underlying index, Nasdaq 100, is now around 6% from its all time high, which was recorded in March 2000. Chart 1...
READ MORE
MEMBERS ONLY

SOUTH KOREA RALLIES AS TAIWAN ETF EXPLODES TO RECORD HIGH -- EFA AND EEM HIT NEW RECOVERY HIGHS -- BOUNCING COMMODITIES AND A WEAKER DOLLAR ARE BOOSTING CANADA ISHARES -- NYSE INDEX HITS NEW RECORD -- NASDAQ TRADES ABOVE ITS MARCH 2000 CLOSING HIGH
by John Murphy,
Chief Technical Analyst, StockCharts.com
SOUTH KOREA RISES -- TAIWAN ETF HITS NEW HIGH... China and Japan aren't the only Asian countries that are hitting new highs. Two of today's strongest performers are South Korea and Taiwan. Chart 1 shows South Korea iShares (EWY) climbing nearly 2% to the highest level...
READ MORE
MEMBERS ONLY

CSX AND RAILS LEAD TRANSPORTS HIGHER -- DOW ENDS BACK OVER 50-DAY AVERAGE -- NASDAQ 100 NEARS TEST OF HIGH AND LEADS MARKET HIGHER -- BROADCOM LEADS TECHNOLOGY AND SEMICONDUCTOR ETFS HIGHER -- S&P 500 IS AGAIN TESTING TOP OF SYMMETRICAL TRIANGLE
by John Murphy,
Chief Technical Analyst, StockCharts.com
DOW TRANSPORTS HIT NEW MONTHLY HIGH... The chart picture for the Dow Transports continues to improve. I recently showed the transports finding support at their 200-day moving average and chart support along first quarter lows. Chart 1 shows the TRAN rising today to the highest level in a month. It&...
READ MORE
MEMBERS ONLY

HIGH-LOW PERCENT SIGNALS, AD LINE CONFIRMATION, TREND MOVEMENTS, FINANCE SECTOR WEAKENS, MATERIALS SECTOR WOBBLES, TWO LEADING HEALTHCARE GROUPS, WATCH SWINGS IN OIL AND XLE, 10-YR YIELD LACKS CATALYST, UTILITIES WEAKEN
by John Murphy,
Chief Technical Analyst, StockCharts.com
WEBINAR CHARTS... Below are some of the charts highlighted in today's Webinar. There was also a tutorial on Bollinger Bands using Apple as the example. Lots of stocks and ETFs show narrowing ranges and this is a great time to brush up on a classic indicator. I also...
READ MORE
MEMBERS ONLY

Does Friday's Sell-off Negate the NYSE Upside Breakout?
by Martin Pring,
President, Pring Research
* -Some short-term momentum indicators weaken but are not yet bearish.
* -Dollar related relationships close to an upside breakout
* -Gold and silver under pressure
US Equities
They say that the most critical points of a flight are takeoff and landing. The same is true in technical analysis where the most critical...
READ MORE
MEMBERS ONLY

SPY FILLS THE GAP, TECHS AND UTILITIES LEAD, AIRLINES AND TRUCKERS LOOK BETTER THAN RAILS AND DELIVERY, AIRLINE SCTRS ARE STRONG, AMERICAN TESTS SUPPORT, DELTA AND UNITED CORRECT, ALASKA AND SOUTHWEST CONSOLIDATE
by John Murphy,
Chief Technical Analyst, StockCharts.com
SPY FILLS THE GAP AND CHALLENGES RESISTANCE ... Link for today's video. Stocks got a big bounce on Monday morning as the major index ETFs erased most of the losses from Friday. Chart 1 shows the S&P 500 SPDR (SPY) moving back above 209 in early trading...
READ MORE
MEMBERS ONLY

CHINA AND GREECE LEAD FRIDAY SELLOFF -- FOREIGN UPTRENDS, HOWEVER, REMAIN INTACT -- THAT KEPT U.S. STOCK INDEXES IN TRADING RANGE AND NEGATED UPSIDE BREAKOUT IN NYSE INDEX -- FALLING GERMAN YIELDS (AND RISING PRICES) MAKE TREASURIES A RELATIVE BARGAIN
by John Murphy,
Chief Technical Analyst, StockCharts.com
CHINESE ETFS DROP 5% ON FRIDAY... Chinese stocks have been on a tear over the last year. Mainland stocks are up 25% just this year. They were probably due for a pullback and they got one on Friday. Chinese authorities tightened rules on margin buying (and made it easier to...
READ MORE
MEMBERS ONLY

SMALL AND MID-CAP ETFS FALL BACK WITHIN CHANNELS, SECTOR LEADERS AND LAGGARDS, EW FINANCE BREAKS, EW CONSUMER DISCRETIONARY TESTS SUPPORT, EW TECH ETF CORRECTS, EW ENERGY ETF NEARS RESISTANCE -- HOUSING AND RETAIL LAG IN APRIL
by John Murphy,
Chief Technical Analyst, StockCharts.com
SPY EXTENDS CONSOLIDATION ... Link for today's video. Stocks were down sharply in early trading on Friday. I think it is because there were more sellers than buyers, but media outlets seem to be blaming Europe and China. The Eurotop 100 ($EUR) fell 1.54% on Friday, but is...
READ MORE
MEMBERS ONLY

CRB INDEX IS FINDING SUPPORT ALONG ITS 2009 LOW AS DOLLAR INDEX BACKS OFF FROM RESISTANCE -- ENERGY SPDR AND CRUDE OIL ACHIEVE UPSIDE BREAKOUTS -- ENERGY STRENGTH IS HELPING THE STOCK MARKET
by John Murphy,
Chief Technical Analyst, StockCharts.com
DOLLAR INDEX IS WEAKENING... For the first time in nearly a year, the U.S. Dollar is showing signs of weakness. The daily bars in Chart 1 show the PowerShares US Dollar Index Bullish Fund (UUP) trading lower after forming two declining peaks since mid-March. It's now headed...
READ MORE
MEMBERS ONLY

NYSE COMPOSITE INDEX HITS RECORD HIGH -- IT'S THE FIRST U.S. INDEX TO REACH A NEW RECORD -- THE OTHERS AREN'T FAR BEHIND -- THE NYSE BULLISH PERCENT INDEX IS ALSO IN UPTREND -- SO IS THE % OF NYSE STOCKS OVER 200-DAY MOVING AVERAGES
by John Murphy,
Chief Technical Analyst, StockCharts.com
NYSE INDEX TRADES AT NEW RECORD... Last Saturday's message showed the NYSE Composite Index ($NYA) testing its all-time highs formed over the last year. Chart 1 shows the NYA trading above those highs in record territory in morning trading. I take that as a positive sign for the...
READ MORE
MEMBERS ONLY

WEBINAR CHARTS, 3 LEADING SECTORS, COPPER TURNS BACK, BASE METALS WEIGH ON XME, GOLD BACKS OFF RETRACEMENT, GOLD MINER AD LINE WARNS, OIL EXTENDS TO RANGE RESISTANCE, UTILITIES AND BONDS BOUNCE, STOCKS OF INTEREST
by John Murphy,
Chief Technical Analyst, StockCharts.com
WEBINAR CHARTS AND NOTES... The following charts come from the Webinar on Tuesday, April 14th, featuring myself and Julius de Kempenaer of Relative Rotation Graphs (RRGs). Julius used a top-down analytical approach by starting with the big sectors, drilling down into the industry groups and then highlighting interesting stocks in...
READ MORE
MEMBERS ONLY
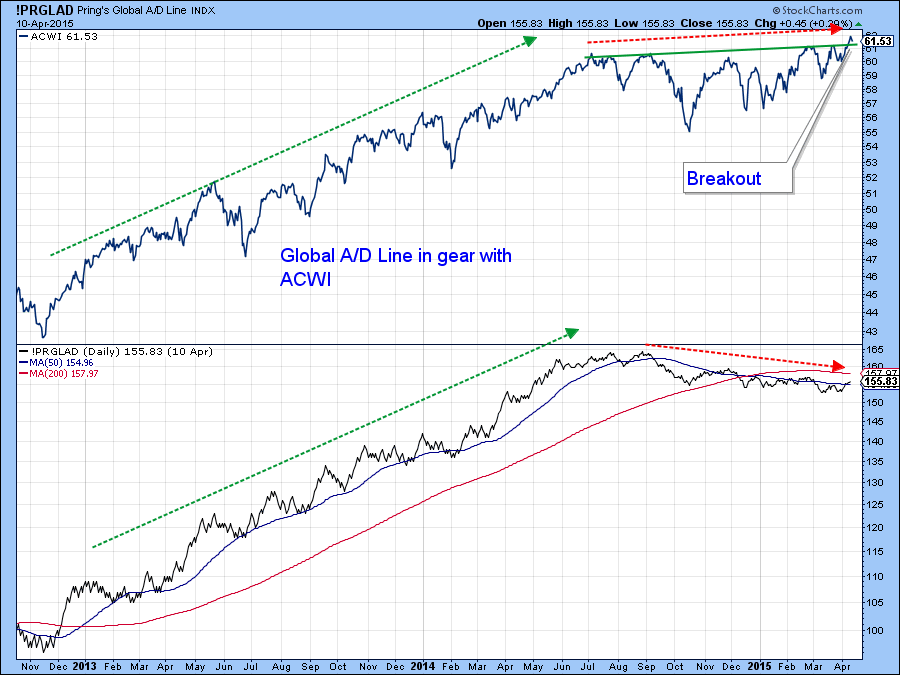
Global A/D Line Breaks above Key Resistance
by Martin Pring,
President, Pring Research
* - Confidence trying to improve in the bond market so that it can support higher equities.
* - Oil trying to form a base.
* - Declining peaks and troughs still in force for the Bloomberg Commodity ETN.
Global Equities
Throughout most of the bull market my Global A/D Line, comprising...
READ MORE
MEMBERS ONLY

A THROWBACK FOR THE MATERIALS ETF, XLI BREAKS OUT AS RGI CONSOLIDATES, XLF GETS A LITTLE BREAKOUT, REGIONAL BANK AND BROKER-DEALER ETFS GET BREAKOUTS, INSURANCE AND MORTGAGE REIT ETFS NEAR HIGHS
by John Murphy,
Chief Technical Analyst, StockCharts.com
MATERIALS ETF FIRMS IN RETRACEMENT ZONE... Link for today's video. The materials sector is at an interesting juncture because the long-term trend is up and it is trading near broken resistance after a throwback. Chart 1 shows the Equal-weight Materials ETF (RTM) within a long-term uptrend over the...
READ MORE