MEMBERS ONLY

STOXX EUROPE 600 INDEX HITS RECORD HIGH -- SO DOES THE FTSE ALL WORLD INDEX -- THAT BODES WELL FOR GLOBAL STOCKS, INCLUDING THE U.S. -- SMALL CAP LEADERSHIP IS POSITIVE -- SO IS THE OEX BOUNCE OFF SUPPORT -- TRANSPORTS REGAIN 200-DAY AVERAGE

by John Murphy,
Chief Technical Analyst, StockCharts.com
DJ STOXX EUROPE 600 AND FTSE ALL WORLD INDEX HIT RECORD HIGHS ... The major uptrend in foreign stocks took another big step to the upside this week. That was especially true in Europe and Asia. The monthly bars in Chart 1 show the Dow Jones STOXX Europe 600 Index ending...
READ MORE
MEMBERS ONLY

QQQ SURGES, MDY AND IJR CONTINUE TO LEAD, FOUR TECH ETFS WITH BULLISH SETUPS AND MACDS, XLU STALLS AT 200-DAY, TLT TESTS KEY SUPPORT, 10-YR YIELD HITS KEY RETRACEMENT, WHY USE RETRACEMENT ZONES?
by John Murphy,
Chief Technical Analyst, StockCharts.com
QQQ SURGES OFF SUPPORT ZONE... Link for today's video. Chart 1 shows the Nasdaq 100 ETF (QQQ) getting another bounce off support this week and leading the major index ETFs over the last five days. Note that QQQ is up over 2% this week, which is more than...
READ MORE
MEMBERS ONLY

HONG KONG STOCKS SURGE TO SEVEN-YEAR HIGHS AND LOOK UNDERVALUED VERSUS SHANGHAI -- CHINA ISHARES BUILD ON LAST WEEK'S BULLISH BREAKOUT -- FOREIGN STOCKS CONTINUE TO ADVANCE WHILE THE U.S. IS STALLED
by John Murphy,
Chief Technical Analyst, StockCharts.com
HONG KONG MARKET HITS SEVEN-YEAR HIGH... China has been the strongest stock market in the world over the last year. The launch of the Shanghai-Hong Kong Stock Connect last November allowed Chinese investors to buy Chinese stocks traded on both exchanges. It also opened up Chinese shares to foreign investors....
READ MORE
MEMBERS ONLY

US Equities are Very Close to an Upside Breakout. Can they do It?

by Martin Pring,
President, Pring Research
* World Stock ETF looks set for an upside breakout if it can get a small push in that direction
* Treasury yield curve begins to steepen
* Gold shares and silver caught in an important trading range.
Equities
Last week’s headline addressed the question of whether Chinese equities would drag US...
READ MORE
MEMBERS ONLY

LONG-TERM TIMING, SMALL-CAP BREADTH, SECTOR AD LINES, FINANCE ETFS BATTLE SUPPORT, XLI AND XLK WORK HIGHER, GOLD, OIL, DOLLAR, STOCK SETUPS, Q&A CHARTS
by John Murphy,
Chief Technical Analyst, StockCharts.com
S&P 500 SPDR BOUNCES OFF SUPPORT ZONE... The following charts and commentary come from the webinar on Tuesday, April 7th. I am leading off with a long-term monthly chart to emphasize two things: markets trend and long-term timing is possible. While past signals are not guaranteed to work...
READ MORE
MEMBERS ONLY

S&P 500 SPDR BOUNCES, SMALL AND MID-CAPS HOLD STRONG, CONSUMER STAPLES AND UTILITIES LEAD, TREASURY YIELDS SHOW RISK AVERSION, TLT HITS KEY RETRACEMENT
by John Murphy,
Chief Technical Analyst, StockCharts.com
S&P 500 SPDR BOUNCES OFF SUPPORT ZONE... Link for today's video. Chart 1 shows the S&P 500 SPDR (SPY) falling to the top of its support zone last week and surging on Monday. This surge is most interesting because stock futures were down Friday...
READ MORE
MEMBERS ONLY

NOTES FROM THE MTA SYMPOSIUM, TREND FACTOR APPROACH, POSITION SIZING MATTERS, TREND FOLLOWING IS TOUGH, PAPER BEATS ROCK, MIND THE CENTRAL BANKS, RIDE THE TREND TO THE END, FOCUS ON WHAT IS
by John Murphy,
Chief Technical Analyst, StockCharts.com
NOTES FROM THE MTA SYMPOSIUM... As John Murphy pointed out on Friday, Stock futures were down sharply after weaker-than-expected non-farm payrolls. The S&P 500 and Nasdaq were down around 1%. Treasury bonds moved sharply higher as the 10-YR Treasury Yield ($TNX) fell below 1.85%, and to its...
READ MORE
MEMBERS ONLY

WEAK JOBS REPORT SENDS STOCK FUTURES AND BOND YIELDS LOWER -- DOLLAR WEAKENS AGAINST THE EURO -- DOW INDUSTRIALS MAY CHALLENGE MARCH LOW AS DOW TRANSPORTS SLIP BENEATH 200-DAY LINE -- HOMEBUILDER ETF HITS EIGHT-YEAR HIGH
by John Murphy,
Chief Technical Analyst, StockCharts.com
MARCH JOBS REPORT IS THE WEAKEST SINCE DECEMBER 2013... The March jobs report released this morning showed only 126,000 new jobs created, which was nearly half what most economists were expecting (245,000). In addition, jobs created for January and February were revised downward. The unemployment rate remained unchanged...
READ MORE
MEMBERS ONLY
Will Chinese Equities Drag up their US Counterparts?
by Martin Pring,
President, Pring Research
* Dow Jones Transports flirting with key support.
* Chinese ETF (FXI) experiences a long and short-term breakout.
* Emerging markets on the edge of a breakout.
US Equities
Since the middle of last year we have seen two different market characteristics develop. The first, as epitomized by the S&P 500...
READ MORE
MEMBERS ONLY

WEBINAR CHARTS, SPY MAINTAINS CHANNEL, UTILITIES AND THE 10-YR YIELD, NON-CONFIRMATIONS IN AD LINES, HIGH-LOW INDICATORS SOFTEN, RANKING THE SECTORS
by John Murphy,
Chief Technical Analyst, StockCharts.com
QQQ AFFIRMS SUPPORT... The charts today come from today's webinar. Not all charts, however, are featured here. See the last section of this Market Message for the symbosl and contecnt found exclusively in the webinar recording. Chart 1 shows the Nasdaq 100 ETF (QQQ) hitting support after a...
READ MORE
MEMBERS ONLY

FINANCE SECTOR LEADS MARKET, BIG WEEK FOR BONDS, DOLLAR BOUNCES OFF KEY RETRACEMENT, GOLD FAILS AT BROKEN SUPPORT, OIL STALLS WITHIN DOWNTREND
by John Murphy,
Chief Technical Analyst, StockCharts.com
FINANCE SECTOR LEADS MARKET HIGHER... Link for today's video. Stocks moved higher in early trading on Monday with the finance sector showing some leadership. Despite today's gains, it has been a rough year for this sector because the Finance SPDR (XLF) is down year-to-date, the Equal-weight...
READ MORE
MEMBERS ONLY

ALTERA AND INTEL LEAD CHIP BOUNCE ON FRIDAY -- BIOTECH ETF FINDS SUPPORT AT 50-DAY LINE -- TRANSPORTS HOLD 200-DAY LINE -- RAILS AND DELIVERY SERVICES ARE ALREADY IN DOWNTRENDS -- PULLBACK IN OIL BOOSTS AIRLINES ON FRIDAY
by John Murphy,
Chief Technical Analyst, StockCharts.com
ALTERA AND INTEL LEAD CHIP BOUNCE... Semiconductors fell sharply on Wednesday and Thursday, and weighed heavily on the technology sector. Chart 1 shows the PHLX Semiconductor iShares (SOXX) falling all the way back to its 200-day moving average by Thursday. A big jump on Friday, however, pushed the SOXX up...
READ MORE
MEMBERS ONLY

QQQ AND SPY TEST SUPPORT, MID-CAPS AND SMALL-CAPS HOLD UP BETTER, CONCERNS WITH XLF, XLI AND XLK, HOUSING AND RETAIL REMAIN STRONG
by John Murphy,
Chief Technical Analyst, StockCharts.com
QQQ AND SPY TEST SUPPORT... Programming note: Today's report will be brief, and there is no video, because I am on the road at the MTA symposium in NYC. Stocks were hit with selling pressure this week, but this was not enough to dislodge the bigger uptrends. Small-caps...
READ MORE
MEMBERS ONLY

Global Stocks And The NYSE Composite Are In Focus At The Top Of A Major Trading Range
by Martin Pring,
President, Pring Research
* The NYSE Composite breaks out against the S&P 500.
* The SPY/EFA (US against the world) ratio completes a top.
* The S&P Europe 350 (IEV) breaks out against the S&P 500.
* The DB Commodity ETF is close to an important down trend line violation....
READ MORE
MEMBERS ONLY

FOUR RISK RATIOS FOR STOCKS, MAJOR INDEX ETF OVERVIEW, MATERIALS ETF HITS SUPPORT, ITB HOLDS FLAG BREAK, BOND BREAKOUTS AND RATE SENSITIVE ETFS, STOCKS TO WATCH, LIVE DEMO
by John Murphy,
Chief Technical Analyst, StockCharts.com
FOUR RISK RATIOS FOR THE STOCK MARKET... The following charts are from today's Webinar (click here). Chartists can enhance their broad stock market analysis by adding indicators that measure risk appetite. Today I am going to show four stock-specific ratios that will give us an idea of the...
READ MORE
MEMBERS ONLY

-- STEADY UPTREND FOR LARGE-CAPS, NEW UPTREND FOR SMALL-CAPS, XLE FIRMS, MEDIA ETF BREAKS OUT, CLOUD COMPUTING ETF LEADS, FDN BREAKS OUT, SOCL PERKS UP, REGIONAL BANK ETF HOLDS UP, SOLAR ETF BREAKS FREE, PLUS REM, IYZ AND PSCF --
by John Murphy,
Chief Technical Analyst, StockCharts.com
A MOST STEADY UPTREND FOR LARGE-CAPS... Link for today's video. There is definitely a lot of noise out there on a daily basis, but the uptrends in the S&P 500 SPDR (SPY) and Nasdaq 100 ETF (QQQ) are remarkably steady on the weekly charts. Chart 1...
READ MORE
MEMBERS ONLY

FED MESSAGE HAS BULLISH EFFECT ON BONDS AND GLOBAL STOCKS -- FALLING TREASURY YIELD PULLS DOLLAR LOWER AND COMMODITIES HIGHER -- UTILITIES, REITS, AND HOMEBUILDERS HAVE A STRONG WEEK -- MID AND SMALL CAP STOCKS HIT RECORD HIGHS -- S&P 500 MAY BE NEXT
by John Murphy,
Chief Technical Analyst, StockCharts.com
FED EFFECT CONTINUES ON FRIDAY... After a brief pause on Thursday, global markets resumed the bullish tone that started after the Fed's dovish statement on Wednesday. With the Fed scaling back on its plans to hike short-term rates later this year, markets acted accordingly. Treasury yields plunged to...
READ MORE
MEMBERS ONLY

Beneficiaries Of A Rising US Dollar Are Beginning To Look Tired
by Martin Pring,
President, Pring Research
* The RS between US equities and the rest of the world could be about to break against the US.
* The GLD breaks above its intermediate down trendline.
* Silver experiences a false move to the downside, thereby leaving it free to move higher.
The Dollar and Related Markets. Has the US...
READ MORE
MEMBERS ONLY

SMALLCAP SECTOR PERFORMANCE SHARPCHART, ENERGY-MATERIALS HIT NEW RELATIVE LOWS, INDUSTRIALS-TECH SHOW CHART STRENGTH, LEADERS IN CONSUMER DISCRETIONARY, DRI AND FRGI POP, NEW HIGH PARADE --
by John Murphy,
Chief Technical Analyst, StockCharts.com
HEALTHCARE AND CONSUMER DISCRETIONARY LEAD SMALL-CAPS ... Link for today's video. Small-caps led the market higher this week as the Russell 2000 and S&P Small-Cap 600 hit new highs. As with the S&P 500, the S&P Small-Cap 600 can be divided into nine...
READ MORE
MEMBERS ONLY

FED DROPS PATIENT STANCE, BUT LOWERS GUIDANCE FOR FUTURE RATE HIKES -- STOCKS SURGE AS YIELDS TUMBLE -- RATE SENSITIVE STOCKS LIKE UTILITIES JUMP WITH BONDS, BUT BANKS LAG -- WEAKER DOLLAR BOOSTS COMMODITIES
by John Murphy,
Chief Technical Analyst, StockCharts.com
FED TAKES MORE DOVISH TONE... Today's Fed statement dropped its "patient" stance, but lowered guidance for any future rate hikes. Ms. Yellen emphasized that while the Fed was dropping the word "patient", it wouldn't be "impatient" to raise rates. A...
READ MORE
MEMBERS ONLY

-- CHANNEL DEFINES SPY TREND, ITB, XHB AND FLAGS, REGIONAL BANK ETF, BIG TREND FOR TREASURIES, TLT HITS INFLECTION POINT, XLU FIRMS AT FIB LEVEL, CURRENCY ADJUSTMENTS FOR ETFS --
by John Murphy,
Chief Technical Analyst, StockCharts.com
CHANNELS RULE FOR SPY, MDY AND IJR... Upside momentum has slowed since the October-November surge, but the major index ETFs remain in clear uptrends defined by rising channels over the last few months. Chart 1 shows the S&P 500 SPDR (SPY) with a surge from mid October to...
READ MORE
MEMBERS ONLY

-- MIND THE GAP AND THE RELATIVE PERFORMANCE, TRANSPORTS BOUNCE AT FIB RETRACEMENT, TRUCKING AND AIRLINES LEAD, 3 TRUCKING LEADERS, 2 AIRLINE LEADERS, 3 LEGACY AIRLINE STOCKS --
by John Murphy,
Chief Technical Analyst, StockCharts.com
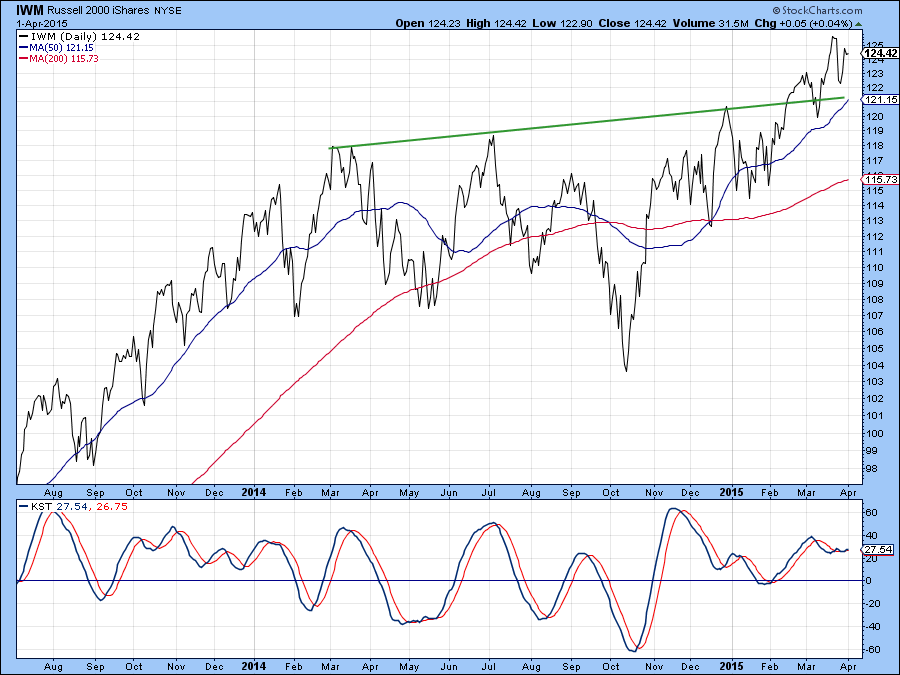
MIND THE SMALL CAP GAP AND RELATIVE PERFORMANCE... Link for today's video. The Russell 2000 iShares (IWM) and the S&P SmallCap iShares (IJR) both gapped up last week and these gaps are holding. Moreover, small-caps have been showing relative strength since mid October and their respective...
READ MORE
MEMBERS ONLY

-- LONG-TERM UPTREND AND SHORT-TERM DOWNTREND, FINANCE AD LINE, XLF BEAR TRAP, OIL BREAK DOWN, XLE NEAR NEW LOW, CORRELATIONS TO THE DOLLAR (OIL, STOCKS, BONDS, GOLD), KEY NEW HIGHS AND LOWS --
by John Murphy,
Chief Technical Analyst, StockCharts.com
LONG-TERM UPTREND AND SHORT-TERM DOWNTREND... Link for today's video. Stocks did the old pop and drop on Thursday and Friday. With Thursday's gain dissipating, this means the short-term trend is still down and stocks remain in corrective mode. Financials and healthcare showed some strength this week,...
READ MORE
MEMBERS ONLY

SMALL CAPS LEAD LARGE CAPS HIGHER -- FINANCIALS HAVE A STRONG DAY -- BANK AND BROKER ETFS NEAR UPSIDE BREAKOUTS -- PNC FINANCIAL HITS ALL-TIME HIGH -- WELLS FARGO MAY BE NEXT -- CHARLES SCHWAB NEARS UPSIDE BREAKOUT
by John Murphy,
Chief Technical Analyst, StockCharts.com
SMALL CAPS LEAD U.S. RALLY ... Yesterday's message suggested that small caps do better than large caps in a strong dollar environment. That may explain why small caps are trying hard to pull the U.S. stock market out of its recent pullback. Chart 1 shows the S&...
READ MORE
MEMBERS ONLY

DOLLAR INDEX REACHES 12-YEAR HIGH AS EURO TUMBLES -- USD BREAKS 30-YEAR RESISTANCE LINE -- WIDENING SPREAD BETWEEN 10-YEAR TREASURY AND GERMAN YIELD IS SUPPORTING DOLLAR RALLY -- FOREIGN CURRENCIES ARE ALL FALLING
by John Murphy,
Chief Technical Analyst, StockCharts.com
DOLLAR INDEX REACHES 12-YEAR HIGH AS EURO PLUNGES... A lot of attention is being focused on the continuing surge in the U.S. Dollar, and the plunge in the Euro. The monthly bars in Chart 1 show the U.S. Dollar Index (green bars) rising to the highest level since...
READ MORE
MEMBERS ONLY
Stock Markets around the World Continue to Look Vulnerable
by Martin Pring,
President, Pring Research
* World stock ETF may have experienced a false upside breakout.
* Bonds likely to out-perform stocks in the immediate future.
* Emerging markets ETF right at critical support.
Global Equities
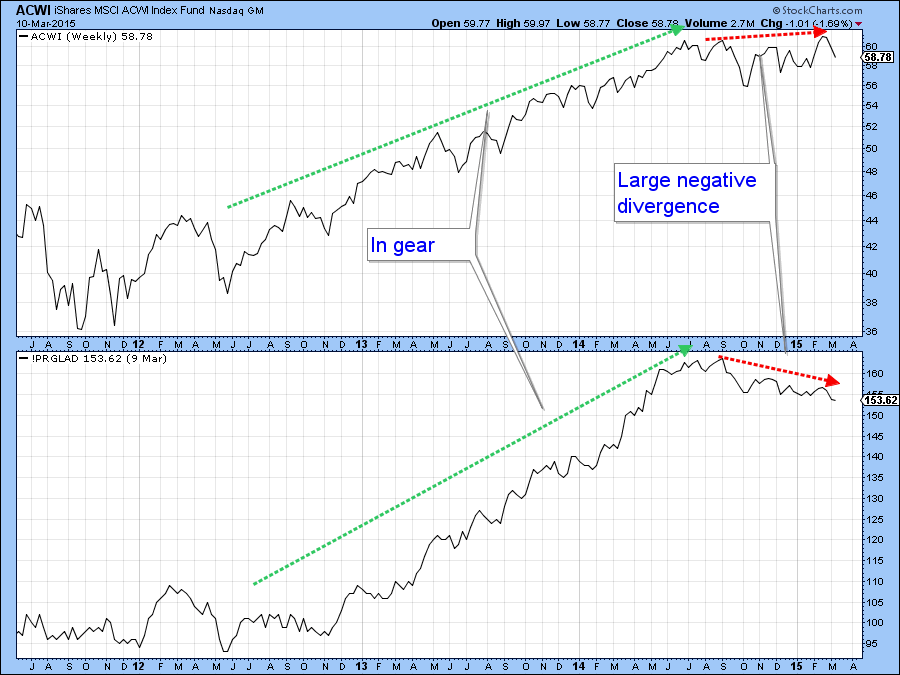
Global equities are starting to look sick. Chart 1, for instance shows that the MSCI World Stock ETF, the ACWI, has recently...
READ MORE
MEMBERS ONLY

-- WEBINAR WITH JDK OF RRG, S&P 500 EXTENDS DECLINE, IMPORTANCE OF FINANCE SECTOR, BREAKDOWN IN XLF, TARGET FOR XLY, TWO STRONG GROUPS AND FOUR STOCKS --
by John Murphy,
Chief Technical Analyst, StockCharts.com
WEBINAR WITH RRG ... Today's Webinar features a top-down approach to selecting stocks using Relative Rotation Graphs (RRGs) and some classic chart analysis. Julius de Kempenaer, developer of RRG, kicks off the webinar by analyzing relative performance for the sector SPDRs, the industry groups in the consumer discretionary sector...
READ MORE
MEMBERS ONLY

-- MARKETCARPET TIPS AND TRICKS, 3 LEADING SECTORS, LEADING STOCKS IN LEADING SECTORS, ONE SEMICONDUCTOR ETF LAGS THE OTHER, INTEL MAKES A BREAK, TSM WEIGHS --
by John Murphy,
Chief Technical Analyst, StockCharts.com
DRILLING DOWN INTO THE MARKETCARPET... Link for today's video. After hitting new highs in February, stocks weakened in March with selling pressure over the past week. The long-term trend for the S&P 500 remains up, but some sort of correction or pullback may be underway. Corrections...
READ MORE
MEMBERS ONLY

STRONG JOBS REPORT PUSHES INTEREST RATES SHARPLY HIGHER AND TREASURY BONDS LOWER -- HIGHER RATES BOOST BANKS AND BROKERS -- BUT HURT UTILITIES AND GOLD -- S&P 500 ENDS DAY LOWER...
by John Murphy,
Chief Technical Analyst, StockCharts.com
SOUND FAMILIAR? ... The above headline is actually taken from my February 7 Market Message which was written the day after that Friday's strong jobs report. Yesterday's surprisingly strong jobs report, and market reactions, were almost exactly the same as they were a month ago. It just...
READ MORE
MEMBERS ONLY

-- A WEAK MARCH FOR STOCKS, XLF STALLS, REGIONAL BANK SPDR CHALLENGES RESISTANCE, THREE REGIONAL BANKS, 10-YR YIELD BREAKS OUT, TLT BREAKS DOWN, ECONOMIC INDICATOR TABLE --
by John Murphy,
Chief Technical Analyst, StockCharts.com
STOCKS WEAKEN, BUT BIGGER UPTRENDS REMAIN... Link for today's video. Stocks weakened over the last few days, but this weakness does not affect the bigger uptrend. First, note that the S&P 500, S&P MidCap 400, S&P Small-Cap 600 and Nasdaq 100 all...
READ MORE
MEMBERS ONLY

Can the Stock Market Hold its Breakout?
by Martin Pring,
President, Pring Research
* NYSE Composite and MSCI World Stock ETF could be in the process of cancelling their recent breakouts.
* Stock/bond ratio at a critical juncture.
* Junk bonds violate up trend line.
* Dollar Index breaks to the upside.
* Gold and gold shares face important technical test.
Equities
Chart 1 suggests that the...
READ MORE
MEMBERS ONLY

STOCK INDEXES ENCOUNTER SELLING -- DOW TRANSPORTS HAVEN'T CONFIRMED INDUSTRIAL HIGH -- FALLING BONDS HAVE HURT UTILITIES -- STOCK/BOND RATIO, HOWEVER, LOOKS OVERBOUGHT -- FTSE WORLD INDEX BACKS OFF FROM RESISTANCE
by John Murphy,
Chief Technical Analyst, StockCharts.com
TRANSPORTS HAVEN'T CONFIRMED DOW HIGH ... U.S. stocks are experiencing some selling today. A pullback from recent highs isn't too surprising considering the fact that some short-term negative divergences have surfaced. First with short-term momentum indicators. Chart 1 shows the Dow Industrials in the red today....
READ MORE
MEMBERS ONLY

-- FIRST SUPPORT FOR QQQ, MICROSOFT HITS RESISTANCE, BANDS CONTRACT FOR ORACLE, GOOGLE LEADS, SMALL-CAP BREADTH LAGS, UTILITIES BREADTH TURNS BEARISH, SECTOR SCTR RANKINGS AND CORRELATIONS --
by John Murphy,
Chief Technical Analyst, StockCharts.com
WEBINAR CHARTS AND LINKS... Today's Webinar will start with a live demo showing how to find signals on PerfCharts. I will start with the major stock indices, drill down into the sectors and then look at twenty industry group ETFs in two separate PerfCharts. Even though there are...
READ MORE
MEMBERS ONLY

-- SEMIS POWER TECH SECTOR, THREE SEMI STOCKS WITH FRESH BREAKOUTS, THROWBACK ZONE FOR QQQ, SMALL-CAPS STRUGGLE, XLU BREAKS DOWN AS YIELDS RISE, TLT GETS COLD FEET --
by John Murphy,
Chief Technical Analyst, StockCharts.com
SEMICONDUCTOR ETF LEADS WITH NEW HIGH ... Link for today's video. Chart 1 shows the Semiconductor SPDR (XSD) surging over 1.5% and hitting yet another new high. The ETF surged in the second half of October and then embarked on a steady advance defined by the Raff Regression...
READ MORE
MEMBERS ONLY

-- SMALL-CAPS LEAD, NEW HIGH PARADE, FINANCE LAGS, BAC AND MS, XLE HITS RESISTANCE, XOM, CVX AND SLB, PALLADIUM PERKS UP, GOLD HITS FIB LEVEL, GDX HOLDS BREAK --
by John Murphy,
Chief Technical Analyst, StockCharts.com
LARGE-CAPS AND SMALL-CAPS LEAD FEBRUARY CHARGE... Link for today's video. Even though the stock market is not firing on all cylinders, the majority of cylinders are firing bullish and this is enough to support an uptrend in the broad indices. February may be a short month, but it...
READ MORE
MEMBERS ONLY

FALLING CONSUMER PRICES MAKE FED'S JOB MORE DIFFICULT -- SO DO FALLING COMMODITY PRICES -- A RISING DOLLAR IS PUSHING COMMODITY PRICES LOWER -- WEAK GERMAN YIELD WEIGHS ON TREASURY YIELD -- DOLLAR INDEX IS ON VERGE OF RESUMING ITS UPTREND
by John Murphy,
Chief Technical Analyst, StockCharts.com
FED NOW FOCUSED ON LOW INFLATION ... Today's announcement that consumer prices in the U.S. fell -0.7 in January, the biggest drop since late 2008 (and the first annual decline since 2009), is going to make the Fed's job harder. [The core CPI, excluding food...
READ MORE
MEMBERS ONLY
Equity Market Breakout is Broadly Based but Short-term Indicators are Becoming Overstretched
by Martin Pring,
President, Pring Research
* Emerging markets about to experience an important breakout.
* Yield curve continues to flatten.
* Confidence in the bond market faces an important technical test.
US Equities
We have seen some nice breakouts in the last few trading sessions, which have been pretty broadly based as you can see from Chart 1,...
READ MORE
MEMBERS ONLY

-- QQQ BREAKOUT, SPY TARGETS, BREADTH LINES CONFIRM, SECTOR AD LINES, T-YIELDS HIT INFLECTION, TLT SURGES OFF FIB ZONE, YIELD CURVE, UTILITIES FIRM AND REITS BREAK --
by John Murphy,
Chief Technical Analyst, StockCharts.com
WEBINAR CHARTS... Welcome to the Fed edition of the Market Message. No, I am not going to dissect Fed speak and analyze every word from the testimony of Fed Chair Janet Yellen. Instead, I am going to analyze the charts, which contain all available information. Before hitting Treasuries, I will...
READ MORE
MEMBERS ONLY

-- A BREAK FOR THE TRANSPORT ETF, AIRLINES, TRUCKERS, RAILROADS, DELIVERY SERVICES, 3 AIRLINE STOCKS, 2 TRUCKING STOCKS, OIL WEIGHS, OIL SERVICES HITS RESISTANCE --
by John Murphy,
Chief Technical Analyst, StockCharts.com
TRANSPORT ISHARES BREAKS CHANNEL LINE... Some transportation-related industry groups and stocks are at interesting junctures right now. First, the broader market is in an uptrend as the S&P 500 hit an all time high last week. Second, oil prices remain weak and this is beneficial to several transport-related...
READ MORE
MEMBERS ONLY

DOW JOINS S&P 500 IN RECORD HIGH -- NASDAQ NEARS TEST OF ITS 2000 HIGH -- GERMAN DAX HITS NEW RECORD -- BRITAIN MAY BE NEXT -- JAPAN REACHES 15-YEAR HIGH -- DOLLAR INDEX TESTS 20-YEAR RESISTANCE LINE -- EAFE ISHARES BREAK OUT TO UPSIDE ON GOOD VOLUME
by John Murphy,
Chief Technical Analyst, StockCharts.com
DOW JOINS REST OF THE MARKET IN NEW HIGHS. ... The chart picture for U.S. and global stocks brightened even further on Friday. [News that eurozone finance ministers offered Greece a four-month extension of its bailout package gave a late boost to global stocks]. All major U.S. stock hit...
READ MORE