MEMBERS ONLY

-- $SPX AND $NDX P&F CHARTS, AEROSPACE & DEFENSE ETF'S LEAD, 5 DEFENSE STOCKS, INTERNET ETF BREAKS OUT, 3 ISTOCKS CHALLENGING RESISTANCE, OIL STALLS, XLE GETS COLD FEET --

by John Murphy,
Chief Technical Analyst, StockCharts.com
REST AFTER BIG SURGE... Link for today's video. After big gains the first two weeks of February, stocks took a breather this week and consolidated. A rest after a sharp advance is perfectly normal at this stage. Among the groups, the Energy SPDR (XLE) fell back along with...
READ MORE
MEMBERS ONLY

JAPAN AND EUROPE LEAD EAFE ISHARES HIGHER -- GERMANY, FRANCE, AND THE UK LEAD EUROPE -- HOW TO HEDGE GERMAN ISHARES AGAINST WEAK EURO -- JAPANESE STOCKS NEAR 15-YEAR HIGH -- HEDGING AGAINST THE FALLING YEN HAS BEEN A GOOD IDEA
by John Murphy,
Chief Technical Analyst, StockCharts.com
EAFE ISHARES TURN UP ... Foreign stocks continue to show signs of strength. Chart 1 shows EAFE iShares (EFA) trading above its 200-day moving average after recently exceeding its late November peak. At the start of February, it also broke a declining resistance line drawn over June/September/November highs. That...
READ MORE
MEMBERS ONLY

US Equity Upside Breakout So Far So Good

by Martin Pring,
President, Pring Research
* -NASDAQ Composite offers quality upside leadership.
* -Watch the 5-year yield for a clue as to future rate movements.
* -Gold starting to show bull market characteristics but can it confirm with some positive trend action?
In last week’s article I drew your attention to the fact that the technical picture...
READ MORE
MEMBERS ONLY

-- THE KEY TO THE BREAKOUTS, MATERIAL SECTOR LEADERSHIP, SHORT-TERM BREADTH INDICATORS, UTILITIES ETFS HIT SUPPORT, TLT HITS FIBONACCI CLUSTER, OIL, GOLD, URANIUM AND LOTS OF STOCKS --
by John Murphy,
Chief Technical Analyst, StockCharts.com
WEBINAR CHARTS AND LINK... Stocks are short-term overbought after big runs in February, but the breakouts are holding and these are bullish until proven otherwise. Today's Webinar will look at five stock indices, sector High-Low Percent, a short-term breadth indicator, the utilities sector, the long-term Treasury bond ETF,...
READ MORE
MEMBERS ONLY

-- SURGE AND FOLLOW THROUGH, GROWTH VERSUS VALUE, BREAKING DOWN XLY AND XLF, WATER ETF GETS INTERESTING, FIVE STOCKS IN STRONG GROUPS, NEW HIGH PARADE --
by John Murphy,
Chief Technical Analyst, StockCharts.com
SURGE AND FOLLOW THROUGH BODES WELL... The major stock indices surged off support levels last week and followed through with breakouts this week. Chart 1 shows five major index ETFs on one chart for easy reference. The top chart shows the S&P 1500 hitting new highs in November-December,...
READ MORE
MEMBERS ONLY

GLOBAL STOCK RALLY IS STARTING TO BROADEN OUT -- GERMANY AND FRANCE LEAD EUROPE HIGHER -- GREEK STOCKS ARE BOUNCING FROM SUPPORT -- THE HEDJ IS THE BEST WAY TO HEDGE NEGATIVE IMPACT OF FALLING EURO -- SMALLER STOCKS LEAD S&P 500 HIGHER
by John Murphy,
Chief Technical Analyst, StockCharts.com
DOW JONES GLOBAL INDEX HITS THREE-MONTH HIGH ... One of the major concerns in the new year has been fear that foreign markets would start to weigh on U.S. stocks. Although U.S. stocks have been the strongest in the world, they need some help from foreign markets. They'...
READ MORE
MEMBERS ONLY
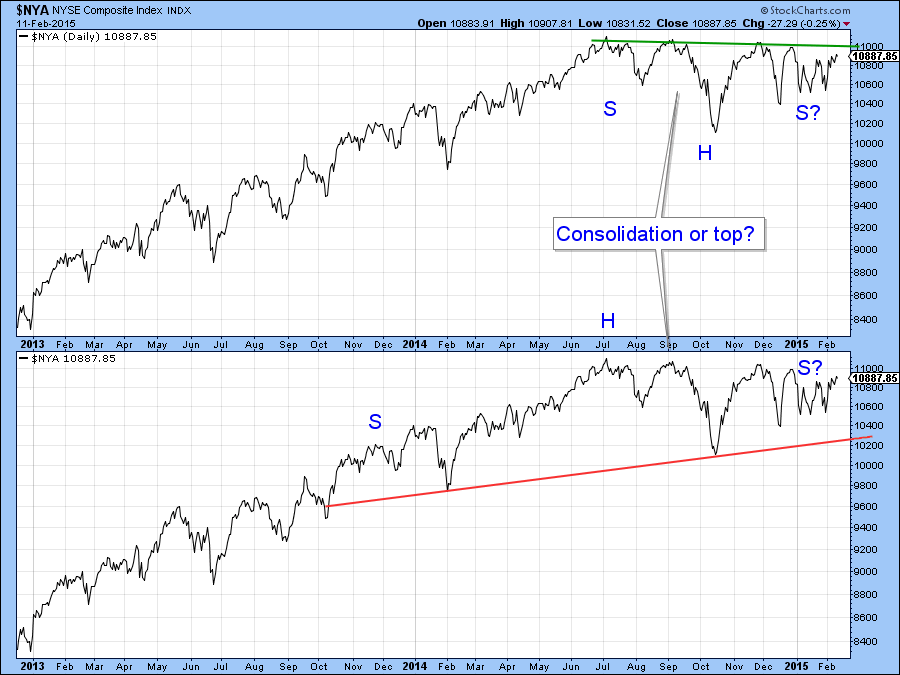
Forthcoming Big Move in Equities is Likely. The Question is Which Way will it Be?
by Martin Pring,
President, Pring Research
* The NYA starts to break down against the S&P again.
* Emerging markets ETF triggers some short-term sell signals.
* The EEM is resting above key long-term support.
US Equities
The market continues to frustrate both bull and bear alike as the major averages steadfastly refuse to break out from...
READ MORE
MEMBERS ONLY

INDEX OVERVIEW, RISK ON OR OFF?, XLF-XLK-XLY, HIGH-LOW INDICATORS, SECTOR RANKINGS, FOCUS ON UTILITIES, TWENTY STOCKS AND Q&A -- S&P 500 AND S&P MIDCAP 400 STALL AFTER BREAKOUTS -- IS RISK REALLY BACK ON? -- INDEX HIGH-LOW PERCENT
by John Murphy,
Chief Technical Analyst, StockCharts.com
WEBINAR CHARTS AND COMMENTARY... The market remains a mixed up beast over the last few months, but the bigger trend is still up and the bulk of the evidence is still bullish. Choppy trading over the last few months just means we had a consolidation within an uptrend. Major topping...
READ MORE
MEMBERS ONLY

QQQ LAGS WITH LOWER HIGH -- PERFCHART AND RRG FOR MAJOR INDEX ETFS -- MICROSOFT, INTEL AND AMGEN WEIGH -- GOOGLE STALLS AT RESISTANCE -- FACEBOOK NEARS SUPPORT -- AMGEN CORRECTS
by John Murphy,
Chief Technical Analyst, StockCharts.com
QQQ LAGS WITH LOWER HIGH... The Nasdaq 100 ETF (QQQ) is still lagging the broader market with a series of lower highs since December. Chart 1 shows QQQ breaking out in late October and hitting new highs throughout November. Relative weakness started in late December when QQQ failed to take...
READ MORE
MEMBERS ONLY

STRONG JOBS REPORT PUSHES INTEREST RATES SHARPLY HIGHER AND TREASURY BONDS LOWER -- HIGHER RATES BOOST BANKS AND BROKERS -- BUT HURT UTILITIES AND GOLD -- S&P 500 ENDS DAY LOWER WHICH KEEPS IT IN TRADING RANGE
by John Murphy,
Chief Technical Analyst, StockCharts.com
STRONG JOBS REPORT PUSH RATES HIGHER... A strong jobs report on Friday pushed interest rates sharply higher all across the yield curve. The daily bars in Chart 1 show the 10-Year Treasury Note yield jumping to the highest close in a month. [Bond prices fell sharply as a result]. Short-term...
READ MORE
MEMBERS ONLY

STRONG JOBS REPORT PUSHES FINANCIALS HIGHER -- BANKS AND BROKERS SURGE -- S&P 500 EXCEEDS JANUARY HIGH -- JUMP IN BOND YIELDS IS CAUSING PROFIT-TAKING IN REITS, UTILITIES, AND GOLD
by John Murphy,
Chief Technical Analyst, StockCharts.com
FINANCIALS LEAD MARKET RALLY ... A strong jobs report is pushing stock prices higher today. Chart 1 shows the Financials Sector SPDR (XLF) jumping above initial resistance at its late January peak (near 24.00) and climbing back over its 50-day line. Banks and brokers are leading the XLF higher. Chart...
READ MORE
MEMBERS ONLY
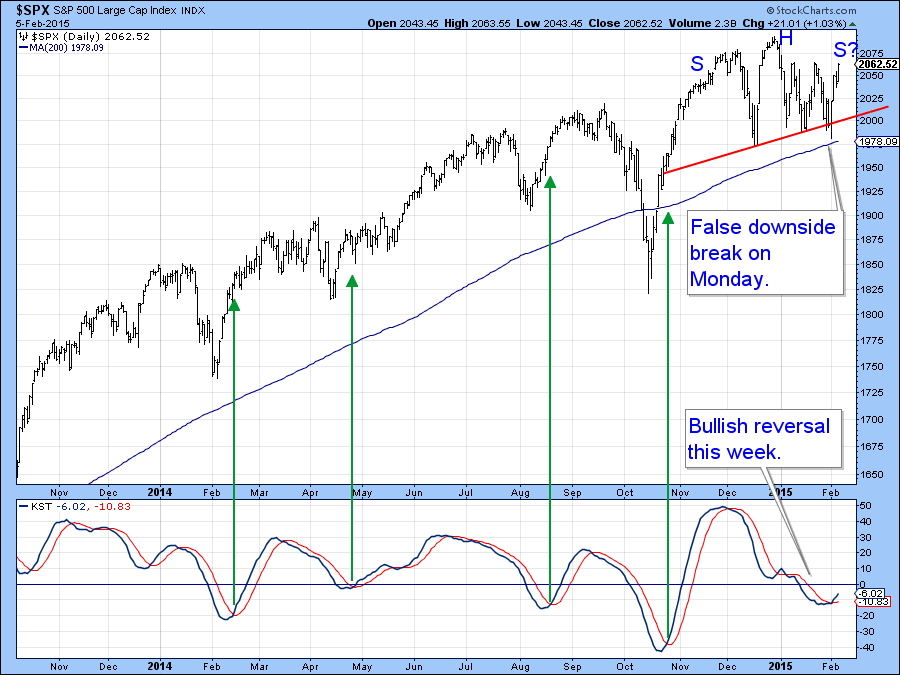
Moment of Truth Approaching for US Equities
by Martin Pring,
President, Pring Research
* Short-term oscillators turn bullish for equities
* EFA breaks above significant down trend line
* Gold short-term momentum reverses to the downside
US Equities
Last week the headline of my Market Roundup article read as follows, ”Will the end-of the month bullish seasonal for equities be enough to avoid a downside domino...
READ MORE
MEMBERS ONLY

DOW BREAKS THROUGH RESISTANCE -- SO DO MIDCAP AND SMALL CAPS -- S&P 500 SHOULD BE NEXT -- ENERGY SHARES ARE AT A LONG-TERM SUPPORT LEVEL AND MAY BE BOTTOMING -- THAT WOULD HINT AT A BOTTOM IN OIL
by John Murphy,
Chief Technical Analyst, StockCharts.com
DOW EXCEEDS CHART RESISTANCE... A 211 point gain in the Dow Industrials was enough to push it through initial chart resistance at its mid-December. That's a strong sign that the sidways price pattern in effect since early December is being resolved on the upside. The Dow isn'...
READ MORE
MEMBERS ONLY

FALLING OIL BOOSTS CONSUMER DISCRETIONARY STOCKS -- LEADERS INCLUDE DISNEY, WHIRLPOOL, AND KOHLS -- AUTOS AND HOMEBUILDES ALSO CLIMB -- GENERAL ELECTRIC AND FORD HAVE GOOD DAY -- RYLAND AND TOLL BROTHERS TURN UP
by John Murphy,
Chief Technical Analyst, StockCharts.com
CONSUMER DISCRETIONARY SPDR SHOWS RELATIVE STRENGTH... Consumer discretionary stocks have been among the biggest beneficiaries of falling oil prices. Today is no exception. With crude falling 8% during the day, consumer discretionary stocks are among the day's biggest gainers. The daily bars in Chart 1 show the Consumer...
READ MORE
MEMBERS ONLY

WEBINAR CHARTS AND LINK -- MARKET REMAINS STUCK, BUT NOT BROKEN -- RISK INDICATOR OVERVIEW -- SECTOR SPDRS AND THEIR SEVEN BREADTH INDICATORS -- 6 ETF CHARTS -- 9 STOCK CHARTS -- Q&A: CREATING SHADED BOXES, USING THE RAFF CHANNEL AND MORE
by John Murphy,
Chief Technical Analyst, StockCharts.com
WEBINAR CHARTS... The major index ETFs and key sector SDPDRs remain stuck in trading ranges, but we are seeing some promising signs over the last two days. As the charts in today's Webinar show, the Consumer Discretionary SPDR (XLY), Industrials SPDR (XLI) and Technology SPDR (XLK) all surged...
READ MORE
MEMBERS ONLY

DIA BREAKS TRIANGLE TREND LINE -- EQUAL-WEIGHT S&P 500 ETF TESTS KEY LEVEL -- FIVE SECTOR ETFS WITH REVERSAL PATTERNS -- BPI HITS MOMENT-OF-TRUTH FOR GOLD MINERS ETF -- GOLD TESTS BREAKOUT WITH A THROWBACK
by John Murphy,
Chief Technical Analyst, StockCharts.com
DIA BREAKS TRIANGLE TREND LINE... Link for today's video. Stocks came under selling pressure last week as the major index ETFs gapped down on Tuesday and stayed down. Chart 1 shows the Dow SPDR (DIA) gapping below 175 and closing below the lower trend line of a triangle....
READ MORE
MEMBERS ONLY

WEAK GDP REPORT PUSHES STOCKS LOWER IN HEAVY TRADING AND THREATENS SUPPORT -- S&P 500 WEEKLY CHART SHOWS NEGATIVE DIVERGENCES -- BONDS ARE OUTPEFORMING STOCKS IN NEW YEAR -- DROP IN TWO-YEAR YIELD SHOWS SOME LOSS OF CONFIDENCE
by John Murphy,
Chief Technical Analyst, StockCharts.com
FRIDAY SELLOFF IN HEAVY TRADING THREATENS CHART SUPPORT... Friday's disappointing fourth quarter GDP report of only 2.6% caused heavy selling of stocks and buying of bonds. The combination of falling stock prices and heavy volume gave the week's performance a negative look, and suggests tht...
READ MORE
MEMBERS ONLY

BATTLING SUPPORT AND CONSOLIDATING -- S&P MIDCAP CONSOLIDATES NEAR HIGHS -- SMALL AND MICRO CAPS PERK UP -- GROWTH OUTPERFORMS VALUE -- CONSUMER DISCRETIONARY HOLDING UP WELL, FINANCE NOT -- HOUSING AND RETAIL SPDRS BOUNCE ABOVE SUPPORT
by John Murphy,
Chief Technical Analyst, StockCharts.com
STILL BATTLING SUPPORT AND CONSOLIDATING... Link for today's video. The major stock indices remain range bound since early November, but these ranges still look like consolidations or corrections within bigger uptrends. Chart 1 shows the S&P 500 breaking out in late October on its way to...
READ MORE
MEMBERS ONLY

NEW LOWS IN CRUDE OIL AND TREASURY YIELDS INCREASE DEFLATIONARY CONCERNS -- STOCKS SELLOFF IN AFTERNOON TRADING -- DOW HITS NEW JANUARY LOW -- NASDAQ AND S&P 500 MAY CHALLENGE THEIR JANUARY LOWS -- VIX JUMPS 18%
by John Murphy,
Chief Technical Analyst, StockCharts.com
10-YEAR TREASURY TUMBLES AS OIL HITS NEW LOW... Deflationary forces continue to push commodity prices and bond yields lower. Most commodities fell again today, with most attention on oil. The black line in Chart 1 shows the United States Oil ETF (USO) falling to a new low today. So did...
READ MORE
MEMBERS ONLY

Will The End-Of-The-Month Bullish Seasonal for Equities Be Enough To Avoid A Downside Domino Effect?
by Martin Pring,
President, Pring Research
* NYSE Composite is forming a head and shoulders top or is it a bottom?
* IWM experiences false upside breakout
* SPY/EFA ratio is signaling a dollar correction. Will the Index take the bait?
* Wisdom Tree Yuan fund right on a key up trend line
I last wrote about the US...
READ MORE
MEMBERS ONLY

WEBINAR CHARTS -- DOW DIAMONDS PLUNGES AND EW S&P 500 ETF STALLS -- LARGE-CAP TECHS LEAD THE MARKET LOWER -- WEEKLY CHARTS FOR PERSPECTIVE -- MID-CAP HIGH-LOW PERCENT LEADS -- HIGH-LOW PERCENT FOR XLY AND XLK LAGS -- OIL AND ENERGY ETFS
by John Murphy,
Chief Technical Analyst, StockCharts.com
WEBINAR CHARTS... The major index ETFs have gone nowhere since mid November and continue to go nowhere during earnings season. For example, the S&P 500 SPDR (SPY) surged off support in the 2000 area with a 3% move last week and gave a chunk back with a decline...
READ MORE
MEMBERS ONLY

MID CAPS AND LARGE TECHS SHOW RELATIVE STRENGTH -- DR HORTON AND LENNAR LEAD ITB SUPPORT BOUNCE -- BIOTECHS SHOW BROAD STRENGTH -- CARZ BREAKS LATE DECEMBER HIGH -- TOYOTA AND DAIMLER LEAD -- GM HITS SUPPORT ZONE AS F CONSOLIDATES
by John Murphy,
Chief Technical Analyst, StockCharts.com
MID CAPS AND LARGE TECHS SHOW RELATIVE STRENGTH ... Link for today's video. The S&P MidCap SPDR (MDY) and the Nasdaq 100 ETF (QQQ) are starting to show relative strength, but in two different ways. Chart 1 shows QQQ with a breakout in late October and new...
READ MORE
MEMBERS ONLY

S&P 500 CONFIRMS KEY SUPPORT LEVEL -- $NDX FORMS BIG CONTINUATION PATTERN -- LARGE AND MID CAPS LEAD NEW HIGHS -- DEFENSIVE SECTORS LEAD RANKINGS -- XLU, XLP AND XLV HIT NEW HIGHS -- OFFENSIVE SECTORS SURGE OFF SUPPORT -- UPS SHOWS CHALLENGE OF EARNINGS
by John Murphy,
Chief Technical Analyst, StockCharts.com
S&P 500 SURGES TO CONFIRM KEY SUPPORT LEVEL... Link for today's video. Stocks bounced this week with broad strength that reinforced support areas for several key indices. Chart 1 shows the S&P 500 breaking above the 2000 area in November and successfully testing this...
READ MORE
MEMBERS ONLY

EUROPEAN STOCKS LEAD GLOBAL RALLY ON ECB ACTION -- GERMANY AND FRANCE LEAD EUROPE RALLY -- BUT EURO FALLS TO ELEVEN-YEAR LOW -- WEAK OIL BOOSTS RETAILERS AND TRANSPORTS AS U.S. STOCKS RALLY -- S&P 500 CLEARS 50-DAY LINE -- VIX PLUNGES
by John Murphy,
Chief Technical Analyst, StockCharts.com
ECB COMES THROUGH ... The ECB gave the world's financial markets what they wanted, and a little bit more. Mario Draghi expanded the ECB asset-buying program to include sovereign bonds to the tune of 60 billion euros per month at least until the end of September 2016. That comes...
READ MORE
MEMBERS ONLY

ECB BOND BUYING MIGHT HELP EURO STOCKS, BUT NOT THE CURRENCY -- THE WISDOM TREE EUROPE HEDGED EQUITY FUND HEDGES OUT WEAK EURO -- CURRENCY VOLATILITY PUSHES MONEY INTO GOLD -- HOMEBUILDERS DROP BACK TO 200-DAY AVERAGE
by John Murphy,
Chief Technical Analyst, StockCharts.com
ECB IS EXPECTED TO START QE TOMORROW... The ECB is expected to announce a quantitative easing program tomorrow (Thursday) which will involve buying sovereign bonds. [A leak today outlining some of the details of that program helped stabilize stocks here and in Europe]. Expectations for QE over the past few...
READ MORE
MEMBERS ONLY

WEBINAR CHARTS -- IWM AND IWC STILL HOLDING BREAKOUTS -- RSP AND SPY STALL AFTER BREAKOUTS -- SECTOR PERFORMANCE REFLECTS A MIXED MARKET -- RANKING 27 SECTORS -- QQQ AND TOP TECHS LAG -- AIRLINES CONTINUE TO LEAD
by John Murphy,
Chief Technical Analyst, StockCharts.com
WEBINAR CHARTS ... Click here for the Webinar recording. These are the charts and commentary from Tuesday's Webinar (20-January). Trading remains quite choppy and we can see this in sector performance since early November. In fact, the stock market as a whole has gone nowhere since early November. Well,...
READ MORE
MEMBERS ONLY

The Rest of the World May be About to Beat US Equities for a While
by Martin Pring,
President, Pring Research
* Europe and Emerging Market equities positioned to move higher.
* Philippine ETF breaks to the upside.
* Silver breaks convincingly to the upside.
* Gold breaks out against US equities.
US versus the World
The trend favoring US equities over most of the rest of the world, may be in the process of...
READ MORE
MEMBERS ONLY

PUTTING THE PULLBACK INTO PERSPECTIVE -- RISK INDICATORS TURN NEGATIVE -- UTILITIES AND REITS CONTINUE TO ROCK -- WHY SO MANY NEW HIGHS IN XLF? -- XLY TESTS SUPPORT AS HIGH-LOW PERCENT TEETERS
by John Murphy,
Chief Technical Analyst, StockCharts.com
PUTTING THE DECLINE INTO PERSPECTIVE... Link for today's video. The financial markets have been quite risk averse lately and the US stock market has been quite defensive over the last few weeks, but the S&P 500 is still less then 5% from an all time closing...
READ MORE
MEMBERS ONLY

COPPER PLUNGES TO SIX-YEAR LOW -- FREEPORT MCMORAN PLUNGES ALONG WITH IT -- 10-YEAR BOND YIELD FALLS TO 20-MONTH LOW ON DEFLATION -- FALLING BOND YIELDS HURT BANK STOCKS -- RISING VIX SUGGESTS PERIOD OF LOW VOLATILITY MAY BE ENDING
by John Murphy,
Chief Technical Analyst, StockCharts.com
COPPER FALLS TO SIX-YEAR LOW... It seems all we've hearing about lately is the plunge in the price of oil. That has led to a debate as to whether the plunge in crude is just the result of increased supply, or a sign of a weakening global economy....
READ MORE
MEMBERS ONLY

WEBINAR CHARTS - KEEPING YOUR EYE ON THE TREND -- SMALL-CAPS AND MICRO-CAPS ARE STILL OK -- INDEX AD LINES HOLD SUPPORT -- HIGH-LOW PERCENT INDICATORS REMAIN BULLISH -- A NOT-SO-SURPRISING SMALL-CAP LEADER -- FOUR STRONG SMALL-CAP SECTORS
by John Murphy,
Chief Technical Analyst, StockCharts.com
KEEPING YOUR EYE ON THE TREND... Link for today's video. These are the charts and commentary from Tuesday's Webinar (13-January). Trading has turned choppy in the major index ETFs since mid November, but sideways price action is not enough to derail the bigger uptrends. There are...
READ MORE
MEMBERS ONLY

TRACKING 10 KEY INDUSTRY GROUP ETF'S -- BANKS POINT SOUTHWEST AS HOMEBUILDERS POINT NORTHEAST -- ENERGY SHARES LEAD MARKET LOWER -- FINANCE SPDR FILLS A PAIR OF GAPS -- REGIONAL BANKS WEIGH ON FINANCE SECTOR -- 5-YR YIELD AND STOCK MARKET CORRELATION
by John Murphy,
Chief Technical Analyst, StockCharts.com
TRACKING 10 KEY INDUSTRY GROUP ETF'S... Link for today's video. PerfChart 1 shows year-to-date performance for 10 ETFs that represent different groups in the stock market. I normally use the Oil & Gas Equipment & Services SPDR (XES) and the Metals & Mining SPDR (XME) on...
READ MORE
MEMBERS ONLY
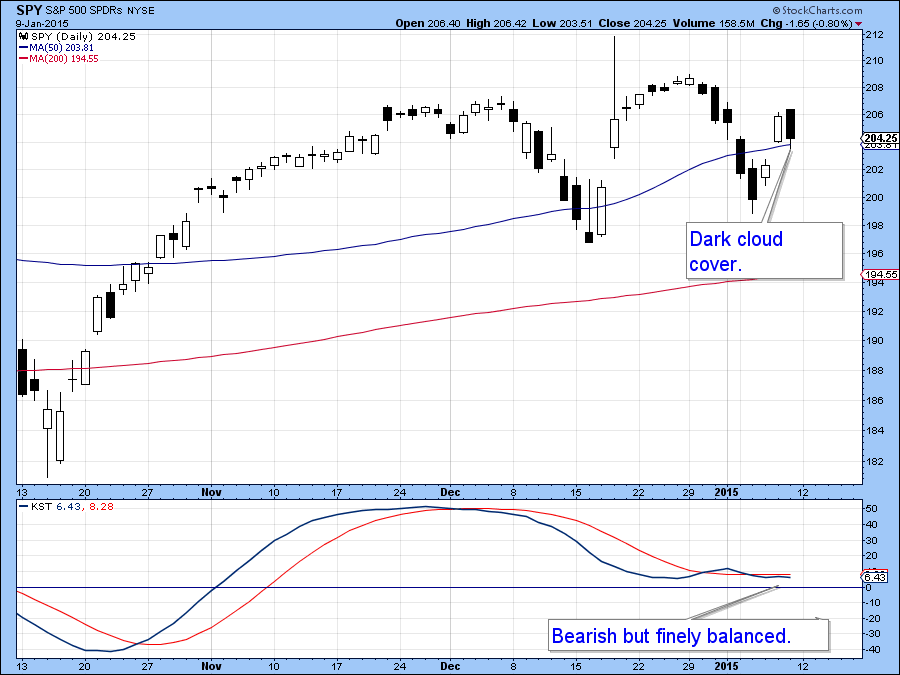
Friday's Stock Market Action Hints at Further Weakness to Come Near-term
by Martin Pring,
President, Pring Research
* World Stock ETF getting closer to completing a top.
* Gold in euro and yen build on recent breakouts.
* Dollar denominated gold close to an upside breakout.
US Equities
On Friday the S & P Composite ($SPX) experienced the second day of a dark cloud cover formation, a bearish candlestick pattern....
READ MORE
MEMBERS ONLY

MID-CAP SPDR TURNS CHOPPY, BUT MAINTAINS DIRECTIONAL BIAS -- KEY LEVELS TO WATCH FOR THE OFFENSIVE SECTOR ETFS -- DO SECTOR ROTATIONS SUPPORT THE BULLS? (RRG DEMO) -- ECONOMIC INDICATORS SHOW MORE STRENGTH THAN WEAKNESS
by John Murphy,
Chief Technical Analyst, StockCharts.com
MID-CAP SPDR TURNS CHOPPY, BUT MAINTAINS DIRECTIONAL BIAS... Link for today's video. Establishing support and resistance levels for indices and ETFs with dozens of stocks is a challenge because there are so many moving parts (stocks). Instead of exact support-resistance levels based on one chart feature, I prefer...
READ MORE
MEMBERS ONLY

MARKET INDEXES SCORE BIG GAINS -- EUROPE GAINS EVEN MORE AND BOUNCES OFF CHART SUPPORT -- ENERGY SHARES REBOUND WITHIN MAJOR DOWNTREND -- HOMEBUILDER ETF RESUMES UPTREND
by John Murphy,
Chief Technical Analyst, StockCharts.com
STOCK INDEXES SCORE BIG GAINS... Global stocks are experiencing a nice bounce today with major U.S. stock indexes experiencing gains of nearly 2%. Chart 1 shows the Dow Industrials climbing well above its 50-day average after holding above chart support at its mid-December low. Chart 2 shows a similar...
READ MORE
MEMBERS ONLY

NEXT DOWNSIDE TARGET FOR CRUDE OIL RANGES FROM $40 TO THE MID-$30S -- GLOBAL DEFLATIONARY PRESSURES PULL 10-YEAR TREASURY YIELD BELOW 2% -- FALLING FOREIGN CURRENCIES SHOW WEAKNESS ABROAD -- EMU ISHARES HAVE WEIGHED ON U.S. STOCKS
by John Murphy,
Chief Technical Analyst, StockCharts.com
LONGER RANGE VIEW OF CRUDE OIL ... The plunging price of oil is driving financial trends all over the world. Plunging oil is hurting energy companies that produce that commodity, as well as countries that are energy exporters. In addition, its deflationary effect is pulling global bond yields lower and contributing...
READ MORE
MEMBERS ONLY

SPY CORRECTS WITHIN WELL DEFINED UPTREND -- RISK INDICATORS TURNED MIXED -- JUNK BONDS GET SLAMMED AGAIN -- TREASURY YIELDS CONTINUE TO CONVERGE -- NEW HIGHS DRY UP, BUT BREADTH REMAIN BULLISH -- UTILITIES AND FINANCE STILL LEAD SECTOR BREADTH
by John Murphy,
Chief Technical Analyst, StockCharts.com
SPY AND DIA CORRECT WITHIN WELL DEFINED UPTRENDS... Stocks were hit with intense selling pressure over the last few days, but these declines have yet to turn key breadth indicators bearish or even test major support levels. Today we will look at three major index charts, some key breadth charts,...
READ MORE
MEMBERS ONLY

MSCI World ETF and NYSE Composite Violate their 12-month Moving Averages. Is This the Start of a Primary Bear Market?
by Martin Pring,
President, Pring Research
* Much expected Santa Rally did not happen and that’s bearish.
* MSCI Europe Australia Far East ETF right on the brink of a major breakdown.
* Small caps may have experienced a false upside breakout.
* Chinese ETF breaks out big time on both an absolute and relative basis.
In my mid-December...
READ MORE
MEMBERS ONLY

OIL SINKS TO YET ANOTHER NEW LOW -- ENERGY SPDR REVERSES IN KEY RETRACEMENT ZONE -- STEEL STOCKS WEIGH ON METALS & MINING SPDR -- GOLD AND THE 2011 EUROPEAN CRISIS -- GOLD AND THE 2015 CHART -- GOLD, THE DOLLAR AND CORRELATION
by John Murphy,
Chief Technical Analyst, StockCharts.com
OIL SINKS TO YET ANOTHER NEW LOW... Link for today's video. Chart 1 shows the USO Oil Fund (USO) falling some 3% on Monday and hitting yet another new low. The pattern since August has been decline, consolidate, break down and repeat. Oil has not really bounced the...
READ MORE
MEMBERS ONLY

THE 18-YEAR REAL ESTATE CYCLE STILL HAS A LONG WAY TO GO BEFORE HITTING ANOTHER PEAK -- THE CASE-SHILLER HOME PRICE INDEX NEARS SIX-YEAR HIGH -- RISING REITS AND HOMEBUILDERS ARE LEADING INDICATORS -- WE'RE STILL IN EARLY STAGES OF REAL ESTATE UPTURN
by John Murphy,
Chief Technical Analyst, StockCharts.com
THERE IS AN 18-YEAR REAL ESTATE CYCLE ... My 2013 book entitled "Trading With Intermarket Analysis" described the existence of an 18-year real estate cycle. In other words, real estate tends to peak about every 18 years. This reliable pattern has been traced back to the 1800s. Credit for...
READ MORE
MEMBERS ONLY
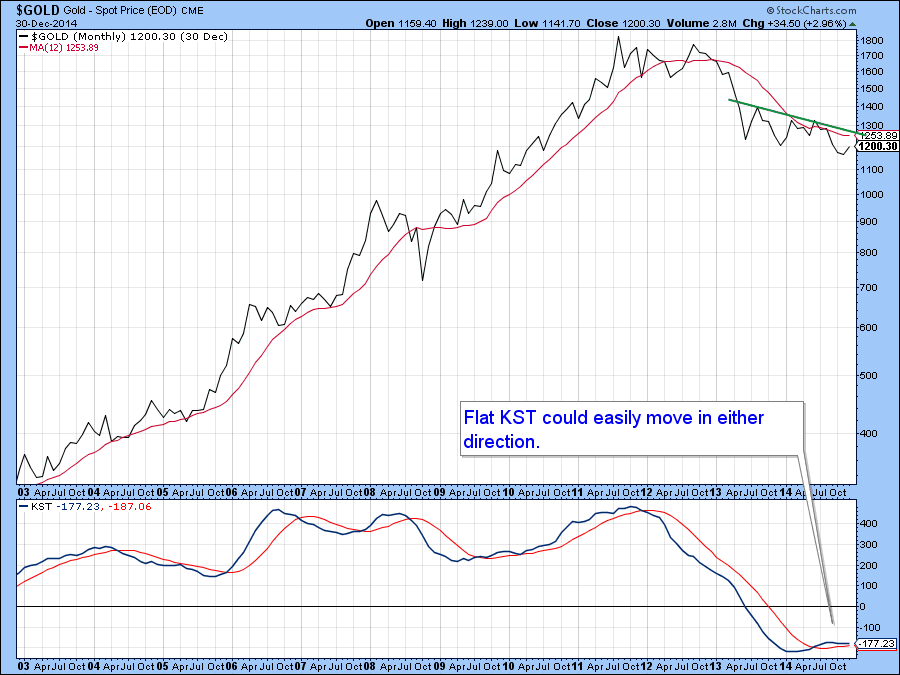
An Important Move is Likely for Gold and Silver in Early 2015. Here are the Chart Points to Watch
by Martin Pring,
President, Pring Research
* Dollar based gold is in a bear market.
* Yen and euro denominated gold are in primary bull markets.
* Gold shares complete a massive top.
Last week we reviewed the technical picture of the major currencies. This week it is the turn of the precious metals because the finely balanced technical...
READ MORE