MEMBERS ONLY
Dollar Index Faces Important Technical Test

Click here for a written version of this article.... READ MORE
Click here for a written version of this article.... READ MORE


COPPER PRICES HIT FIVE-MONTH HIGH... Copper prices are turning in a strong performance. Chart 1 shows the September 2014 futures contract (^HGU14) climbing sharply to reach a five-month high (see arrow). The industrial metal has also climbed over its 200-day moving average. Chart 2 shows that rise also being reflected... READ MORE

SMALL AND MID CAP ETFS HIT NEW HIGHS... Link for today's video. The S&P MidCap 400 (MDY) and S&P SmallCap iShares (IJR) were lagging the S&P 500 SPDR and Nasdaq 100 ETF in late May, but started playing catch up in June... READ MORE

REGIONAL BANK SPDR STALLS AFTER BIG MOVE... Link for today's video. Chart 1 shows the Regional Bank SPDR (KRE) holding support near the 37 area and surging above 39 in early June. Overall, the trend on the weekly chart is up because the ETF hit a new high... READ MORE

COMMODITIES AND STOCKS WERE TOP FIRST HALF PERFORMERS... With the first half of the year coming to a close, it's a good time to study the relative performances of the various asset classes. Chart 1 shows that commodities and stocks were the two biggest gainers -- and in... READ MORE

STOCKS STALL, BUT SELLING PRESSURE REMAINS SUBDUED... Link for today's video. After hitting a new high last week, the Russell 1000 iShares (IWB) was hit with sudden selling pressure on Tuesday afternoon. This reversal day certainly looked negative on an intraday or candlestick chart, but it was not... READ MORE

OLD TECH LEADERS RESUME PUSH TO TRY FOR HIGHER HIGHS... While the Nasdaq 100 ($NDX) shown in Chart 1 has pushed above the March 6th highs, some of the high momentum leaders like Amazon (AMZN) have remained well back as shown on Chart 2. AMZN is still struggling with the... READ MORE

SEASONAL LOWS SETTING UP IN CORN AND WHEAT... Corn ($CORN) has a six month cyclical pattern where it marks significant sudden reversals as shown in Chart 1. The July 1 period is extremely volatile. The June 30 release of the crop report is one of the main reasons for the... READ MORE

BOND YIELD CONTINUES TO WEAKEN... The daily bars in Chart 1 show the 10-Year Treasury Note Yield ($TNX) falling to the lowest level in a month. It also remains below moving average lines. Part of the yield drop may be the result of some flight to the safety of Treasury... READ MORE

* Several market averages experience bearish outside days. * NASDAQ Composite forms bearish Pinocchio bar * Brokers leading the market lower * Further dollar weakness anticipated * Gold just below key resistance * Commodities break out from a nice base US Equities I have been saying for several weeks that the market is overextended but that... READ MORE

NASDAQ 100 ETF STAYS OVERBOUGHT AND BULLISH... Link for today's video. Chart 1 shows the Nasdaq 100 ETF (QQQ) leading the market with a modest gain and a new high on Tuesday. Yes, the overbought simply become even more overbought. QQQ broke resistance in the 90-91 area and... READ MORE

BASE METALS ETF HITS FOUR-MONTH HIGH... Link for today's video. Chart 1 shows the Base Metals ETF (DBB) making waves with a resistance breakout and four-month high. I featured DBB in the Market Message on June 2nd as it challenged resistance and on June 9th as an inverse... READ MORE

ENERGY AND METALS LEAD COMMODITY RALLY... The weekly bars in Chart 2 show the Reuters/Jefferies CRB Index closing at the highest level since the third quarter of 2012. [The CRB Index includes 19 commodities that are traded on exchanges in the U.S. and U.K.]. Commodity prices turned... READ MORE

SECTOR MAJORITY REMAINS BULLISH... Link for today's video. The overall picture remains bullish for stocks. Note that seven major index ETFs hit new highs this week. These include the Nasdaq 100 Equal-Weight ETF, Nasdaq 100 ETF, Russell 1000 iShares, S&P 1500 ETF, S&P MidCap... READ MORE
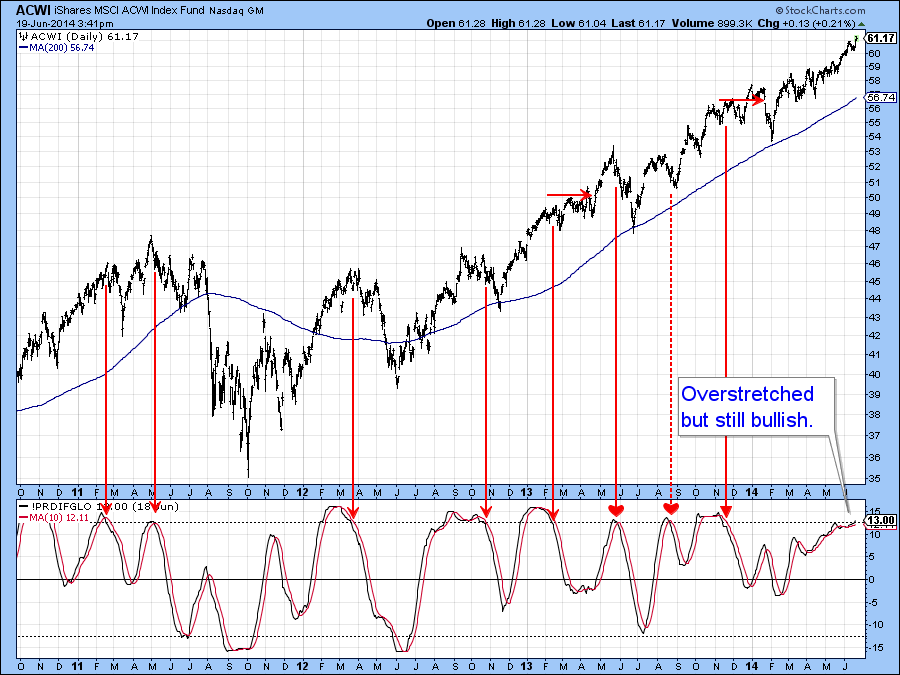
* Equities remain overstretched. * Japanese ETF just below key resistance. * Bonds look vulnerable as short-term rates break to the upside. * Dollar Index triggers a sell signal. * Gold is cloe to confirming a primary bull market. * Commodities acting consistently with a primary bull market. (Click here for the narrated video version of... READ MORE

FEDERAL RESERVE MEETING SENDS MARKET TO NEW HIGHS... The equities market S&P 500 ($SPX) clearly liked the Fed announcement yesterday. It pushed the market back up above the highs of last week after some small range days Friday through to Tuesday. Sometimes the Fed day can be a... READ MORE

SMALL-CAP ETFS HOLD BREAKOUTS AND CONTINUE TO LEAD... Link for today's video. A strong breakout should hold, and a weak breakout should fold. The Russell 2000 ETF (IWM) and S&P SmallCap iShares (IJR) broke out with big moves over the last four weeks and it is... READ MORE

SOLAR ENERGY ETF BOUNCES OFF KEY MOVING AVERAGE ... Link for today's video. The Solar Energy ETF (TAN) is perking up with a bounce off its rising 200-day moving average and a break above the 50-day moving average. Chart 1 shows TAN hitting a new high near 50 and... READ MORE

EMERGING MARKETS ISHARES ARE TESTING RESISTANCE... My May 28 message showed emerging market stocks moving up toward overhead resistance. That testing process continues. The weekly bars in Chart 1 show Emerging Markets iShares (EEM) ending the week above their October intra-day high (43.52), but still below their December 2012... READ MORE

STOCKS DESERVE A CORRECTION AFTER BIG MOVES... Link for today's video. Stocks went on a tear with big gains from mid April to mid June. PerfChart 1 shows the percentage gains for the major index ETFs from April 11th to June 12th. The Nasdaq 100 ETF and Nasdaq... READ MORE

$SPX BREAKS THROUGH TO A 50 YEAR RECORD... The S&P 500 ($SPX) recorded its 81st week since touching the 200 DMA back in 2012. This is the longest streak surpassing both the 1986 and the 1965 streak of 80 weeks. Pretty amazing. This chart shows some of the... READ MORE

* More signs of an intermediate peak in the bond market. * Dollar Index is now overbought. * Gold and gold shares are down, but not yet out. * Commodities continue to struggle at key short-term support. US Equities The short-term uptrend remains intact but is becoming overextended. You can see this from the... READ MORE

WILL THE STRONGEST SECTOR IN THE FIRST HALF REPEAT?... Link for today's video. The utilities sector is the strongest of the nine sectors so far this year. This is true for the sector SPDRs, which are weighted by market cap, and the equal-weight sector ETFs. Chart 1 shows... READ MORE

BASE METALS ETF FORMS REVERSAL PATTERN... Video will be posted soon. The Base Metals ETF (DBB) continues to challenge resistance as an inverse head-and-shoulders pattern takes shape. I featured DBB last week and showed the strong correlation to copper. Today, I would like to expand on DBB by looking at... READ MORE

NASDAQ AND RUSSELL 2000 CHARTS TURN POSITIVE... This week's strong chart action in the Nasdaq market and small caps has lent more support to large cap stock indexes that have been setting new record highs. Chart 1 shows Powershares QQQ Trust breaking out to a new recovery high... READ MORE

* US Equity market trend is still positive but more cracks appearing. * Bond rally may well be over, but confirmation is needed. * Dollar Index rally likely to extend. * More base building in the gold market is likely. (Click here for the narrated video version of this article) US Equities Last week... READ MORE

THE MAJORITY RULES FOR THE MAJOR INDEX ETFS... Link for today's video. The Russell 2000 ETF (IWM), Russell MicroCap iShares (IWC) and S&P SmallCap iShares (IJR) are underperforming and well below their March highs, but they are the minority and may be poised to play catch-up.... READ MORE

THE EURO SLINGSHOTS HIGHER ON MAJOR ECB ANNOUNCEMENTS... The Euro ($XEU) traded in a wide range this morning after the ECB announced strategy changes on monetary policy. While the majority of changes had been leaked to the market in advance, the Euro still reacted with a big 1.7 cent... READ MORE

CHIPS CONTINUE TO EXCEL... Last Wednesday's message showed the Market Vectors Semiconductor ETF (SMH) moving up to challenge its 2014 highs. It has since broken out to the highest level in fourteen years. Chart 1 shows the PHLX Semiconductor iShares (SOXX) doing the same. I'm switching... READ MORE

MACD MAKES A KEY CROSS FOR THE AUTO INDEX... Link for today's video. I featured the DJ US Auto Index on May 20th as a large consolidation formed and the MACD line flattened. Auto stocks are getting a boost today after Chrysler, which is owned by Fiat (FIATY)... READ MORE

RELATIVE WEAKNESS IN KEY GROUPS UNDERMINES MARKET... Link for today's video. The S&P 500 and Dow Industrials notched new highs yet again, but the Russell 2000 remains well below its spring highs and continues to lag. Chart 1 shows the Russell 2000 in red and the... READ MORE

DOLLAR BOUNCE IS TIED MAINLY TO EURO DROP... When studying the trend of the U.S. Dollar Index, it's a good idea to study the trend of the Euro as well. That's because the Euro has the biggest influence on dollar direction (57%). [The Japanese yen... READ MORE

$TRAN SOARS WITH TRUCKING, AIRLINES AND RAILS ALL IN GEAR... The Dow Jones Transportation Index ($TRAN) has clearly broken out to new highs as shown in Chart 1. There are three sub-indexes that make up the Transportation Index; Airlines ($DJUSAR), Rails ($DJUSRR) and Trucking ($DJUSTK). All three sub-indexes have soared... READ MORE

* S&P Breaks to a new high, but leaves a lot to be desired. * Bond rally intact but getting overstretched. * Dollar Index is breaking to the upside. * Euro experiences a double whipsaw breakout. * Gold violates a key support trend line. * Commodities face an important test of the bull market... READ MORE

THE S&P 500 MAKES A NEW HIGH. ... The S&P 500 ($SPX) shown in Chart 1 is climbing to a new intraday high for the third day in a row. This new high is supported by the French ($CAC) and German ($DAX) markets also making new highs... READ MORE

EEM STILL TESTING TRENDLINE RESISTANCES... My May 18 message suggested that emerging markets might be approaching an important upside breakout. The weekly bars in Chart 1 show the Emerging Markets iShares (EEM) still testing the upper resistance line in three-year symmetrical triangle. A decisive close above that resistance line is... READ MORE

S&P 1500 ETF FORMS BULLISH CONTINUATION PATTERN... Link for today's video. The head-and-shoulders pattern can be a reversal pattern or a continuation pattern. The difference depends on the price movement preceding the pattern. There are two types of head-and-shoulders patterns: normal and inverse. The direction of... READ MORE

HOMEBUILDERS BOUNCE ... A bigger than expected rise in April new home sales gave a big boost to homebuilding stocks at week's end. And it couldn't have come at a better time. Chart 1 shows the Dow Jones U.S. Home Construction iShares (ITB) climbing more than... READ MORE